
|
|||||
|
 | |
| |
| |
| |
| |
| |
|
Gene: CAAP1 |
Gene summary for CAAP1 |
| Gene information | Species | Human | Gene symbol | CAAP1 | Gene ID | 79886 |
| Gene name | caspase activity and apoptosis inhibitor 1 | |
| Gene Alias | C9orf82 | |
| Cytomap | 9p21.2 | |
| Gene Type | protein-coding | GO ID | GO:0006508 | UniProtAcc | Q9H8G2 |
Top |
Malignant transformation analysis |
| Identification of the aberrant gene expression in precancerous and cancerous lesions by comparing the gene expression of stem-like cells in diseased tissues with normal stem cells |
| Entrez ID | Symbol | Replicates | Species | Organ | Tissue | Adj P-value | Log2FC | Malignancy |
| 79886 | CAAP1 | HTA11_3410_2000001011 | Human | Colorectum | AD | 8.97e-06 | -4.10e-01 | 0.0155 |
| 79886 | CAAP1 | HTA11_866_2000001011 | Human | Colorectum | AD | 4.33e-05 | -2.39e-01 | -0.1001 |
| 79886 | CAAP1 | HTA11_7696_3000711011 | Human | Colorectum | AD | 1.11e-07 | -3.83e-01 | 0.0674 |
| 79886 | CAAP1 | HTA11_99999971662_82457 | Human | Colorectum | MSS | 9.20e-06 | -3.27e-01 | 0.3859 |
| 79886 | CAAP1 | HTA11_99999973899_84307 | Human | Colorectum | MSS | 1.86e-02 | -5.48e-01 | 0.2585 |
| 79886 | CAAP1 | HTA11_99999974143_84620 | Human | Colorectum | MSS | 4.99e-22 | -5.10e-01 | 0.3005 |
| 79886 | CAAP1 | A001-C-207 | Human | Colorectum | FAP | 8.55e-03 | -3.64e-01 | 0.1278 |
| 79886 | CAAP1 | A015-C-203 | Human | Colorectum | FAP | 1.38e-33 | -6.04e-01 | -0.1294 |
| 79886 | CAAP1 | A015-C-204 | Human | Colorectum | FAP | 7.10e-05 | -4.09e-01 | -0.0228 |
| 79886 | CAAP1 | A014-C-040 | Human | Colorectum | FAP | 3.43e-03 | -5.07e-01 | -0.1184 |
| 79886 | CAAP1 | A002-C-201 | Human | Colorectum | FAP | 5.64e-12 | -4.44e-01 | 0.0324 |
| 79886 | CAAP1 | A002-C-203 | Human | Colorectum | FAP | 1.93e-09 | -2.73e-01 | 0.2786 |
| 79886 | CAAP1 | A001-C-119 | Human | Colorectum | FAP | 2.67e-10 | -5.82e-01 | -0.1557 |
| 79886 | CAAP1 | A001-C-108 | Human | Colorectum | FAP | 2.70e-25 | -5.04e-01 | -0.0272 |
| 79886 | CAAP1 | A002-C-205 | Human | Colorectum | FAP | 2.08e-21 | -5.98e-01 | -0.1236 |
| 79886 | CAAP1 | A001-C-104 | Human | Colorectum | FAP | 2.95e-08 | -2.99e-01 | 0.0184 |
| 79886 | CAAP1 | A015-C-005 | Human | Colorectum | FAP | 1.32e-07 | -4.74e-01 | -0.0336 |
| 79886 | CAAP1 | A015-C-006 | Human | Colorectum | FAP | 4.31e-16 | -6.24e-01 | -0.0994 |
| 79886 | CAAP1 | A015-C-106 | Human | Colorectum | FAP | 3.61e-15 | -3.19e-01 | -0.0511 |
| 79886 | CAAP1 | A002-C-114 | Human | Colorectum | FAP | 5.51e-16 | -5.25e-01 | -0.1561 |
| Page: 1 2 3 4 5 6 7 |
| Tissue | Expression Dynamics | Abbreviation |
| Colorectum (GSE201348) |  | FAP: Familial adenomatous polyposis |
| CRC: Colorectal cancer | ||
| Colorectum (HTA11) | 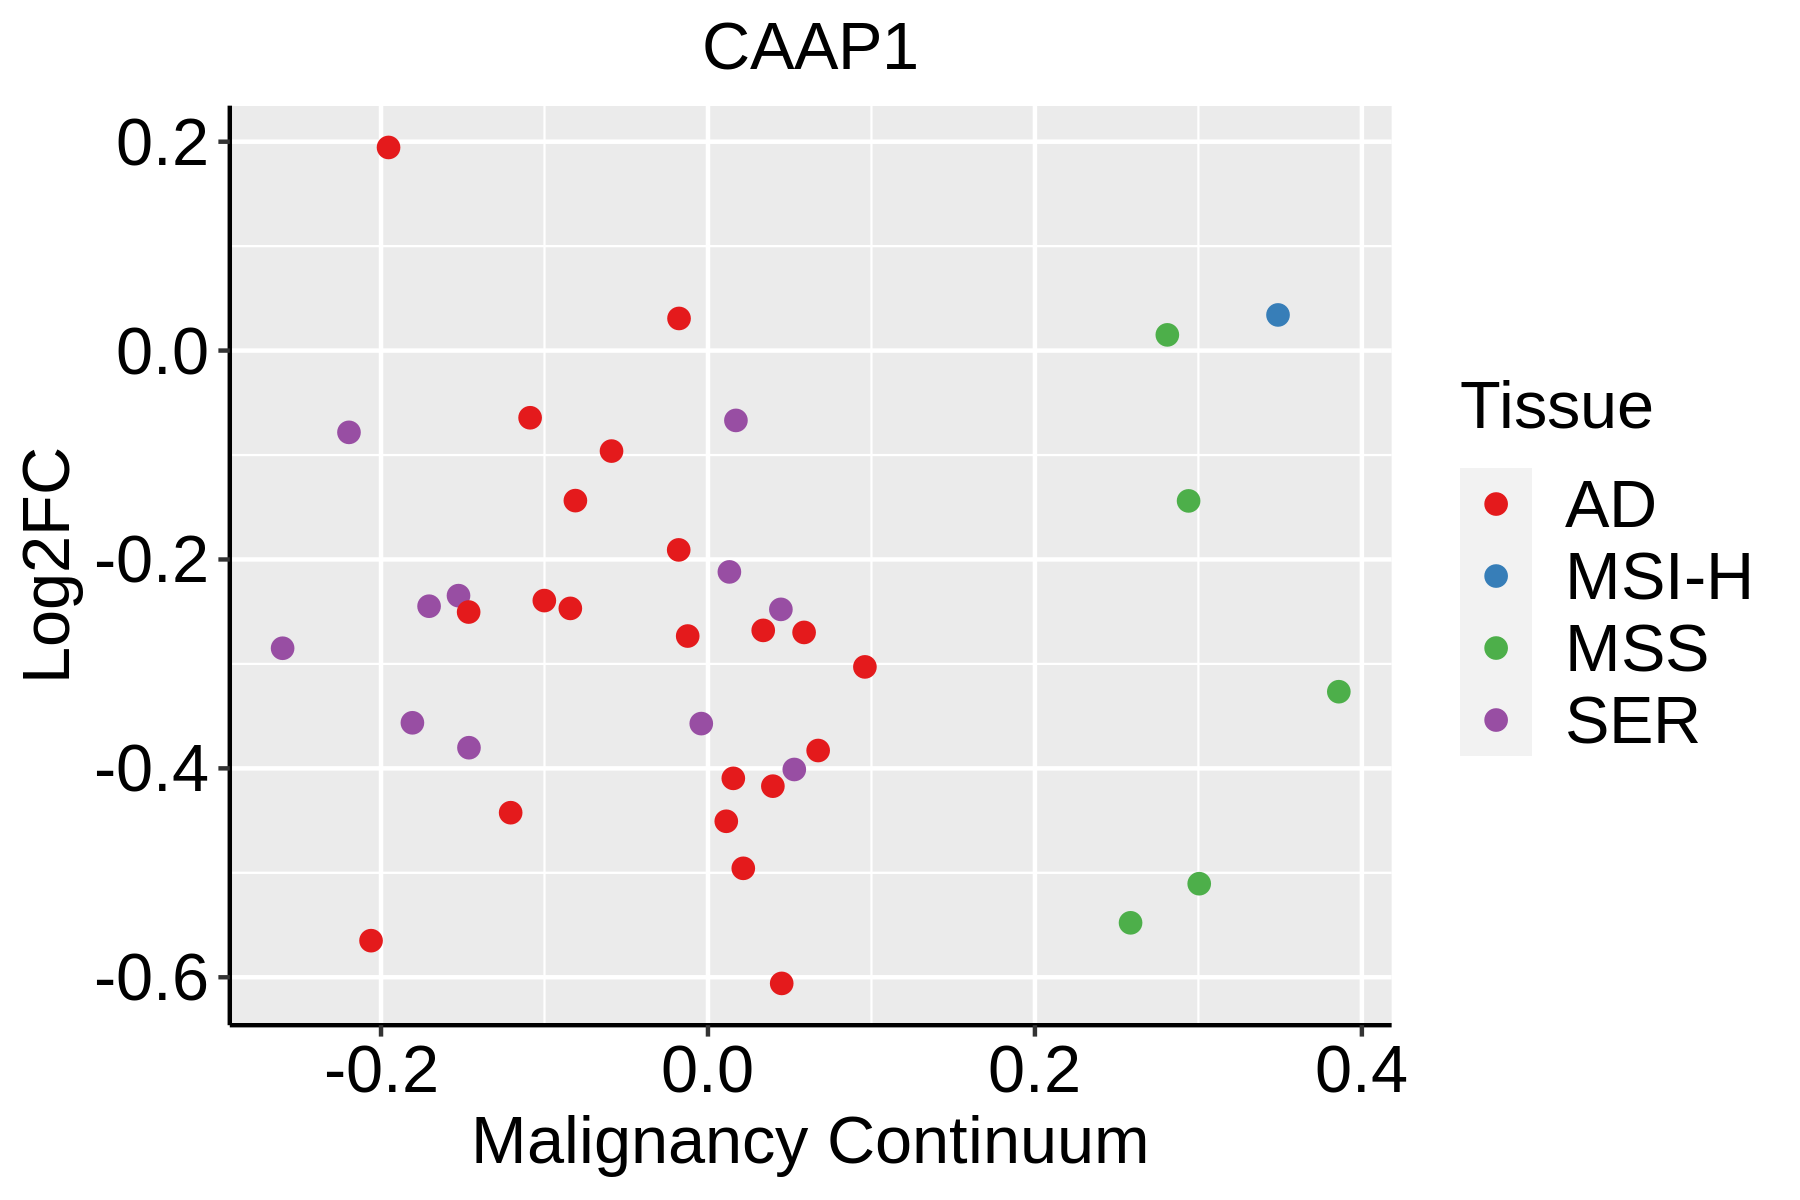 | AD: Adenomas |
| SER: Sessile serrated lesions | ||
| MSI-H: Microsatellite-high colorectal cancer | ||
| MSS: Microsatellite stable colorectal cancer | ||
| Esophagus |  | ESCC: Esophageal squamous cell carcinoma |
| HGIN: High-grade intraepithelial neoplasias | ||
| LGIN: Low-grade intraepithelial neoplasias | ||
| Liver | 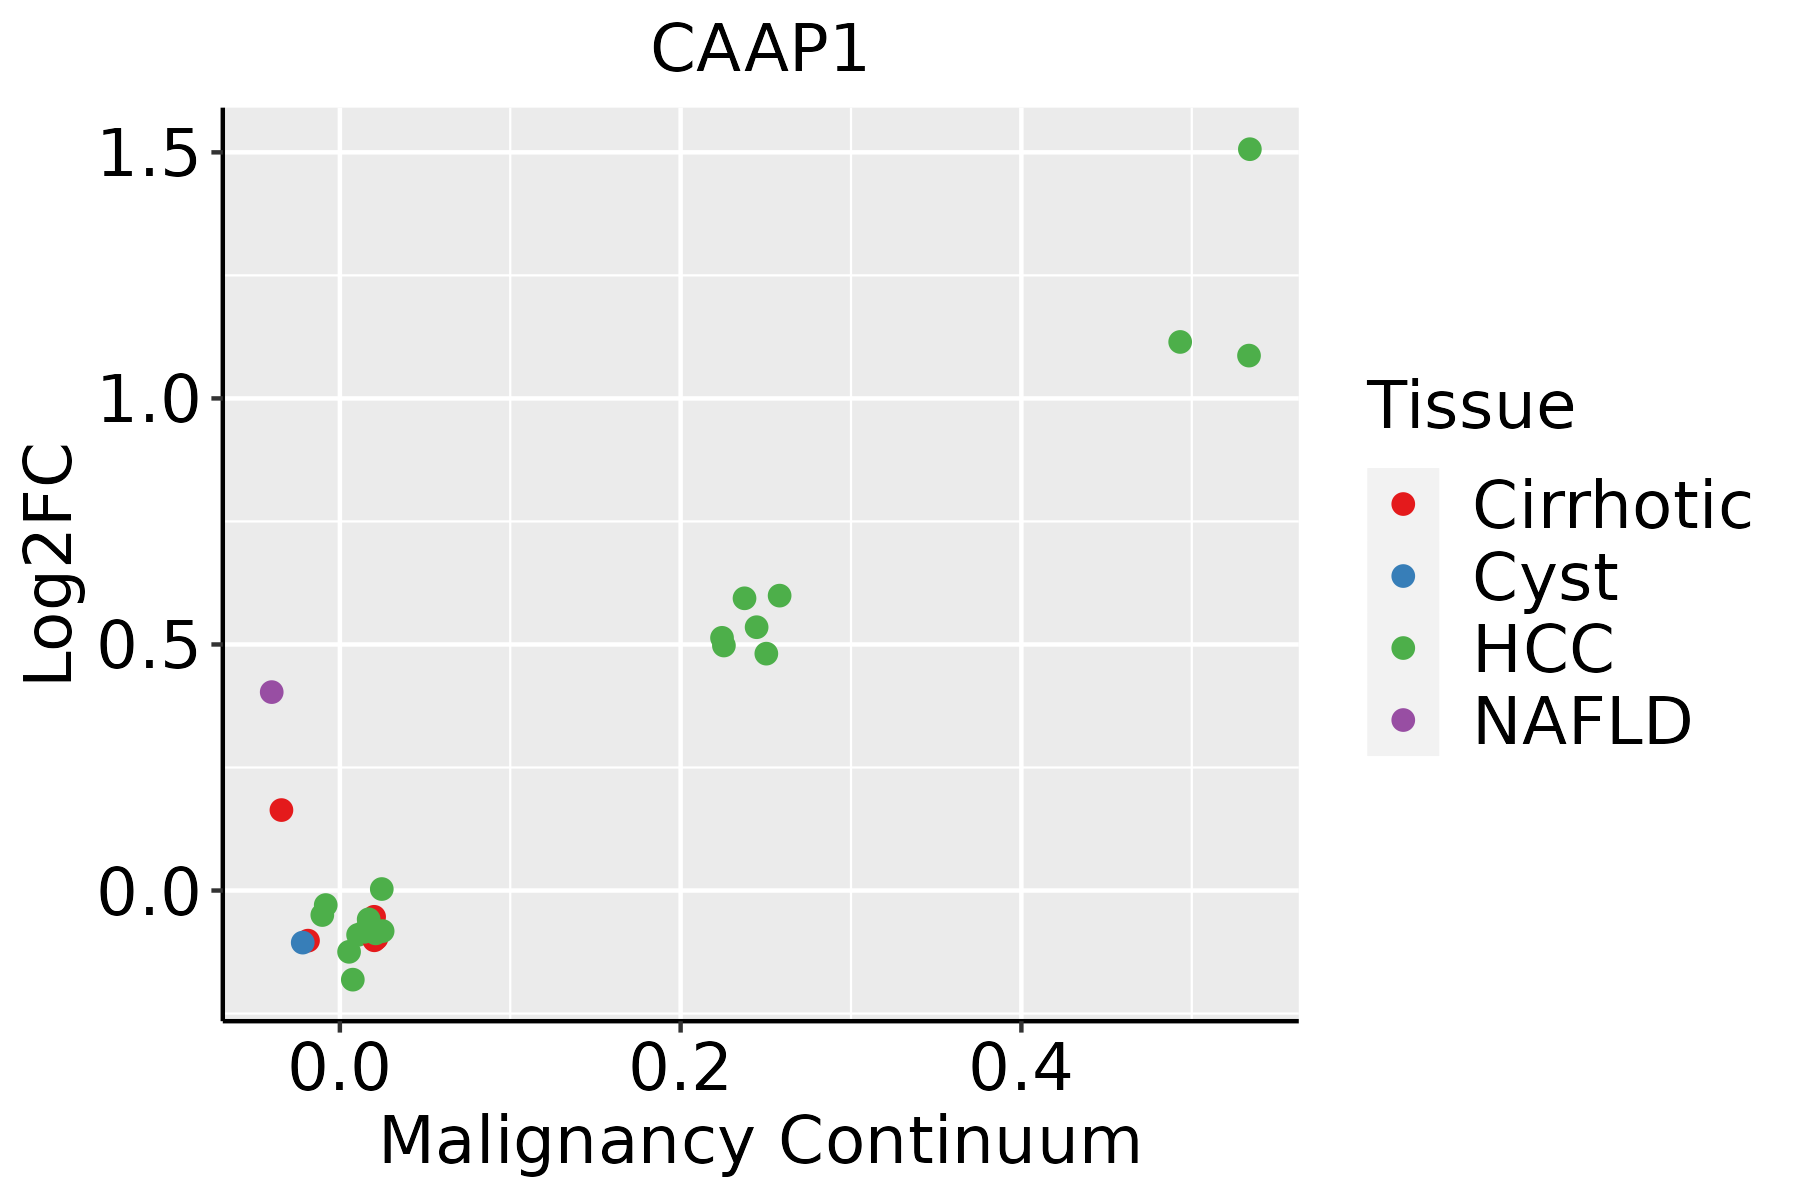 | HCC: Hepatocellular carcinoma |
| NAFLD: Non-alcoholic fatty liver disease | ||
| Oral Cavity | 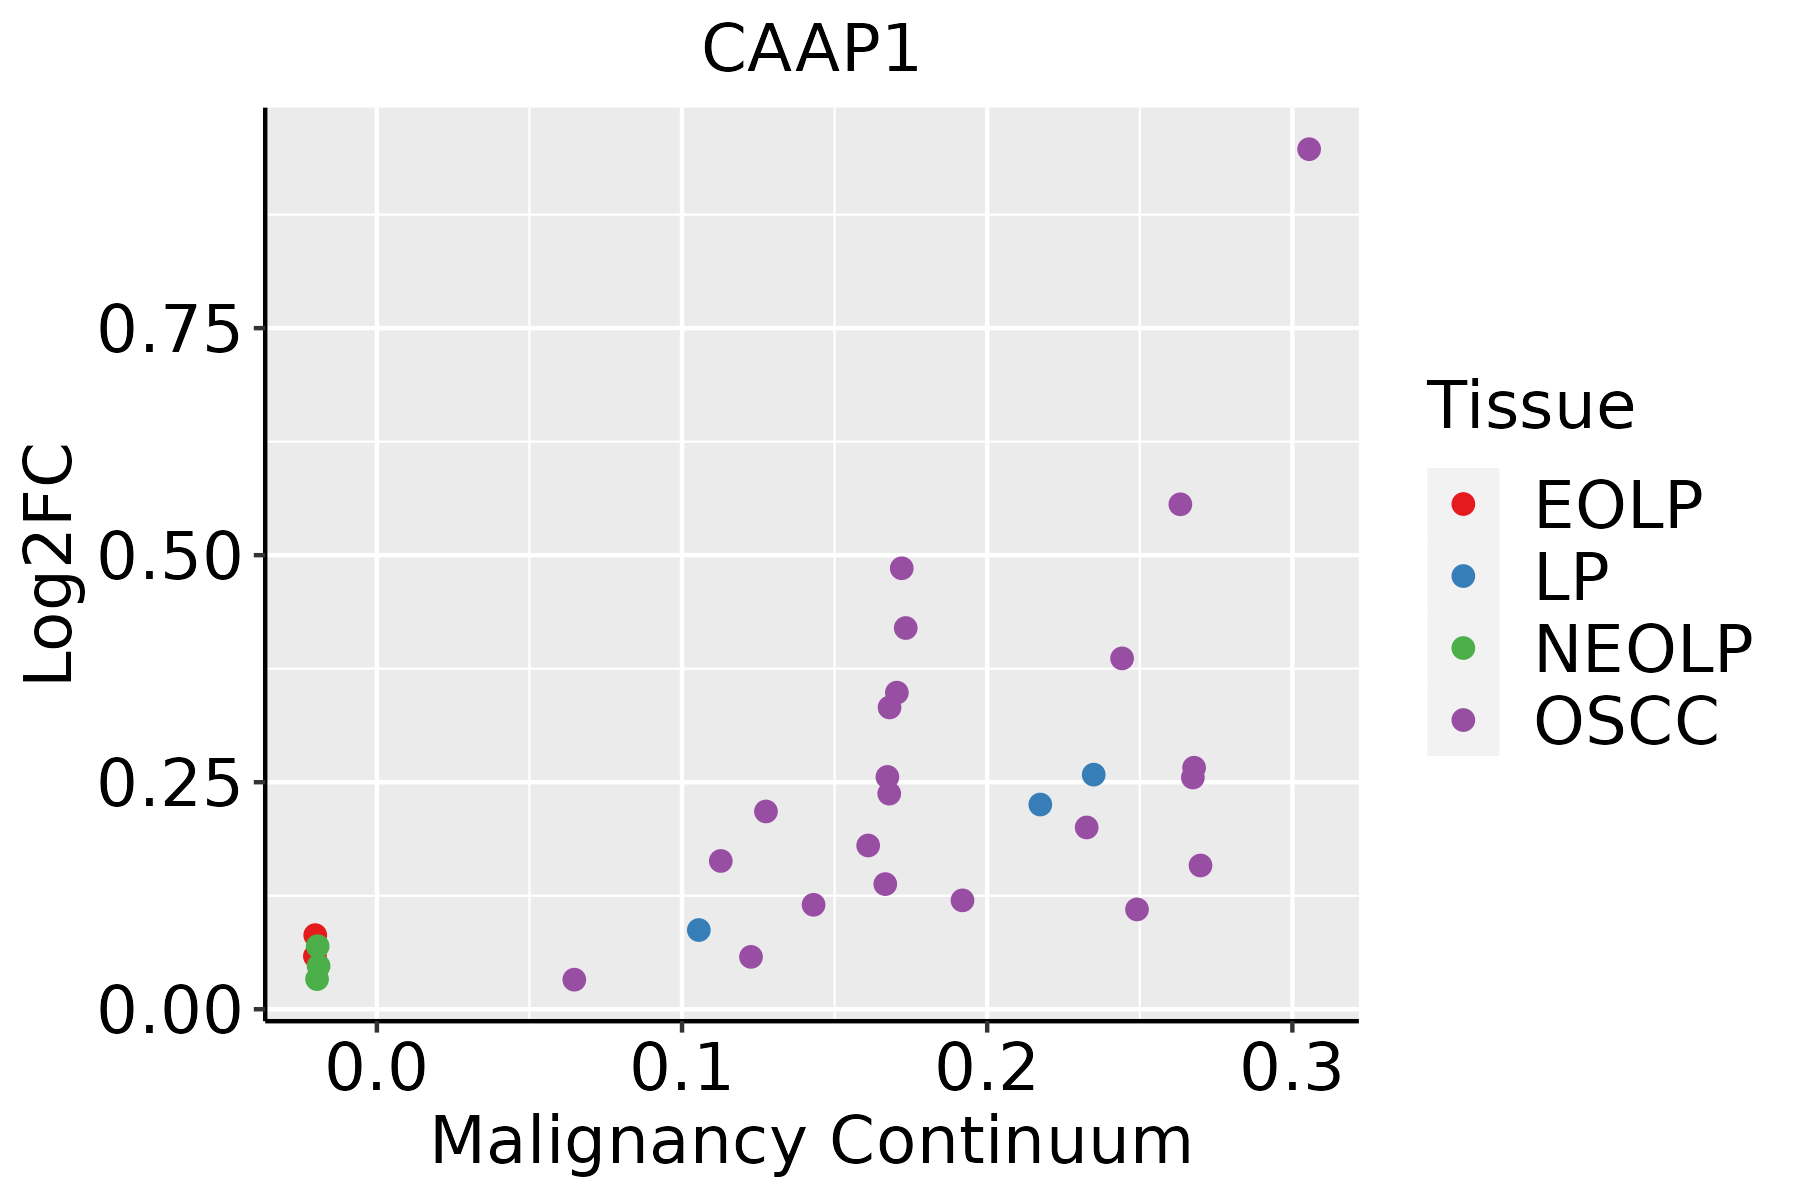 | EOLP: Erosive Oral lichen planus |
| LP: leukoplakia | ||
| NEOLP: Non-erosive oral lichen planus | ||
| OSCC: Oral squamous cell carcinoma | ||
| Thyroid |  | ATC: Anaplastic thyroid cancer |
| HT: Hashimoto's thyroiditis | ||
| PTC: Papillary thyroid cancer |
| ∗log2FC in expression of this searched gene in stem-like cells from each diseased tissue sample relative to stem-like cells in normal samples in each tissue plotted against the malignancy continuum. Samples are colored based on if they are from different disease stage. |
Top |
Malignant transformation related pathway analysis |
| Find out the enriched GO biological processes and KEGG pathways involved in transition from healthy to precancer to cancer |
| Tissue | Disease Stage | Enriched GO biological Processes |
| Colorectum | AD |  |
| Colorectum | SER |  |
| Colorectum | MSS |  |
| Colorectum | MSI-H |  |
| Colorectum | FAP |  |
| ∗Top 15 enriched GO BP terms are showed in the bar plot of each disease state in each tissue. Each row represents a significant GO biological process which is colored according to the -log10(p.adjust). |
| Page: 1 2 3 4 5 6 7 8 9 |
| GO ID | Tissue | Disease Stage | Description | Gene Ratio | Bg Ratio | pvalue | p.adjust | Count |
| GO:2001233 | Colorectum | AD | regulation of apoptotic signaling pathway | 119/3918 | 356/18723 | 2.14e-08 | 1.21e-06 | 119 |
| GO:0043281 | Colorectum | AD | regulation of cysteine-type endopeptidase activity involved in apoptotic process | 72/3918 | 209/18723 | 3.70e-06 | 1.03e-04 | 72 |
| GO:2000116 | Colorectum | AD | regulation of cysteine-type endopeptidase activity | 79/3918 | 235/18723 | 3.74e-06 | 1.03e-04 | 79 |
| GO:0052547 | Colorectum | AD | regulation of peptidase activity | 137/3918 | 461/18723 | 4.12e-06 | 1.12e-04 | 137 |
| GO:2001234 | Colorectum | AD | negative regulation of apoptotic signaling pathway | 74/3918 | 224/18723 | 1.49e-05 | 3.18e-04 | 74 |
| GO:0045861 | Colorectum | AD | negative regulation of proteolysis | 106/3918 | 351/18723 | 2.33e-05 | 4.57e-04 | 106 |
| GO:0052548 | Colorectum | AD | regulation of endopeptidase activity | 124/3918 | 432/18723 | 6.58e-05 | 1.07e-03 | 124 |
| GO:0043154 | Colorectum | AD | negative regulation of cysteine-type endopeptidase activity involved in apoptotic process | 30/3918 | 78/18723 | 2.95e-04 | 3.59e-03 | 30 |
| GO:2000117 | Colorectum | AD | negative regulation of cysteine-type endopeptidase activity | 31/3918 | 86/18723 | 8.67e-04 | 8.45e-03 | 31 |
| GO:2001267 | Colorectum | AD | regulation of cysteine-type endopeptidase activity involved in apoptotic signaling pathway | 9/3918 | 16/18723 | 2.06e-03 | 1.64e-02 | 9 |
| GO:20012332 | Colorectum | MSS | regulation of apoptotic signaling pathway | 116/3467 | 356/18723 | 1.02e-10 | 1.06e-08 | 116 |
| GO:00525472 | Colorectum | MSS | regulation of peptidase activity | 130/3467 | 461/18723 | 1.81e-07 | 8.13e-06 | 130 |
| GO:20012342 | Colorectum | MSS | negative regulation of apoptotic signaling pathway | 72/3467 | 224/18723 | 6.17e-07 | 2.29e-05 | 72 |
| GO:20001162 | Colorectum | MSS | regulation of cysteine-type endopeptidase activity | 72/3467 | 235/18723 | 4.39e-06 | 1.24e-04 | 72 |
| GO:00525482 | Colorectum | MSS | regulation of endopeptidase activity | 117/3467 | 432/18723 | 6.25e-06 | 1.65e-04 | 117 |
| GO:00432812 | Colorectum | MSS | regulation of cysteine-type endopeptidase activity involved in apoptotic process | 65/3467 | 209/18723 | 7.29e-06 | 1.86e-04 | 65 |
| GO:00458612 | Colorectum | MSS | negative regulation of proteolysis | 97/3467 | 351/18723 | 1.57e-05 | 3.54e-04 | 97 |
| GO:00431542 | Colorectum | MSS | negative regulation of cysteine-type endopeptidase activity involved in apoptotic process | 27/3467 | 78/18723 | 5.31e-04 | 5.99e-03 | 27 |
| GO:20001172 | Colorectum | MSS | negative regulation of cysteine-type endopeptidase activity | 29/3467 | 86/18723 | 5.53e-04 | 6.14e-03 | 29 |
| GO:00513461 | Colorectum | MSS | negative regulation of hydrolase activity | 92/3467 | 379/18723 | 2.85e-03 | 2.22e-02 | 92 |
| Page: 1 2 3 4 5 6 |
| Pathway ID | Tissue | Disease Stage | Description | Gene Ratio | Bg Ratio | pvalue | p.adjust | qvalue | Count |
| Page: 1 |
Top |
Cell-cell communication analysis |
| Identification of potential cell-cell interactions between two cell types and their ligand-receptor pairs for different disease states |
| Ligand | Receptor | LRpair | Pathway | Tissue | Disease Stage |
| Page: 1 |
Top |
Single-cell gene regulatory network inference analysis |
| Find out the significant the regulons (TFs) and the target genes of each regulon across cell types for different disease states |
| TF | Cell Type | Tissue | Disease Stage | Target Gene | RSS | Regulon Activity |
| ∗The dot plots of a searched regulon are shown for all cell subpopulations in each disease state of each tissue based on the regulon specific score inferred using pySCENIC and by calculating the average expression. |
| Page: 1 |
Top |
Somatic mutation of malignant transformation related genes |
| Annotation of somatic variants for genes involved in malignant transformation |
| Hugo Symbol | Variant Class | Variant Classification | dbSNP RS | HGVSc | HGVSp | HGVSp Short | SWISSPROT | BIOTYPE | SIFT | PolyPhen | Tumor Sample Barcode | Tissue | Histology | Sex | Age | Stage | Therapy Types | Drugs | Outcome |
| CAAP1 | deletion | Frame_Shift_Del | novel | c.1023delT | p.Glu342ArgfsTer2 | p.E342Rfs*2 | Q9H8G2 | protein_coding | TCGA-EW-A2FV-01 | Breast | breast invasive carcinoma | Female | <65 | III/IV | Chemotherapy | docetaxel | SD | ||
| CAAP1 | SNV | Missense_Mutation | novel | c.449N>A | p.Cys150Tyr | p.C150Y | Q9H8G2 | protein_coding | deleterious(0) | probably_damaging(0.998) | TCGA-AA-3947-01 | Colorectum | colon adenocarcinoma | Female | <65 | I/II | Unknown | Unknown | SD |
| CAAP1 | SNV | Missense_Mutation | c.571A>T | p.Ile191Phe | p.I191F | Q9H8G2 | protein_coding | deleterious(0.05) | benign(0.165) | TCGA-AA-A022-01 | Colorectum | colon adenocarcinoma | Female | >=65 | I/II | Unknown | Unknown | SD | |
| CAAP1 | SNV | Missense_Mutation | c.571N>T | p.Ile191Phe | p.I191F | Q9H8G2 | protein_coding | deleterious(0.05) | benign(0.165) | TCGA-F4-6703-01 | Colorectum | colon adenocarcinoma | Male | <65 | I/II | Unknown | Unknown | SD | |
| CAAP1 | deletion | Frame_Shift_Del | rs755502348 | c.571delN | p.Ile191PhefsTer2 | p.I191Ffs*2 | Q9H8G2 | protein_coding | TCGA-AA-3815-01 | Colorectum | colon adenocarcinoma | Female | >=65 | I/II | Unknown | Unknown | SD | ||
| CAAP1 | SNV | Missense_Mutation | novel | c.965N>A | p.Ala322Asp | p.A322D | Q9H8G2 | protein_coding | tolerated(0.06) | benign(0.017) | TCGA-A5-A0G2-01 | Endometrium | uterine corpus endometrioid carcinoma | Female | <65 | III/IV | Unknown | Unknown | SD |
| CAAP1 | SNV | Missense_Mutation | c.529A>C | p.Lys177Gln | p.K177Q | Q9H8G2 | protein_coding | tolerated(0.12) | benign(0.014) | TCGA-A5-A0GP-01 | Endometrium | uterine corpus endometrioid carcinoma | Female | <65 | I/II | Unknown | Unknown | SD | |
| CAAP1 | SNV | Missense_Mutation | c.593N>G | p.Asp198Gly | p.D198G | Q9H8G2 | protein_coding | deleterious(0.01) | benign(0.143) | TCGA-AP-A051-01 | Endometrium | uterine corpus endometrioid carcinoma | Female | >=65 | I/II | Unknown | Unknown | SD | |
| CAAP1 | SNV | Missense_Mutation | novel | c.392N>C | p.Val131Ala | p.V131A | Q9H8G2 | protein_coding | deleterious(0.03) | possibly_damaging(0.875) | TCGA-AP-A0LM-01 | Endometrium | uterine corpus endometrioid carcinoma | Female | <65 | III/IV | Chemotherapy | cisplatin | SD |
| CAAP1 | SNV | Missense_Mutation | c.571N>T | p.Ile191Phe | p.I191F | Q9H8G2 | protein_coding | deleterious(0.05) | benign(0.165) | TCGA-AX-A0IZ-01 | Endometrium | uterine corpus endometrioid carcinoma | Female | <65 | I/II | Unknown | Unknown | SD |
| Page: 1 2 3 |
Top |
Related drugs of malignant transformation related genes |
| Identification of chemicals and drugs interact with genes involved in malignant transfromation |
| (DGIdb 4.0) |
| Entrez ID | Symbol | Category | Interaction Types | Drug Claim Name | Drug Name | PMIDs |
| Page: 1 |

Copyright 2023-Present -The University of Texas Health Science Center at Houston |