
|
|||||
|
 | |
| |
| |
| |
| |
| |
|
Gene: CA9 |
Gene summary for CA9 |
| Gene information | Species | Human | Gene symbol | CA9 | Gene ID | 768 |
| Gene name | carbonic anhydrase 9 | |
| Gene Alias | CAIX | |
| Cytomap | 9p13.3 | |
| Gene Type | protein-coding | GO ID | GO:0001666 | UniProtAcc | A0A0S2Z3D0 |
Top |
Malignant transformation analysis |
| Identification of the aberrant gene expression in precancerous and cancerous lesions by comparing the gene expression of stem-like cells in diseased tissues with normal stem cells |
| Entrez ID | Symbol | Replicates | Species | Organ | Tissue | Adj P-value | Log2FC | Malignancy |
| 768 | CA9 | HTA11_3410_2000001011 | Human | Colorectum | AD | 6.55e-04 | 1.25e-01 | 0.0155 |
| 768 | CA9 | HTA11_1938_2000001011 | Human | Colorectum | AD | 4.00e-12 | 5.32e-01 | -0.0811 |
| 768 | CA9 | HTA11_1391_2000001011 | Human | Colorectum | AD | 2.21e-08 | 3.11e-01 | -0.059 |
| 768 | CA9 | HTA11_866_3004761011 | Human | Colorectum | AD | 2.04e-08 | 2.08e-01 | 0.096 |
| 768 | CA9 | HTA11_4255_2000001011 | Human | Colorectum | SER | 3.40e-02 | 1.89e-01 | 0.0446 |
| 768 | CA9 | HTA11_8622_2000001021 | Human | Colorectum | SER | 3.15e-09 | 3.80e-01 | 0.0528 |
| 768 | CA9 | HTA11_10711_2000001011 | Human | Colorectum | AD | 1.37e-08 | 4.41e-01 | 0.0338 |
| 768 | CA9 | HTA11_6818_2000001021 | Human | Colorectum | AD | 6.03e-04 | 2.62e-01 | 0.0588 |
| 768 | CA9 | HTA11_99999970781_79442 | Human | Colorectum | MSS | 1.92e-35 | 6.84e-01 | 0.294 |
| 768 | CA9 | HTA11_99999965062_69753 | Human | Colorectum | MSI-H | 1.91e-08 | 1.43e+00 | 0.3487 |
| 768 | CA9 | LZE4T | Human | Esophagus | ESCC | 3.18e-05 | 3.17e-01 | 0.0811 |
| 768 | CA9 | LZE20T | Human | Esophagus | ESCC | 1.26e-02 | 1.53e-01 | 0.0662 |
| 768 | CA9 | LZE6T | Human | Esophagus | ESCC | 5.26e-07 | 5.04e-01 | 0.0845 |
| 768 | CA9 | P4T-E | Human | Esophagus | ESCC | 1.26e-16 | 6.82e-01 | 0.1323 |
| 768 | CA9 | P8T-E | Human | Esophagus | ESCC | 3.75e-03 | 1.26e-01 | 0.0889 |
| 768 | CA9 | P10T-E | Human | Esophagus | ESCC | 1.92e-37 | 1.13e+00 | 0.116 |
| 768 | CA9 | P15T-E | Human | Esophagus | ESCC | 5.37e-05 | 2.95e-01 | 0.1149 |
| 768 | CA9 | P17T-E | Human | Esophagus | ESCC | 8.50e-05 | 2.54e-01 | 0.1278 |
| 768 | CA9 | P26T-E | Human | Esophagus | ESCC | 1.39e-71 | 2.08e+00 | 0.1276 |
| 768 | CA9 | P32T-E | Human | Esophagus | ESCC | 4.41e-07 | 3.75e-01 | 0.1666 |
| Page: 1 2 3 4 5 |
| Tissue | Expression Dynamics | Abbreviation |
| Colorectum (GSE201348) |  | FAP: Familial adenomatous polyposis |
| CRC: Colorectal cancer | ||
| Colorectum (HTA11) |  | AD: Adenomas |
| SER: Sessile serrated lesions | ||
| MSI-H: Microsatellite-high colorectal cancer | ||
| MSS: Microsatellite stable colorectal cancer | ||
| Esophagus | 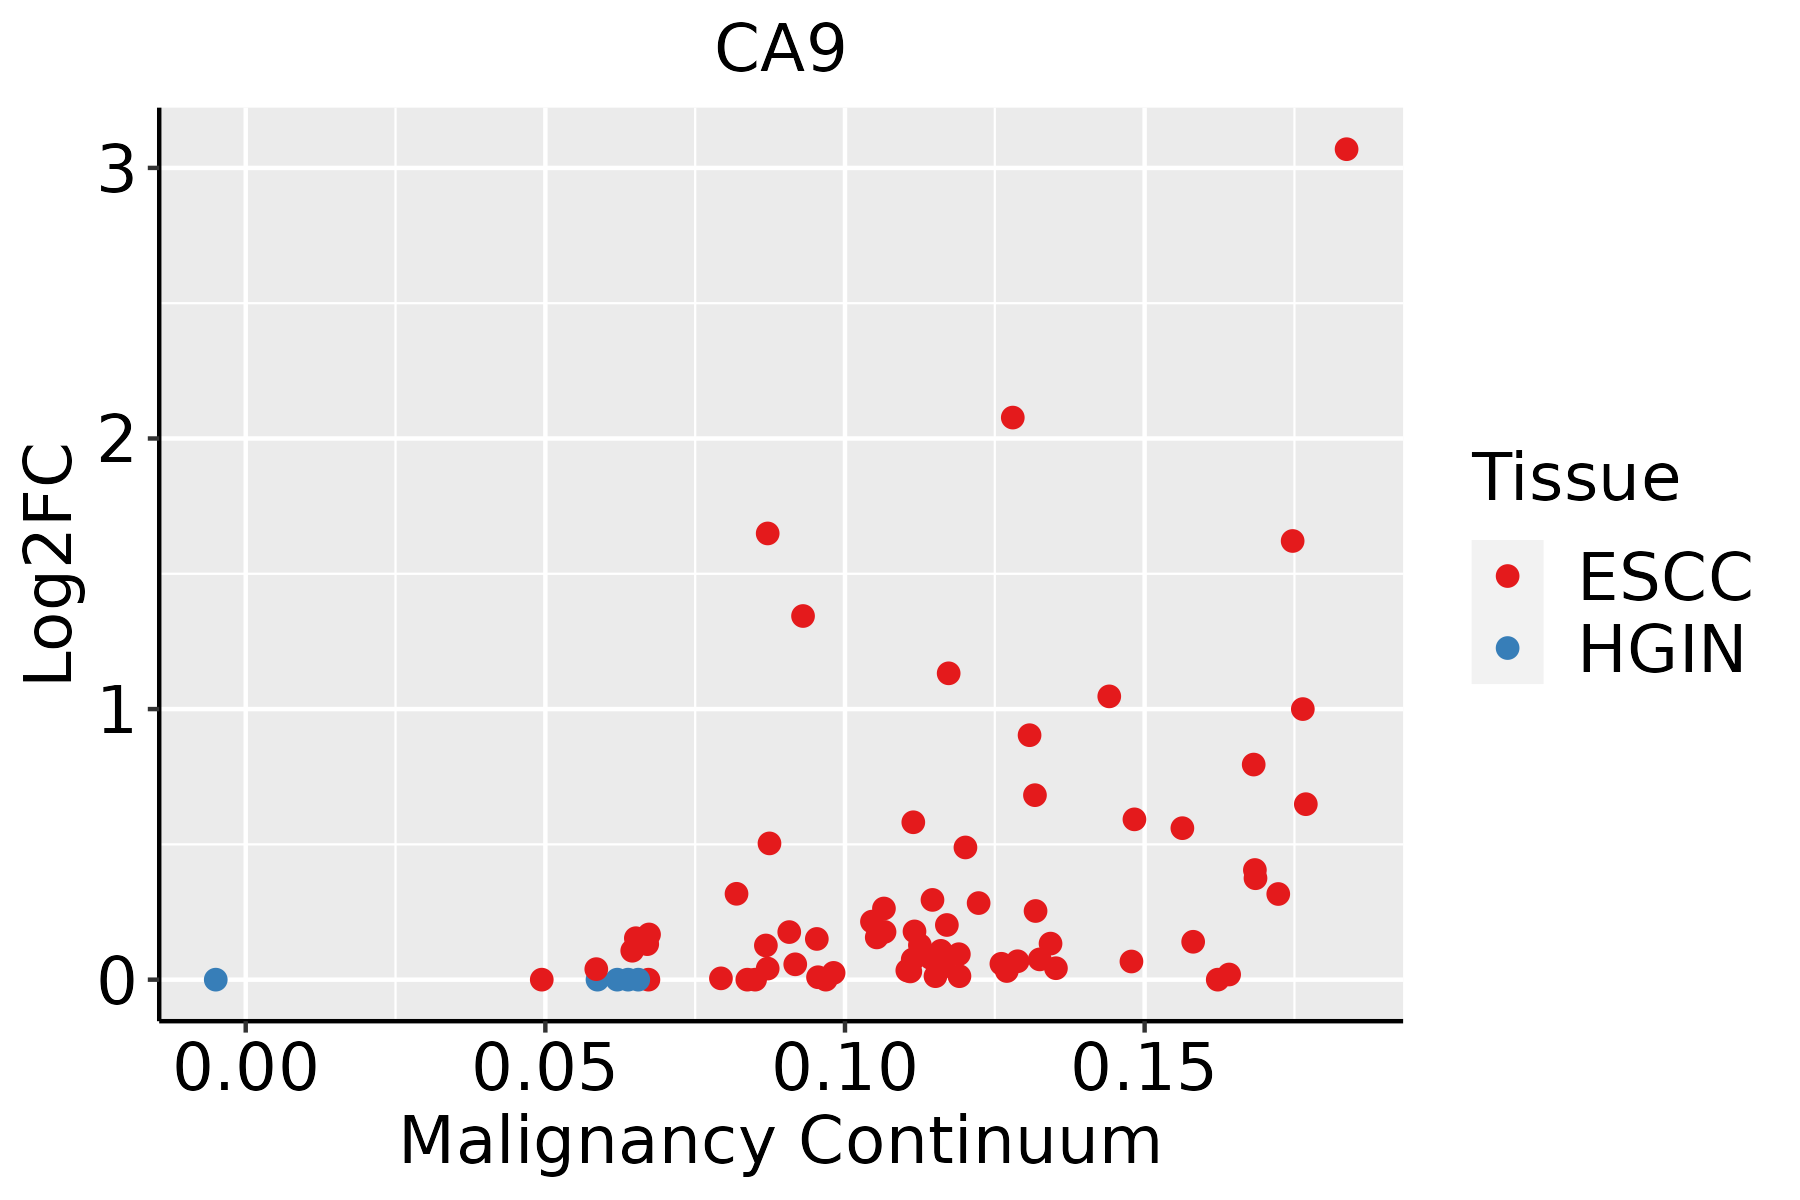 | ESCC: Esophageal squamous cell carcinoma |
| HGIN: High-grade intraepithelial neoplasias | ||
| LGIN: Low-grade intraepithelial neoplasias | ||
| GC | 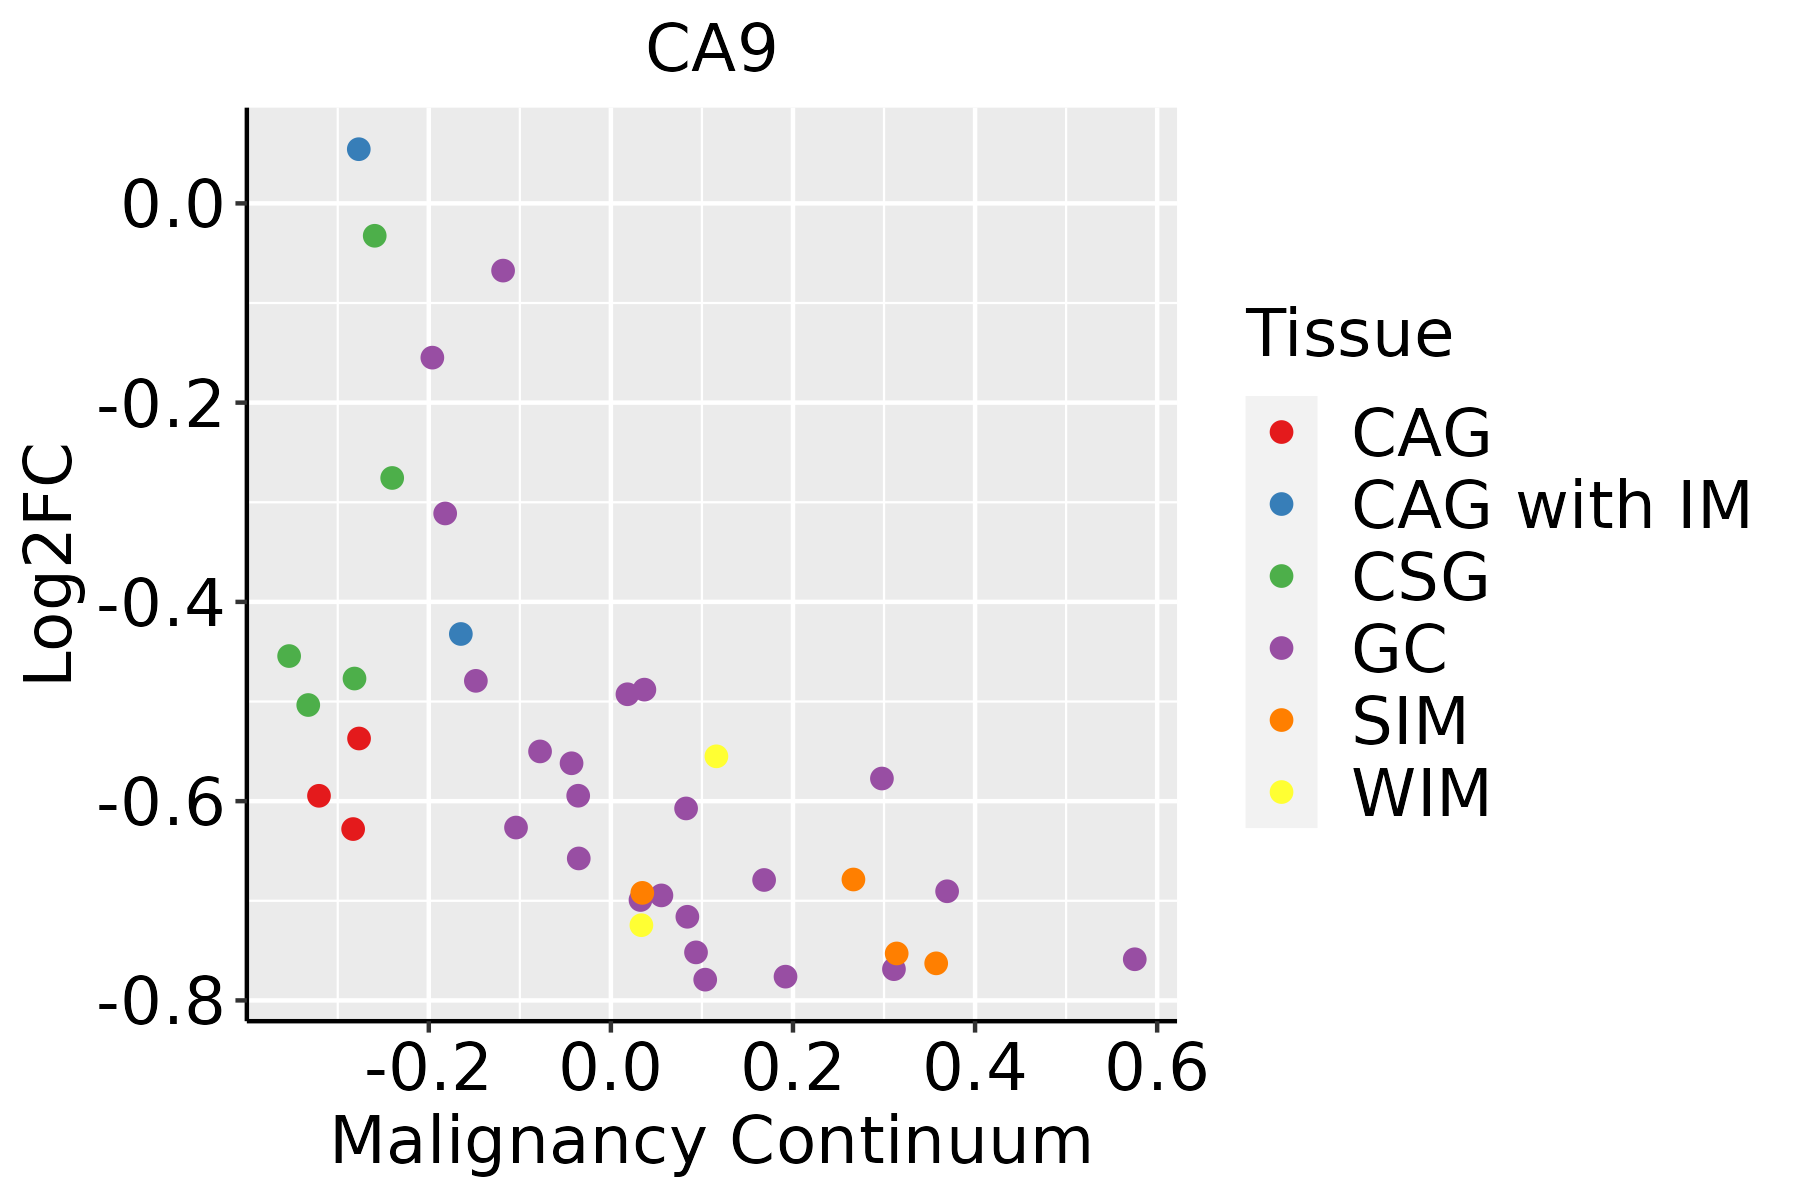 | CAG: Chronic atrophic gastritis |
| CAG with IM: Chronic atrophic gastritis with intestinal metaplasia | ||
| CSG: Chronic superficial gastritis | ||
| GC: Gastric cancer | ||
| SIM: Severe intestinal metaplasia | ||
| WIM: Wild intestinal metaplasia | ||
| Oral Cavity | 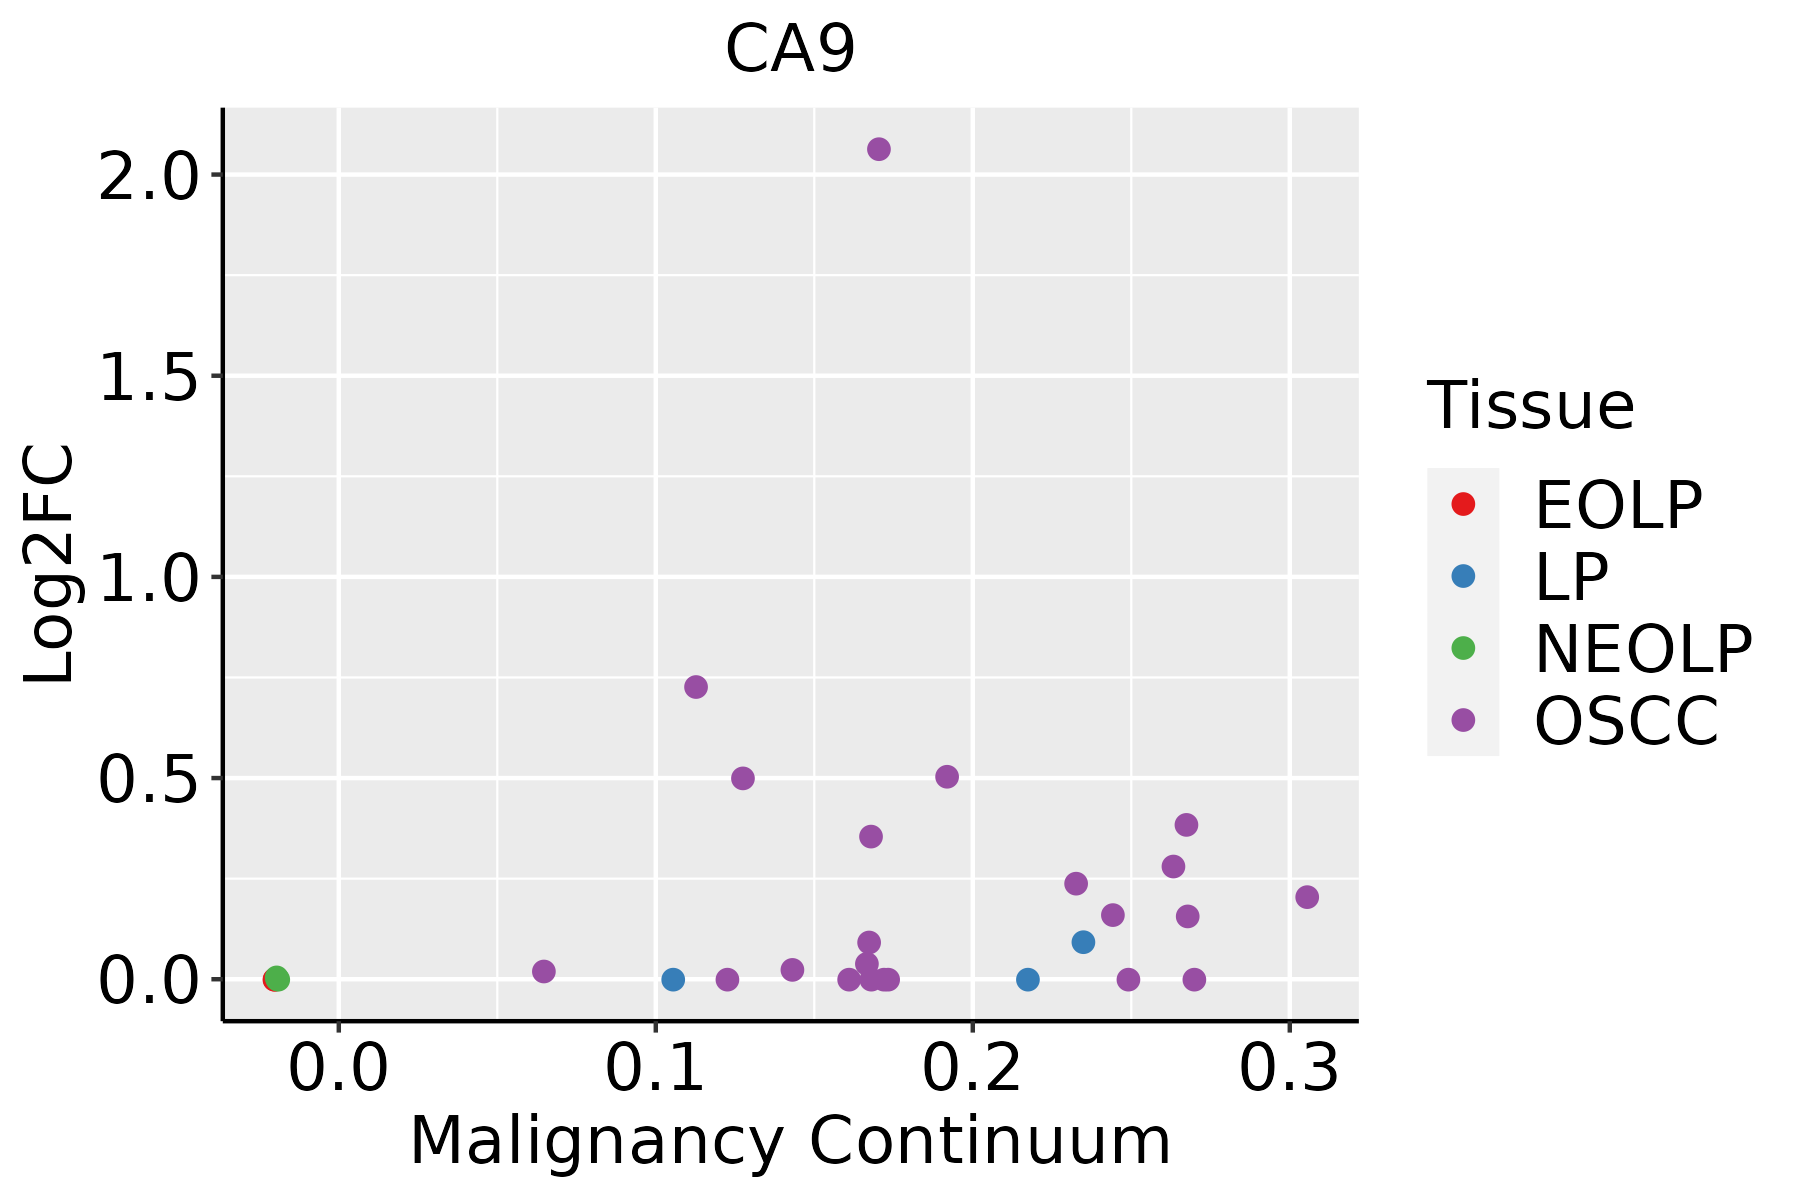 | EOLP: Erosive Oral lichen planus |
| LP: leukoplakia | ||
| NEOLP: Non-erosive oral lichen planus | ||
| OSCC: Oral squamous cell carcinoma | ||
| Skin | 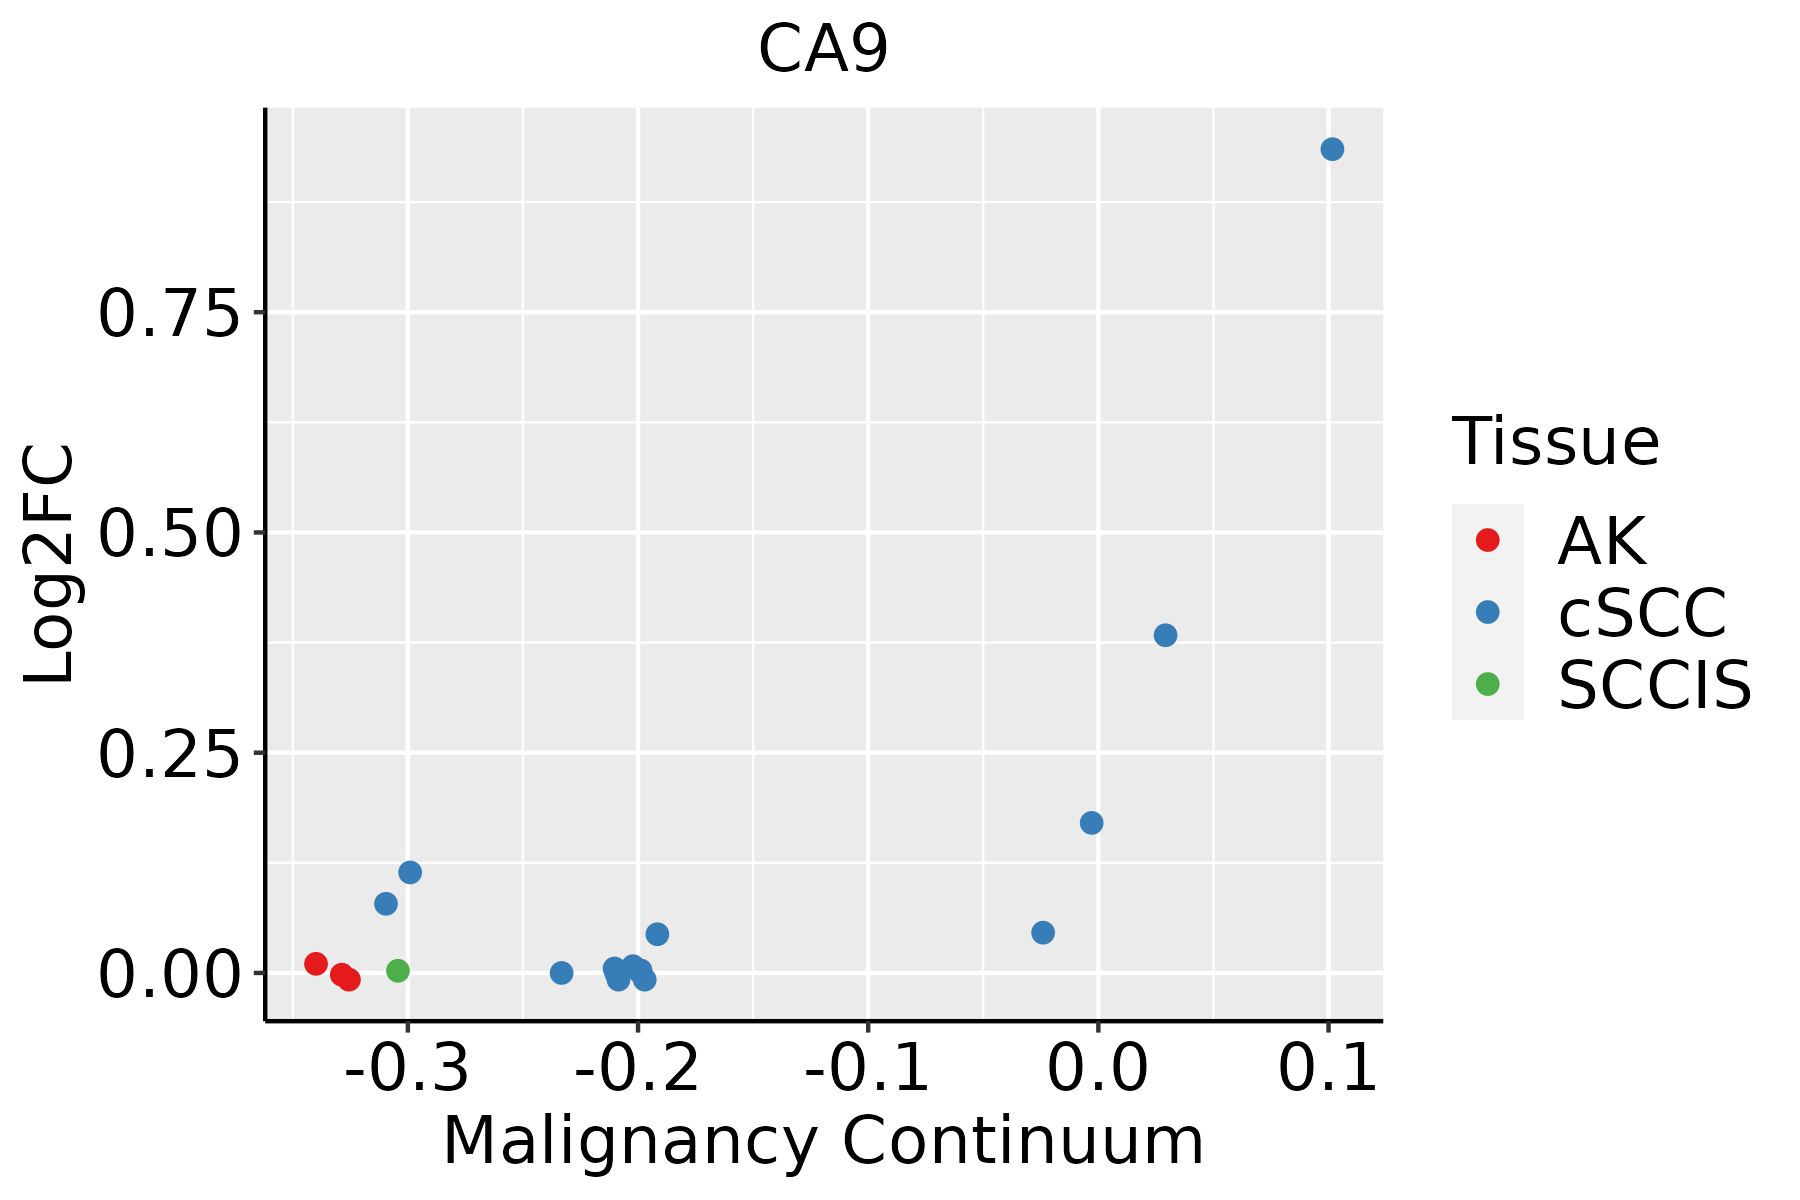 | AK: Actinic keratosis |
| cSCC: Cutaneous squamous cell carcinoma | ||
| SCCIS:squamous cell carcinoma in situ | ||
| Thyroid | 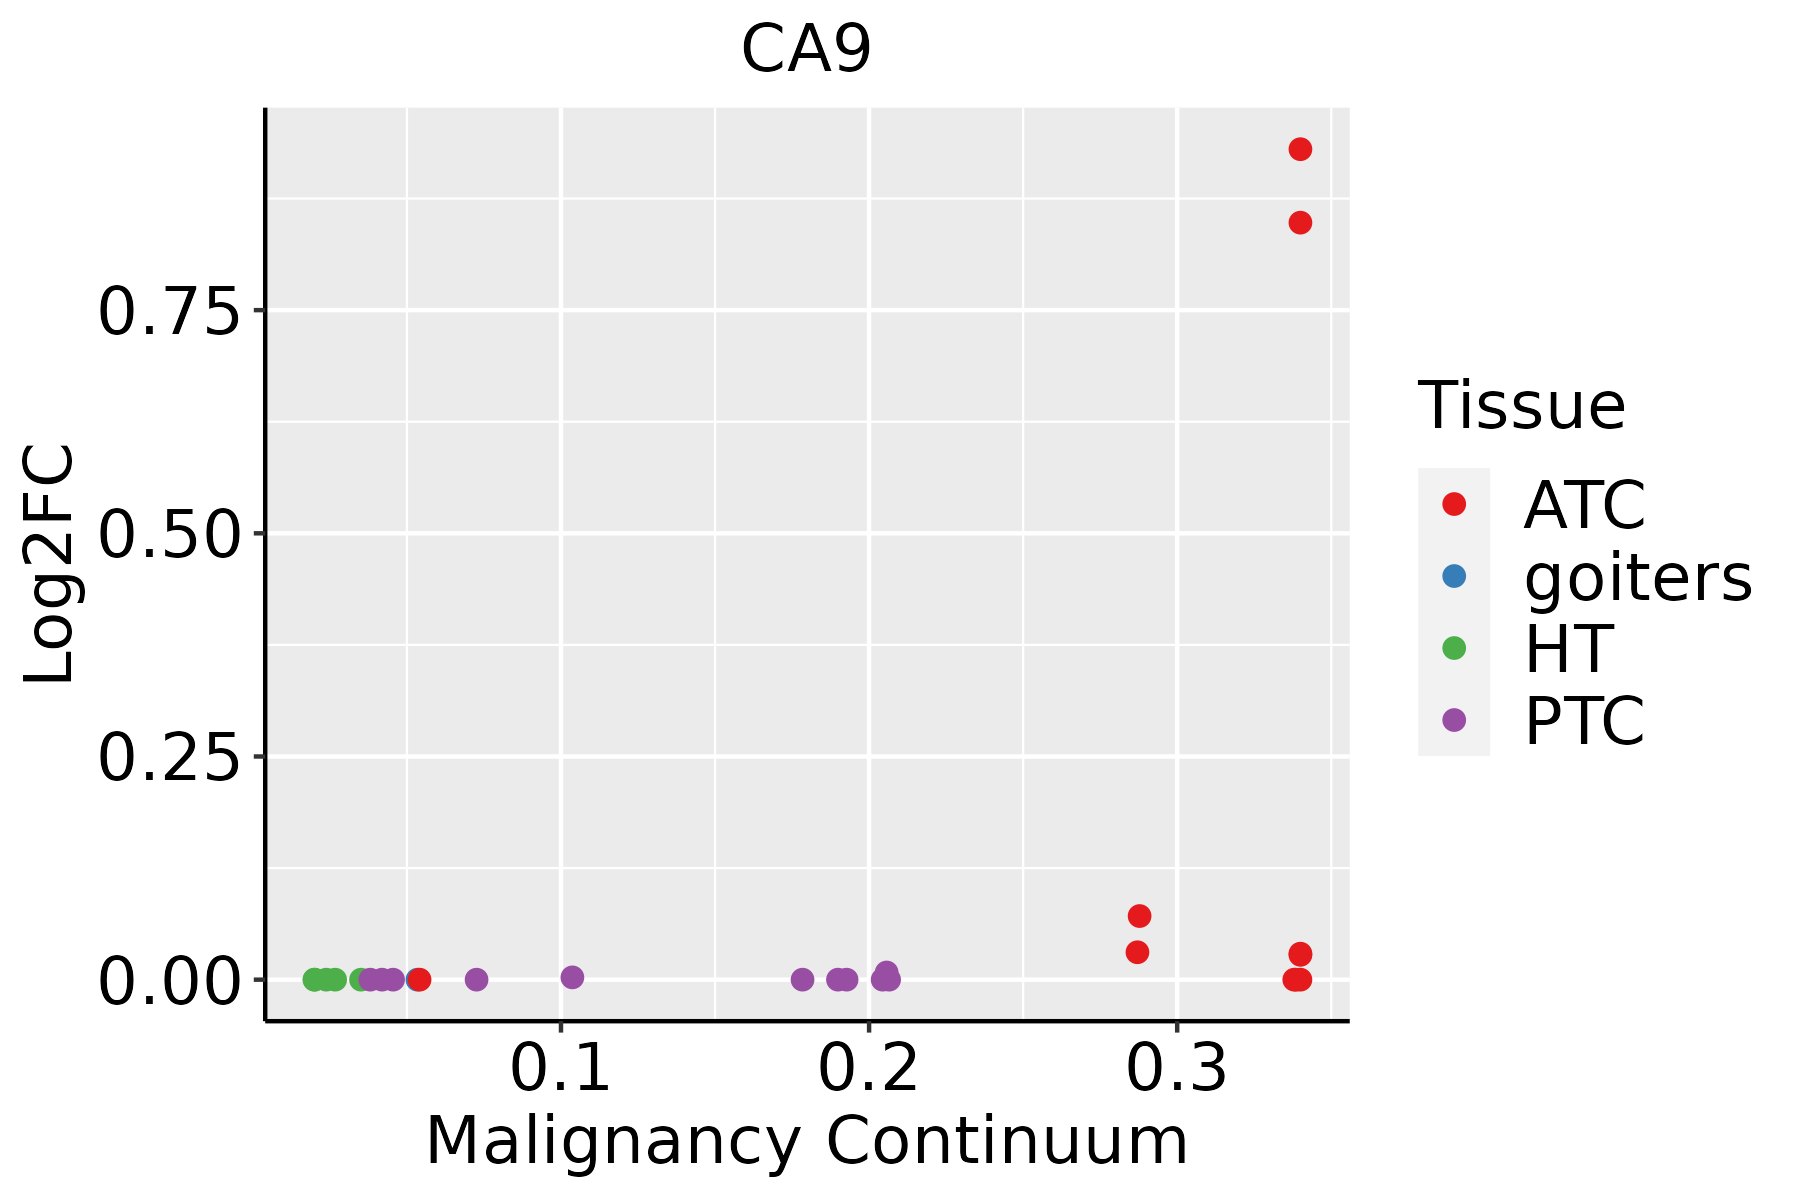 | ATC: Anaplastic thyroid cancer |
| HT: Hashimoto's thyroiditis | ||
| PTC: Papillary thyroid cancer |
| ∗log2FC in expression of this searched gene in stem-like cells from each diseased tissue sample relative to stem-like cells in normal samples in each tissue plotted against the malignancy continuum. Samples are colored based on if they are from different disease stage. |
Top |
Malignant transformation related pathway analysis |
| Find out the enriched GO biological processes and KEGG pathways involved in transition from healthy to precancer to cancer |
| Tissue | Disease Stage | Enriched GO biological Processes |
| Colorectum | AD |  |
| Colorectum | SER |  |
| Colorectum | MSS |  |
| Colorectum | MSI-H |  |
| Colorectum | FAP |  |
| ∗Top 15 enriched GO BP terms are showed in the bar plot of each disease state in each tissue. Each row represents a significant GO biological process which is colored according to the -log10(p.adjust). |
| Page: 1 2 3 4 5 6 7 8 9 |
| GO ID | Tissue | Disease Stage | Description | Gene Ratio | Bg Ratio | pvalue | p.adjust | Count |
| GO:0009410 | Colorectum | AD | response to xenobiotic stimulus | 128/3918 | 462/18723 | 2.69e-04 | 3.31e-03 | 128 |
| GO:0070482 | Colorectum | AD | response to oxygen levels | 99/3918 | 347/18723 | 4.29e-04 | 4.82e-03 | 99 |
| GO:0006730 | Colorectum | AD | one-carbon metabolic process | 18/3918 | 40/18723 | 5.36e-04 | 5.74e-03 | 18 |
| GO:1901654 | Colorectum | AD | response to ketone | 59/3918 | 194/18723 | 1.14e-03 | 1.04e-02 | 59 |
| GO:0001666 | Colorectum | AD | response to hypoxia | 86/3918 | 307/18723 | 1.77e-03 | 1.46e-02 | 86 |
| GO:0036293 | Colorectum | AD | response to decreased oxygen levels | 88/3918 | 322/18723 | 3.42e-03 | 2.49e-02 | 88 |
| GO:00704821 | Colorectum | SER | response to oxygen levels | 79/2897 | 347/18723 | 1.99e-04 | 3.64e-03 | 79 |
| GO:00067301 | Colorectum | SER | one-carbon metabolic process | 15/2897 | 40/18723 | 5.71e-04 | 7.86e-03 | 15 |
| GO:00016661 | Colorectum | SER | response to hypoxia | 69/2897 | 307/18723 | 7.07e-04 | 9.39e-03 | 69 |
| GO:00362931 | Colorectum | SER | response to decreased oxygen levels | 71/2897 | 322/18723 | 1.04e-03 | 1.22e-02 | 71 |
| GO:19016541 | Colorectum | SER | response to ketone | 44/2897 | 194/18723 | 5.01e-03 | 3.88e-02 | 44 |
| GO:19016542 | Colorectum | MSS | response to ketone | 58/3467 | 194/18723 | 7.70e-05 | 1.28e-03 | 58 |
| GO:00094101 | Colorectum | MSS | response to xenobiotic stimulus | 110/3467 | 462/18723 | 2.36e-03 | 1.92e-02 | 110 |
| GO:00704822 | Colorectum | MSS | response to oxygen levels | 85/3467 | 347/18723 | 3.08e-03 | 2.34e-02 | 85 |
| GO:00067302 | Colorectum | MSS | one-carbon metabolic process | 15/3467 | 40/18723 | 3.72e-03 | 2.73e-02 | 15 |
| GO:00016662 | Colorectum | MSS | response to hypoxia | 75/3467 | 307/18723 | 5.56e-03 | 3.78e-02 | 75 |
| GO:19016543 | Colorectum | MSI-H | response to ketone | 26/1319 | 194/18723 | 1.17e-03 | 1.92e-02 | 26 |
| GO:0070482111 | Esophagus | ESCC | response to oxygen levels | 218/8552 | 347/18723 | 6.91e-11 | 2.17e-09 | 218 |
| GO:0036293111 | Esophagus | ESCC | response to decreased oxygen levels | 201/8552 | 322/18723 | 8.37e-10 | 2.04e-08 | 201 |
| GO:0001666111 | Esophagus | ESCC | response to hypoxia | 192/8552 | 307/18723 | 1.59e-09 | 3.69e-08 | 192 |
| Page: 1 2 3 4 5 |
| Pathway ID | Tissue | Disease Stage | Description | Gene Ratio | Bg Ratio | pvalue | p.adjust | qvalue | Count |
| hsa00910 | Stomach | SIM | Nitrogen metabolism | 5/465 | 17/8465 | 1.75e-03 | 1.33e-02 | 1.07e-02 | 5 |
| hsa009101 | Stomach | SIM | Nitrogen metabolism | 5/465 | 17/8465 | 1.75e-03 | 1.33e-02 | 1.07e-02 | 5 |
| Page: 1 |
Top |
Cell-cell communication analysis |
| Identification of potential cell-cell interactions between two cell types and their ligand-receptor pairs for different disease states |
| Ligand | Receptor | LRpair | Pathway | Tissue | Disease Stage |
| Page: 1 |
Top |
Single-cell gene regulatory network inference analysis |
| Find out the significant the regulons (TFs) and the target genes of each regulon across cell types for different disease states |
| TF | Cell Type | Tissue | Disease Stage | Target Gene | RSS | Regulon Activity |
| ∗The dot plots of a searched regulon are shown for all cell subpopulations in each disease state of each tissue based on the regulon specific score inferred using pySCENIC and by calculating the average expression. |
| Page: 1 |
Top |
Somatic mutation of malignant transformation related genes |
| Annotation of somatic variants for genes involved in malignant transformation |
| Hugo Symbol | Variant Class | Variant Classification | dbSNP RS | HGVSc | HGVSp | HGVSp Short | SWISSPROT | BIOTYPE | SIFT | PolyPhen | Tumor Sample Barcode | Tissue | Histology | Sex | Age | Stage | Therapy Types | Drugs | Outcome |
| CA9 | SNV | Missense_Mutation | c.334N>T | p.Asp112Tyr | p.D112Y | Q16790 | protein_coding | deleterious_low_confidence(0) | probably_damaging(0.997) | TCGA-A2-A04X-01 | Breast | breast invasive carcinoma | Female | <65 | I/II | Chemotherapy | adriamycin | SD | |
| CA9 | SNV | Missense_Mutation | rs575743710 | c.1133N>T | p.Thr378Met | p.T378M | Q16790 | protein_coding | tolerated(0.08) | probably_damaging(0.922) | TCGA-A2-A0CO-01 | Breast | breast invasive carcinoma | Female | >=65 | I/II | Hormone Therapy | tamoxiphen | CR |
| CA9 | SNV | Missense_Mutation | c.412N>G | p.Gln138Glu | p.Q138E | Q16790 | protein_coding | tolerated(0.11) | benign(0.009) | TCGA-A2-A0D0-01 | Breast | breast invasive carcinoma | Female | <65 | I/II | Chemotherapy | cytoxan | SD | |
| CA9 | SNV | Missense_Mutation | rs570859735 | c.704N>T | p.Pro235Leu | p.P235L | Q16790 | protein_coding | deleterious(0.03) | benign(0.307) | TCGA-BH-A0DK-01 | Breast | breast invasive carcinoma | Female | <65 | I/II | Hormone Therapy | tamoxiphen | SD |
| CA9 | SNV | Missense_Mutation | c.829N>T | p.Ala277Ser | p.A277S | Q16790 | protein_coding | tolerated(0.13) | possibly_damaging(0.809) | TCGA-BH-A0H7-01 | Breast | breast invasive carcinoma | Female | >=65 | III/IV | Chemotherapy | doxorubicin | SD | |
| CA9 | SNV | Missense_Mutation | rs775245763 | c.1127N>A | p.Arg376Gln | p.R376Q | Q16790 | protein_coding | deleterious(0) | probably_damaging(0.999) | TCGA-D8-A1J8-01 | Breast | breast invasive carcinoma | Female | >=65 | I/II | Hormone Therapy | nolvadex | SD |
| CA9 | insertion | Frame_Shift_Ins | novel | c.408_409insGGGCTGGTCTC | p.Asp137GlyfsTer72 | p.D137Gfs*72 | Q16790 | protein_coding | TCGA-A8-A07O-01 | Breast | breast invasive carcinoma | Female | <65 | I/II | Chemotherapy | CR | |||
| CA9 | insertion | Frame_Shift_Ins | novel | c.410_411insACTCCTGATCTCAGGTGAT | p.Asp137GlufsTer133 | p.D137Efs*133 | Q16790 | protein_coding | TCGA-A8-A07O-01 | Breast | breast invasive carcinoma | Female | <65 | I/II | Chemotherapy | CR | |||
| CA9 | deletion | Frame_Shift_Del | novel | c.364delN | p.Pro122LeufsTer83 | p.P122Lfs*83 | Q16790 | protein_coding | TCGA-D8-A27V-01 | Breast | breast invasive carcinoma | Female | <65 | I/II | Hormone Therapy | tamoxiphen | SD | ||
| CA9 | SNV | Missense_Mutation | rs746857543 | c.898N>A | p.Ala300Thr | p.A300T | Q16790 | protein_coding | tolerated(0.69) | benign(0.003) | TCGA-2W-A8YY-01 | Cervix | cervical & endocervical cancer | Female | <65 | I/II | Chemotherapy | cisplatin | CR |
| Page: 1 2 3 4 5 6 |
Top |
Related drugs of malignant transformation related genes |
| Identification of chemicals and drugs interact with genes involved in malignant transfromation |
| (DGIdb 4.0) |
| Entrez ID | Symbol | Category | Interaction Types | Drug Claim Name | Drug Name | PMIDs |
| 768 | CA9 | DRUGGABLE GENOME, ENZYME | inhibitor | 385612194 | ||
| 768 | CA9 | DRUGGABLE GENOME, ENZYME | inhibitor | CHEMBL18 | ETHOXZOLAMIDE | |
| 768 | CA9 | DRUGGABLE GENOME, ENZYME | Sulfonamide-thiadiazole derivative 1 | |||
| 768 | CA9 | DRUGGABLE GENOME, ENZYME | 90Y-cG250 | |||
| 768 | CA9 | DRUGGABLE GENOME, ENZYME | CHEMBL3707297 | CG250 177LU | ||
| 768 | CA9 | DRUGGABLE GENOME, ENZYME | SULFAMIDE | SULFAMIDE | ||
| 768 | CA9 | DRUGGABLE GENOME, ENZYME | inhibitor | 385612193 | ||
| 768 | CA9 | DRUGGABLE GENOME, ENZYME | Girentuximab | GIRENTUXIMAB | ||
| 768 | CA9 | DRUGGABLE GENOME, ENZYME | celecoxib | CELECOXIB | 22336956 | |
| 768 | CA9 | DRUGGABLE GENOME, ENZYME | PHENOL | PHENOL |
| Page: 1 2 3 |

Copyright 2023-Present -The University of Texas Health Science Center at Houston |