
|
|||||
|
 | |
| |
| |
| |
| |
| |
|
Gene: CA8 |
Gene summary for CA8 |
| Gene information | Species | Human | Gene symbol | CA8 | Gene ID | 767 |
| Gene name | carbonic anhydrase 8 | |
| Gene Alias | CA-RP | |
| Cytomap | 8q12.1 | |
| Gene Type | protein-coding | GO ID | GO:0006730 | UniProtAcc | P35219 |
Top |
Malignant transformation analysis |
| Identification of the aberrant gene expression in precancerous and cancerous lesions by comparing the gene expression of stem-like cells in diseased tissues with normal stem cells |
| Entrez ID | Symbol | Replicates | Species | Organ | Tissue | Adj P-value | Log2FC | Malignancy |
| 767 | CA8 | AEH-subject1 | Human | Endometrium | AEH | 4.76e-35 | 7.69e-01 | -0.3059 |
| 767 | CA8 | AEH-subject2 | Human | Endometrium | AEH | 1.08e-08 | 4.39e-01 | -0.2525 |
| 767 | CA8 | AEH-subject3 | Human | Endometrium | AEH | 1.08e-21 | 6.30e-01 | -0.2576 |
| 767 | CA8 | AEH-subject4 | Human | Endometrium | AEH | 9.59e-20 | 6.76e-01 | -0.2657 |
| 767 | CA8 | AEH-subject5 | Human | Endometrium | AEH | 5.24e-09 | 4.61e-01 | -0.2953 |
| 767 | CA8 | EEC-subject1 | Human | Endometrium | EEC | 3.56e-13 | 5.40e-01 | -0.2682 |
| 767 | CA8 | EEC-subject2 | Human | Endometrium | EEC | 1.92e-03 | 3.41e-01 | -0.2607 |
| 767 | CA8 | EEC-subject3 | Human | Endometrium | EEC | 5.71e-18 | 6.52e-01 | -0.2525 |
| 767 | CA8 | EEC-subject4 | Human | Endometrium | EEC | 1.33e-09 | 4.17e-01 | -0.2571 |
| 767 | CA8 | GSM5276935 | Human | Endometrium | EEC | 2.81e-31 | 5.63e-01 | -0.123 |
| 767 | CA8 | GSM6177620_NYU_UCEC1_lib1_lib1 | Human | Endometrium | EEC | 1.08e-04 | 1.38e-01 | -0.1869 |
| 767 | CA8 | GSM6177620_NYU_UCEC1_lib3_lib3 | Human | Endometrium | EEC | 1.73e-03 | 3.64e-02 | -0.1883 |
| 767 | CA8 | GSM6177621_NYU_UCEC2_lib1_lib1 | Human | Endometrium | EEC | 4.44e-33 | 8.70e-01 | -0.1934 |
| 767 | CA8 | GSM6177622_NYU_UCEC3_lib1_lib1 | Human | Endometrium | EEC | 6.13e-03 | 6.31e-02 | -0.1917 |
| 767 | CA8 | P5T-E | Human | Esophagus | ESCC | 9.03e-03 | 1.11e-01 | 0.1327 |
| 767 | CA8 | P30T-E | Human | Esophagus | ESCC | 2.59e-07 | 6.08e-01 | 0.137 |
| 767 | CA8 | P36T-E | Human | Esophagus | ESCC | 9.25e-03 | 2.15e-01 | 0.1187 |
| 767 | CA8 | P56T-E | Human | Esophagus | ESCC | 1.53e-05 | 6.25e-01 | 0.1613 |
| 767 | CA8 | P57T-E | Human | Esophagus | ESCC | 1.42e-02 | 1.10e-01 | 0.0926 |
| 767 | CA8 | P76T-E | Human | Esophagus | ESCC | 2.45e-02 | 1.84e-01 | 0.1207 |
| Page: 1 2 |
| Tissue | Expression Dynamics | Abbreviation |
| Endometrium | 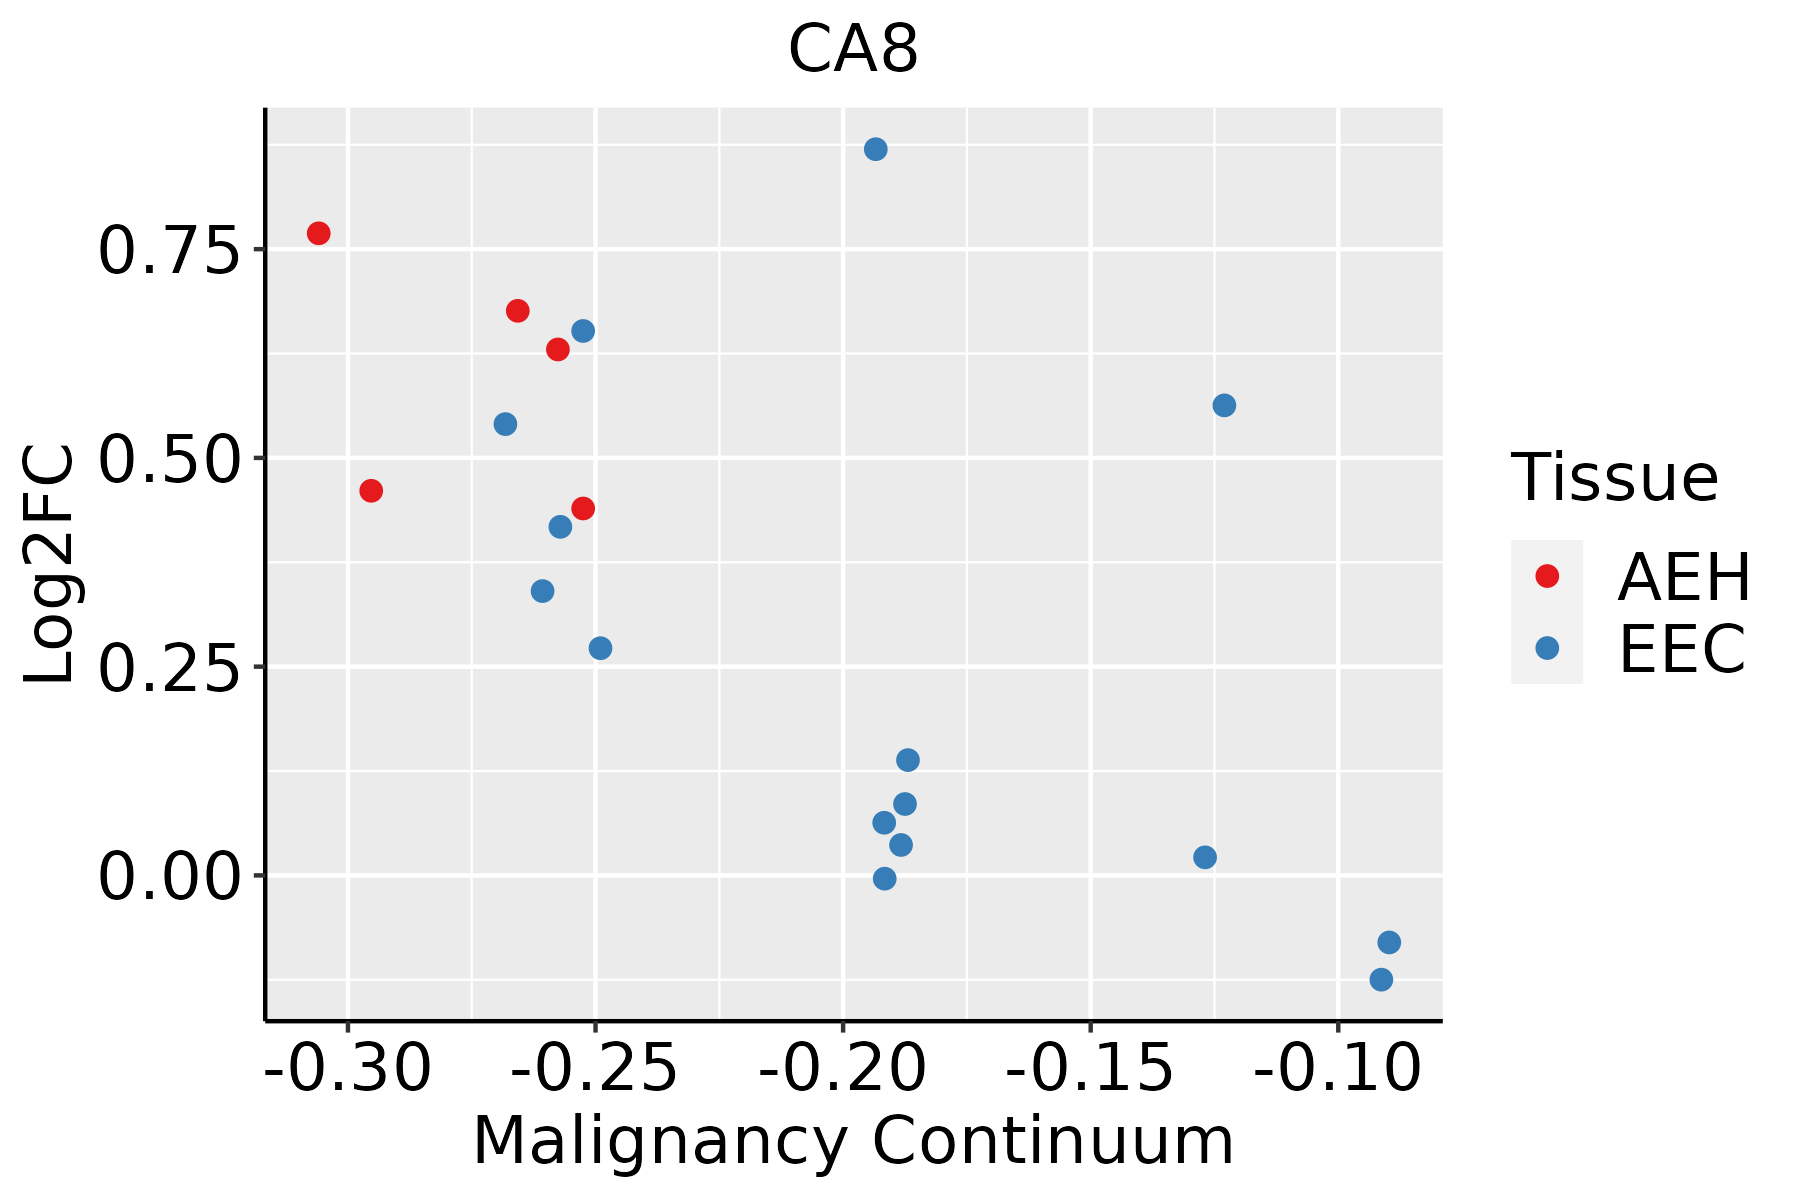 | AEH: Atypical endometrial hyperplasia |
| EEC: Endometrioid Cancer | ||
| Esophagus | 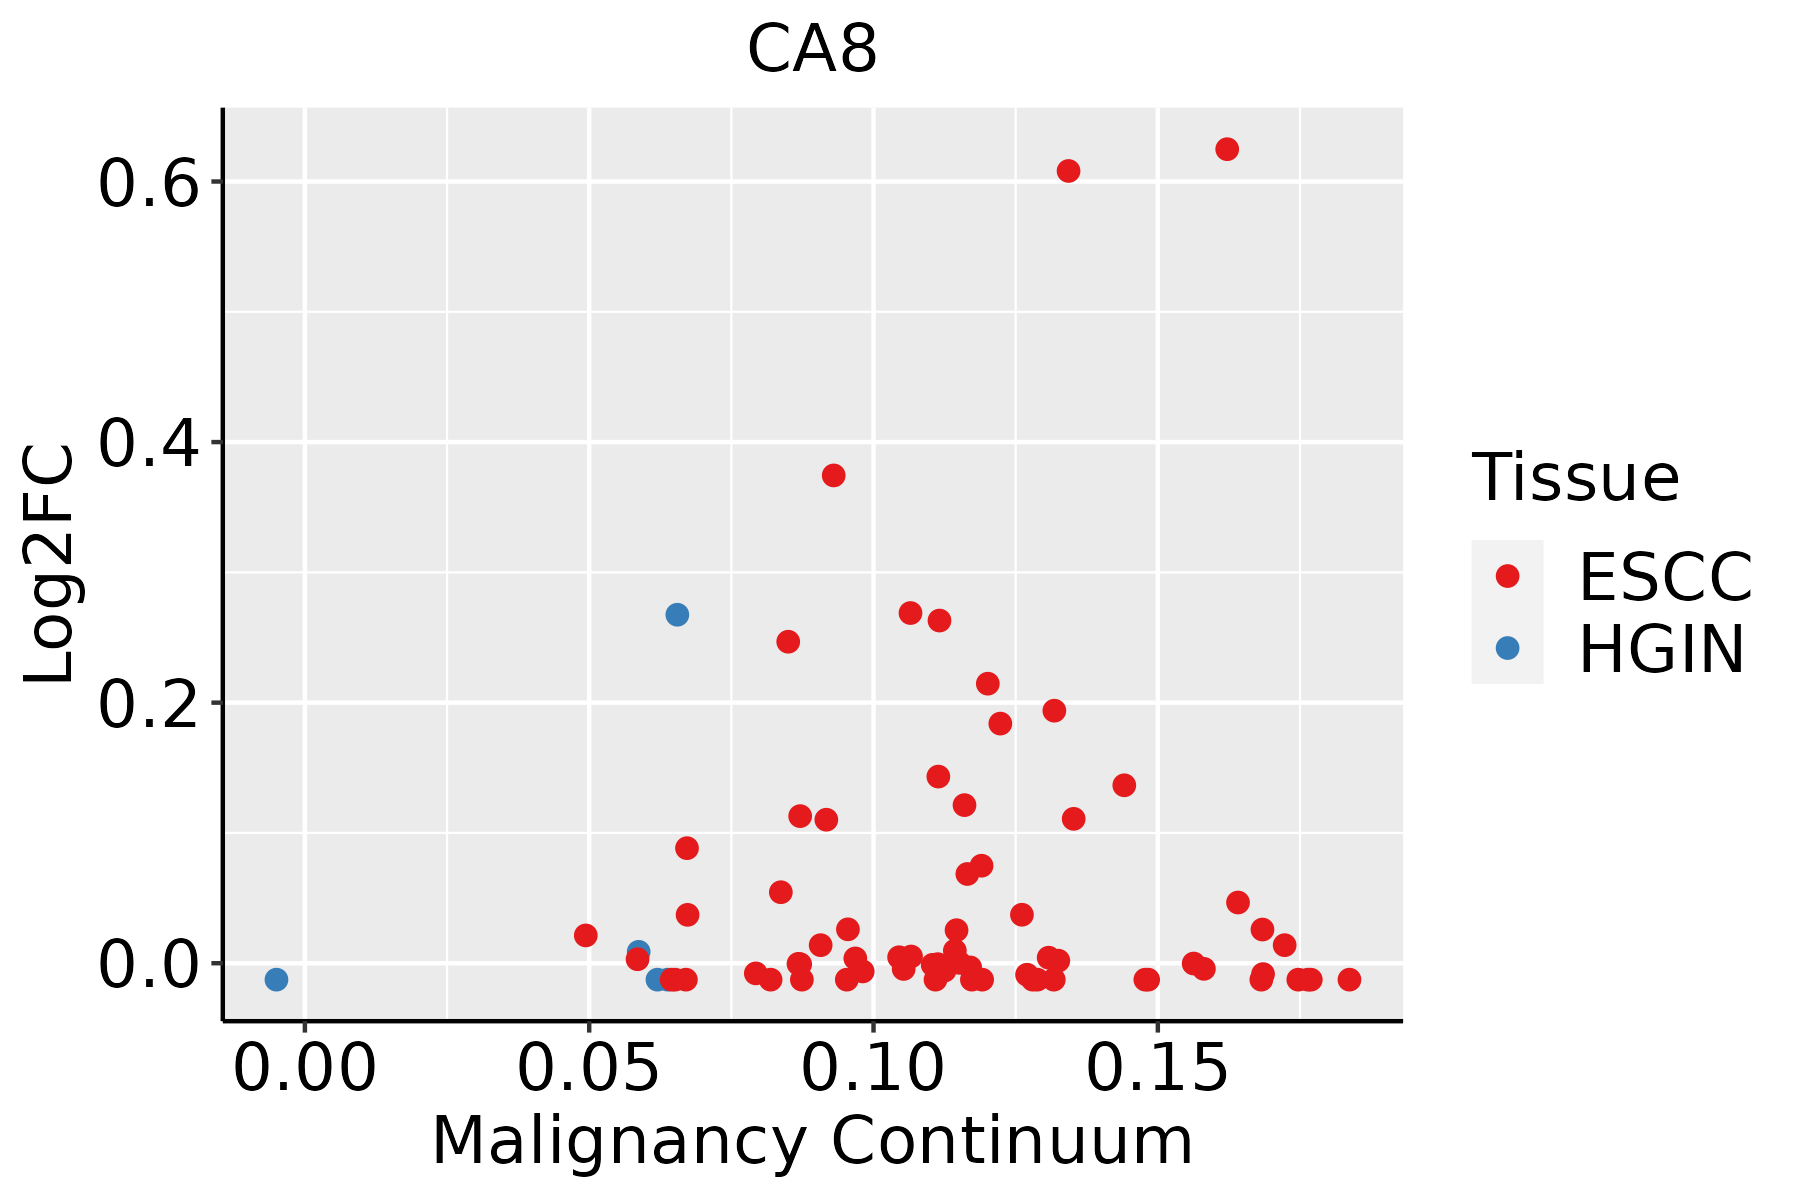 | ESCC: Esophageal squamous cell carcinoma |
| HGIN: High-grade intraepithelial neoplasias | ||
| LGIN: Low-grade intraepithelial neoplasias |
| ∗log2FC in expression of this searched gene in stem-like cells from each diseased tissue sample relative to stem-like cells in normal samples in each tissue plotted against the malignancy continuum. Samples are colored based on if they are from different disease stage. |
Top |
Malignant transformation related pathway analysis |
| Find out the enriched GO biological processes and KEGG pathways involved in transition from healthy to precancer to cancer |
| Tissue | Disease Stage | Enriched GO biological Processes |
| Colorectum | AD |  |
| Colorectum | SER |  |
| Colorectum | MSS |  |
| Colorectum | MSI-H |  |
| Colorectum | FAP |  |
| ∗Top 15 enriched GO BP terms are showed in the bar plot of each disease state in each tissue. Each row represents a significant GO biological process which is colored according to the -log10(p.adjust). |
| Page: 1 2 3 4 5 6 7 8 9 |
| GO ID | Tissue | Disease Stage | Description | Gene Ratio | Bg Ratio | pvalue | p.adjust | Count |
| GO:014001414 | Esophagus | ESCC | mitotic nuclear division | 218/8552 | 287/18723 | 6.17e-26 | 1.78e-23 | 218 |
| GO:005165617 | Esophagus | ESCC | establishment of organelle localization | 273/8552 | 390/18723 | 9.13e-23 | 1.81e-20 | 273 |
| GO:000007011 | Esophagus | ESCC | mitotic sister chromatid segregation | 138/8552 | 168/18723 | 1.37e-22 | 2.63e-20 | 138 |
| GO:00008194 | Esophagus | ESCC | sister chromatid segregation | 157/8552 | 202/18723 | 8.41e-21 | 1.33e-18 | 157 |
| GO:000705911 | Esophagus | ESCC | chromosome segregation | 238/8552 | 346/18723 | 1.72e-18 | 1.82e-16 | 238 |
| GO:005131011 | Esophagus | ESCC | metaphase plate congression | 58/8552 | 65/18723 | 1.81e-13 | 8.63e-12 | 58 |
| GO:000708011 | Esophagus | ESCC | mitotic metaphase plate congression | 47/8552 | 50/18723 | 3.15e-13 | 1.47e-11 | 47 |
| GO:00482853 | Esophagus | ESCC | organelle fission | 301/8552 | 488/18723 | 4.64e-13 | 2.12e-11 | 301 |
| GO:00988133 | Esophagus | ESCC | nuclear chromosome segregation | 187/8552 | 281/18723 | 1.00e-12 | 4.36e-11 | 187 |
| GO:005130311 | Esophagus | ESCC | establishment of chromosome localization | 67/8552 | 80/18723 | 1.92e-12 | 8.09e-11 | 67 |
| GO:005000011 | Esophagus | ESCC | chromosome localization | 68/8552 | 82/18723 | 3.37e-12 | 1.32e-10 | 68 |
| GO:00002802 | Esophagus | ESCC | nuclear division | 270/8552 | 439/18723 | 1.17e-11 | 4.24e-10 | 270 |
| GO:00108765 | Liver | NAFLD | lipid localization | 79/1882 | 448/18723 | 4.75e-07 | 2.92e-05 | 79 |
| GO:00303013 | Liver | NAFLD | cholesterol transport | 30/1882 | 117/18723 | 1.08e-06 | 5.40e-05 | 30 |
| GO:00068694 | Liver | NAFLD | lipid transport | 71/1882 | 398/18723 | 1.16e-06 | 5.59e-05 | 71 |
| GO:00159183 | Liver | NAFLD | sterol transport | 32/1882 | 130/18723 | 1.27e-06 | 6.01e-05 | 32 |
| GO:0032373 | Liver | NAFLD | positive regulation of sterol transport | 15/1882 | 38/18723 | 1.68e-06 | 7.43e-05 | 15 |
| GO:0032376 | Liver | NAFLD | positive regulation of cholesterol transport | 15/1882 | 38/18723 | 1.68e-06 | 7.43e-05 | 15 |
| GO:0033344 | Liver | NAFLD | cholesterol efflux | 20/1882 | 69/18723 | 9.13e-06 | 2.98e-04 | 20 |
| GO:0015850 | Liver | NAFLD | organic hydroxy compound transport | 50/1882 | 284/18723 | 6.01e-05 | 1.32e-03 | 50 |
| Page: 1 2 3 4 5 6 |
| Pathway ID | Tissue | Disease Stage | Description | Gene Ratio | Bg Ratio | pvalue | p.adjust | qvalue | Count |
| Page: 1 |
Top |
Cell-cell communication analysis |
| Identification of potential cell-cell interactions between two cell types and their ligand-receptor pairs for different disease states |
| Ligand | Receptor | LRpair | Pathway | Tissue | Disease Stage |
| Page: 1 |
Top |
Single-cell gene regulatory network inference analysis |
| Find out the significant the regulons (TFs) and the target genes of each regulon across cell types for different disease states |
| TF | Cell Type | Tissue | Disease Stage | Target Gene | RSS | Regulon Activity |
| ∗The dot plots of a searched regulon are shown for all cell subpopulations in each disease state of each tissue based on the regulon specific score inferred using pySCENIC and by calculating the average expression. |
| Page: 1 |
Top |
Somatic mutation of malignant transformation related genes |
| Annotation of somatic variants for genes involved in malignant transformation |
| Hugo Symbol | Variant Class | Variant Classification | dbSNP RS | HGVSc | HGVSp | HGVSp Short | SWISSPROT | BIOTYPE | SIFT | PolyPhen | Tumor Sample Barcode | Tissue | Histology | Sex | Age | Stage | Therapy Types | Drugs | Outcome |
| CA8 | SNV | Missense_Mutation | c.287A>C | p.Lys96Thr | p.K96T | P35219 | protein_coding | deleterious(0.01) | benign(0.103) | TCGA-A6-6141-01 | Colorectum | colon adenocarcinoma | Male | <65 | I/II | Chemotherapy | 5-fu | SD | |
| CA8 | SNV | Missense_Mutation | c.314N>A | p.Pro105His | p.P105H | P35219 | protein_coding | deleterious(0.01) | possibly_damaging(0.807) | TCGA-AA-3715-01 | Colorectum | colon adenocarcinoma | Male | >=65 | I/II | Unknown | Unknown | PD | |
| CA8 | SNV | Missense_Mutation | c.775N>A | p.Gly259Arg | p.G259R | P35219 | protein_coding | deleterious(0) | probably_damaging(0.999) | TCGA-AA-3811-01 | Colorectum | colon adenocarcinoma | Female | >=65 | III/IV | Unknown | Unknown | PD | |
| CA8 | SNV | Missense_Mutation | rs387906598 | c.710N>A | p.Arg237Gln | p.R237Q | P35219 | protein_coding | deleterious(0.01) | benign(0.027) | TCGA-AA-3984-01 | Colorectum | colon adenocarcinoma | Female | <65 | I/II | Unknown | Unknown | SD |
| CA8 | SNV | Missense_Mutation | c.824N>A | p.Arg275Gln | p.R275Q | P35219 | protein_coding | deleterious(0) | probably_damaging(0.996) | TCGA-AA-A02E-01 | Colorectum | colon adenocarcinoma | Female | >=65 | III/IV | Unknown | Unknown | PD | |
| CA8 | SNV | Missense_Mutation | rs201131573 | c.340N>A | p.Glu114Lys | p.E114K | P35219 | protein_coding | deleterious(0.02) | possibly_damaging(0.829) | TCGA-AZ-4315-01 | Colorectum | colon adenocarcinoma | Male | <65 | I/II | Unknown | Unknown | SD |
| CA8 | SNV | Missense_Mutation | c.191N>T | p.Ser64Leu | p.S64L | P35219 | protein_coding | tolerated(0.07) | benign(0.003) | TCGA-CM-5348-01 | Colorectum | colon adenocarcinoma | Male | >=65 | III/IV | Unknown | Unknown | SD | |
| CA8 | SNV | Missense_Mutation | rs746839542 | c.490N>A | p.Ala164Thr | p.A164T | P35219 | protein_coding | tolerated(0.07) | benign(0.094) | TCGA-G4-6302-01 | Colorectum | colon adenocarcinoma | Female | >=65 | I/II | Unknown | Unknown | SD |
| CA8 | SNV | Missense_Mutation | rs773452906 | c.752N>A | p.Arg251Gln | p.R251Q | P35219 | protein_coding | deleterious(0) | probably_damaging(0.978) | TCGA-AG-A002-01 | Colorectum | rectum adenocarcinoma | Male | <65 | I/II | Unknown | Unknown | SD |
| CA8 | SNV | Missense_Mutation | rs200882621 | c.374G>A | p.Arg125His | p.R125H | P35219 | protein_coding | tolerated(0.09) | probably_damaging(0.992) | TCGA-AG-A00Y-01 | Colorectum | rectum adenocarcinoma | Male | >=65 | I/II | Unknown | Unknown | PD |
| Page: 1 2 3 4 5 |
Top |
Related drugs of malignant transformation related genes |
| Identification of chemicals and drugs interact with genes involved in malignant transfromation |
| (DGIdb 4.0) |
| Entrez ID | Symbol | Category | Interaction Types | Drug Claim Name | Drug Name | PMIDs |
| Page: 1 |

Copyright 2023-Present -The University of Texas Health Science Center at Houston |