
|
|||||
|
 | |
| |
| |
| |
| |
| |
|
Gene: CA5B |
Gene summary for CA5B |
| Gene information | Species | Human | Gene symbol | CA5B | Gene ID | 11238 |
| Gene name | carbonic anhydrase 5B | |
| Gene Alias | CA-VB | |
| Cytomap | Xp22.2 | |
| Gene Type | protein-coding | GO ID | GO:0006730 | UniProtAcc | A0A024RBW9 |
Top |
Malignant transformation analysis |
| Identification of the aberrant gene expression in precancerous and cancerous lesions by comparing the gene expression of stem-like cells in diseased tissues with normal stem cells |
| Entrez ID | Symbol | Replicates | Species | Organ | Tissue | Adj P-value | Log2FC | Malignancy |
| 11238 | CA5B | LZE7T | Human | Esophagus | ESCC | 3.92e-04 | 1.96e-01 | 0.0667 |
| 11238 | CA5B | LZE24T | Human | Esophagus | ESCC | 5.70e-09 | 2.35e-01 | 0.0596 |
| 11238 | CA5B | LZE21T | Human | Esophagus | ESCC | 9.94e-03 | 1.64e-01 | 0.0655 |
| 11238 | CA5B | LZE6T | Human | Esophagus | ESCC | 4.56e-02 | 2.02e-01 | 0.0845 |
| 11238 | CA5B | P2T-E | Human | Esophagus | ESCC | 9.88e-19 | 3.39e-01 | 0.1177 |
| 11238 | CA5B | P4T-E | Human | Esophagus | ESCC | 1.36e-16 | 3.16e-01 | 0.1323 |
| 11238 | CA5B | P5T-E | Human | Esophagus | ESCC | 2.67e-02 | 1.15e-01 | 0.1327 |
| 11238 | CA5B | P8T-E | Human | Esophagus | ESCC | 4.49e-13 | 2.63e-01 | 0.0889 |
| 11238 | CA5B | P9T-E | Human | Esophagus | ESCC | 7.79e-05 | 7.62e-02 | 0.1131 |
| 11238 | CA5B | P11T-E | Human | Esophagus | ESCC | 1.69e-04 | 1.75e-01 | 0.1426 |
| 11238 | CA5B | P12T-E | Human | Esophagus | ESCC | 1.76e-10 | 2.11e-01 | 0.1122 |
| 11238 | CA5B | P15T-E | Human | Esophagus | ESCC | 5.83e-04 | 8.12e-02 | 0.1149 |
| 11238 | CA5B | P16T-E | Human | Esophagus | ESCC | 1.24e-07 | 1.51e-01 | 0.1153 |
| 11238 | CA5B | P19T-E | Human | Esophagus | ESCC | 4.15e-05 | 2.65e-01 | 0.1662 |
| 11238 | CA5B | P20T-E | Human | Esophagus | ESCC | 5.16e-11 | 2.32e-01 | 0.1124 |
| 11238 | CA5B | P22T-E | Human | Esophagus | ESCC | 1.96e-02 | 6.28e-02 | 0.1236 |
| 11238 | CA5B | P23T-E | Human | Esophagus | ESCC | 4.73e-13 | 2.99e-01 | 0.108 |
| 11238 | CA5B | P26T-E | Human | Esophagus | ESCC | 5.89e-13 | 2.45e-01 | 0.1276 |
| 11238 | CA5B | P27T-E | Human | Esophagus | ESCC | 2.08e-03 | 1.48e-01 | 0.1055 |
| 11238 | CA5B | P28T-E | Human | Esophagus | ESCC | 5.94e-06 | 1.02e-01 | 0.1149 |
| Page: 1 2 3 |
| Tissue | Expression Dynamics | Abbreviation |
| Esophagus | 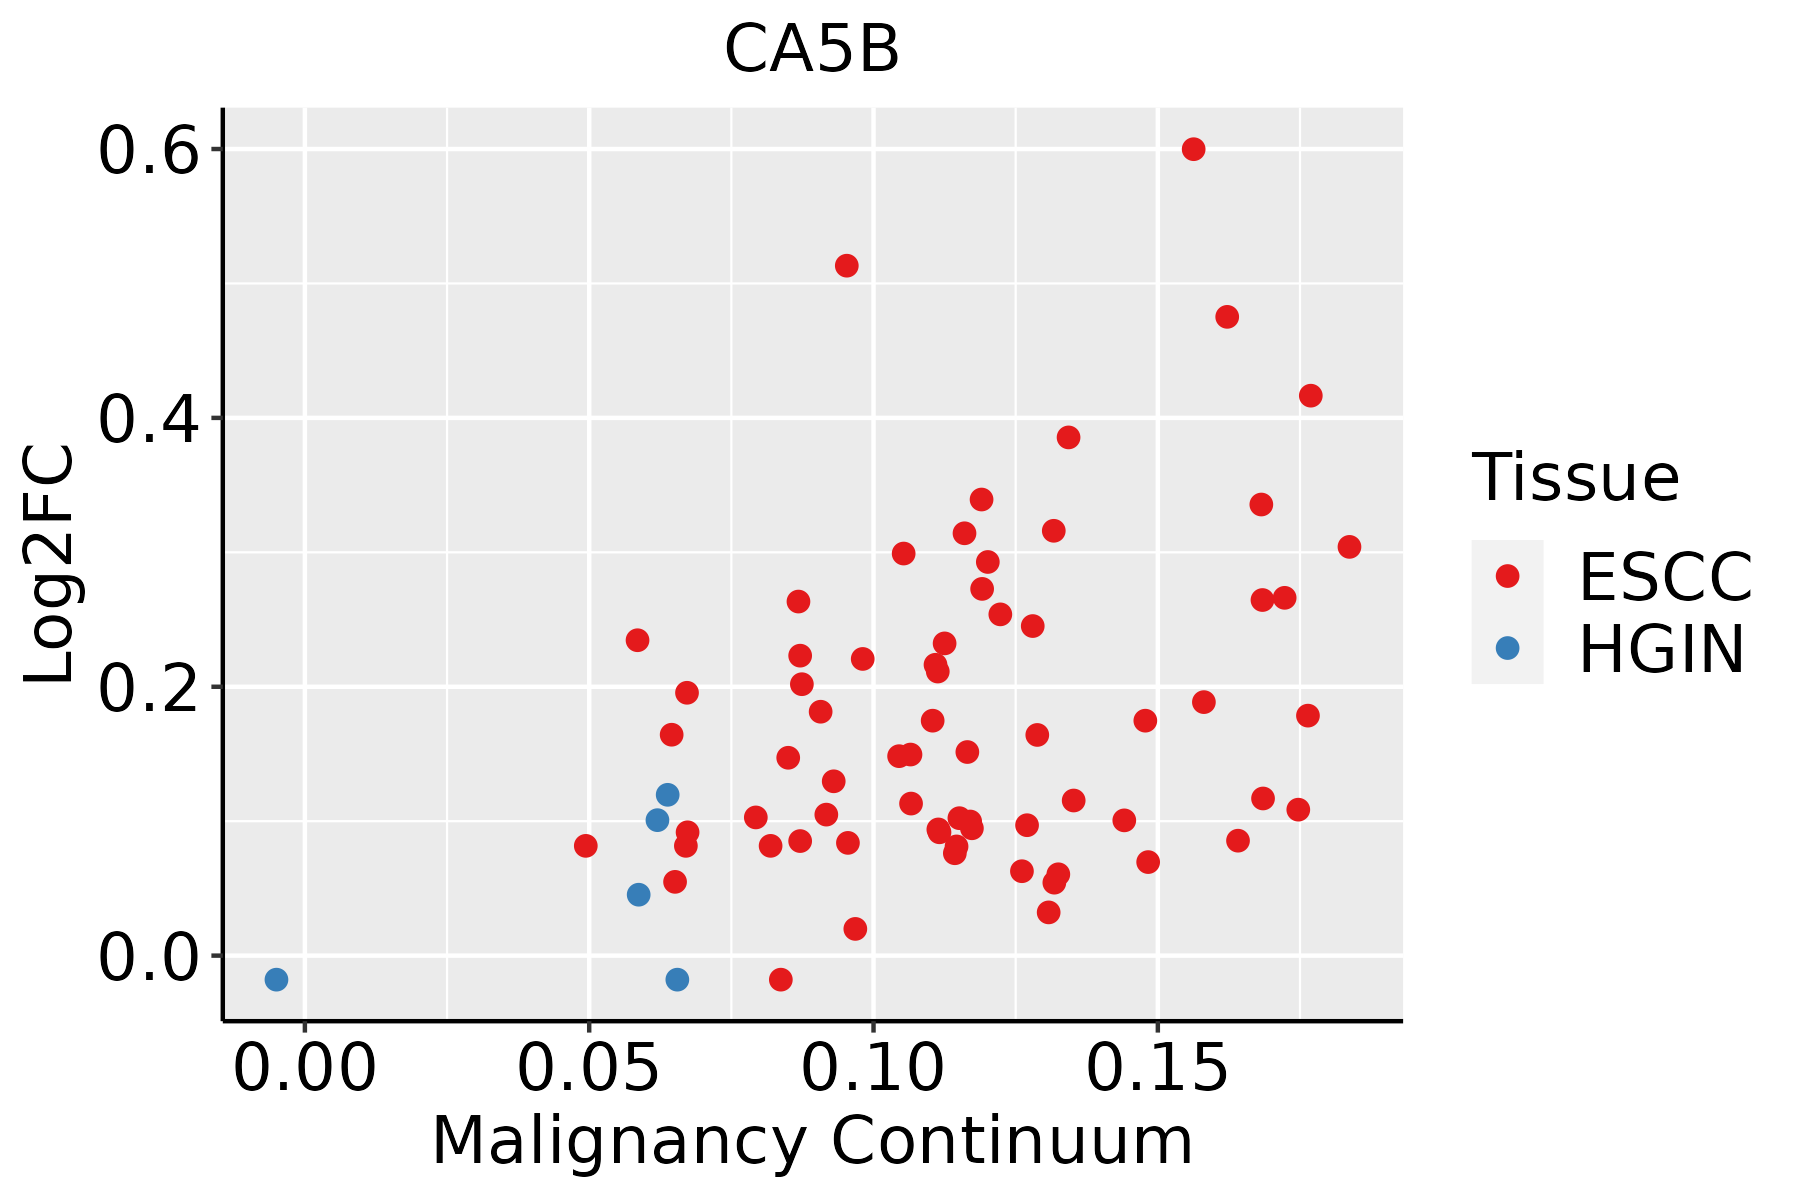 | ESCC: Esophageal squamous cell carcinoma |
| HGIN: High-grade intraepithelial neoplasias | ||
| LGIN: Low-grade intraepithelial neoplasias |
| ∗log2FC in expression of this searched gene in stem-like cells from each diseased tissue sample relative to stem-like cells in normal samples in each tissue plotted against the malignancy continuum. Samples are colored based on if they are from different disease stage. |
Top |
Malignant transformation related pathway analysis |
| Find out the enriched GO biological processes and KEGG pathways involved in transition from healthy to precancer to cancer |
| Tissue | Disease Stage | Enriched GO biological Processes |
| Colorectum | AD |  |
| Colorectum | SER |  |
| Colorectum | MSS |  |
| Colorectum | MSI-H |  |
| Colorectum | FAP |  |
| ∗Top 15 enriched GO BP terms are showed in the bar plot of each disease state in each tissue. Each row represents a significant GO biological process which is colored according to the -log10(p.adjust). |
| Page: 1 2 3 4 5 6 7 8 9 |
| GO ID | Tissue | Disease Stage | Description | Gene Ratio | Bg Ratio | pvalue | p.adjust | Count |
| Page: 1 |
| Pathway ID | Tissue | Disease Stage | Description | Gene Ratio | Bg Ratio | pvalue | p.adjust | qvalue | Count |
| Page: 1 |
Top |
Cell-cell communication analysis |
| Identification of potential cell-cell interactions between two cell types and their ligand-receptor pairs for different disease states |
| Ligand | Receptor | LRpair | Pathway | Tissue | Disease Stage |
| Page: 1 |
Top |
Single-cell gene regulatory network inference analysis |
| Find out the significant the regulons (TFs) and the target genes of each regulon across cell types for different disease states |
| TF | Cell Type | Tissue | Disease Stage | Target Gene | RSS | Regulon Activity |
| ∗The dot plots of a searched regulon are shown for all cell subpopulations in each disease state of each tissue based on the regulon specific score inferred using pySCENIC and by calculating the average expression. |
| Page: 1 |
Top |
Somatic mutation of malignant transformation related genes |
| Annotation of somatic variants for genes involved in malignant transformation |
| Hugo Symbol | Variant Class | Variant Classification | dbSNP RS | HGVSc | HGVSp | HGVSp Short | SWISSPROT | BIOTYPE | SIFT | PolyPhen | Tumor Sample Barcode | Tissue | Histology | Sex | Age | Stage | Therapy Types | Drugs | Outcome |
| CA5B | SNV | Missense_Mutation | c.401G>A | p.Gly134Glu | p.G134E | Q9Y2D0 | protein_coding | deleterious(0) | probably_damaging(1) | TCGA-AO-A128-01 | Breast | breast invasive carcinoma | Female | <65 | I/II | Chemotherapy | doxorubicin | SD | |
| CA5B | SNV | Missense_Mutation | novel | c.676G>T | p.Asp226Tyr | p.D226Y | Q9Y2D0 | protein_coding | deleterious(0) | probably_damaging(0.999) | TCGA-B6-A0RG-01 | Breast | breast invasive carcinoma | Female | <65 | I/II | Unknown | Unknown | SD |
| CA5B | SNV | Missense_Mutation | novel | c.134A>C | p.Asn45Thr | p.N45T | Q9Y2D0 | protein_coding | tolerated(0.05) | benign(0.353) | TCGA-BH-A0H3-01 | Breast | breast invasive carcinoma | Female | <65 | I/II | Unknown | Unknown | SD |
| CA5B | insertion | Nonsense_Mutation | novel | c.847_848insATCCTTGGTAAATGGATAATATGTGGGGACAGGGCCTTTGCCCCAAGT | p.Pro283delinsHisProTrpTerMetAspAsnMetTrpGlyGlnGlyLeuCysProLysSer | p.P283delinsHPW*MDNMWGQGLCPKS | Q9Y2D0 | protein_coding | TCGA-A8-A07R-01 | Breast | breast invasive carcinoma | Female | >=65 | III/IV | Ancillary | zoledronic | SD | ||
| CA5B | SNV | Missense_Mutation | novel | c.277N>A | p.Leu93Ile | p.L93I | Q9Y2D0 | protein_coding | tolerated(0.07) | possibly_damaging(0.481) | TCGA-AD-5900-01 | Colorectum | colon adenocarcinoma | Male | >=65 | I/II | Unknown | Unknown | SD |
| CA5B | SNV | Missense_Mutation | novel | c.298T>C | p.Tyr100His | p.Y100H | Q9Y2D0 | protein_coding | tolerated(1) | probably_damaging(0.995) | TCGA-AD-A5EJ-01 | Colorectum | colon adenocarcinoma | Female | >=65 | I/II | Unknown | Unknown | SD |
| CA5B | SNV | Missense_Mutation | c.622N>A | p.Ala208Thr | p.A208T | Q9Y2D0 | protein_coding | tolerated(0.7) | benign(0.003) | TCGA-AZ-6598-01 | Colorectum | colon adenocarcinoma | Female | >=65 | I/II | Unknown | Unknown | SD | |
| CA5B | SNV | Missense_Mutation | rs769895567 | c.787N>T | p.Arg263Trp | p.R263W | Q9Y2D0 | protein_coding | deleterious(0) | probably_damaging(1) | TCGA-F5-6814-01 | Colorectum | rectum adenocarcinoma | Male | <65 | I/II | Unknown | Unknown | SD |
| CA5B | insertion | Frame_Shift_Ins | novel | c.848_849insAT | p.Leu284SerfsTer5 | p.L284Sfs*5 | Q9Y2D0 | protein_coding | TCGA-AG-3726-01 | Colorectum | rectum adenocarcinoma | Female | <65 | I/II | Unknown | Unknown | SD | ||
| CA5B | SNV | Missense_Mutation | c.43N>G | p.Pro15Ala | p.P15A | Q9Y2D0 | protein_coding | tolerated_low_confidence(0.53) | benign(0.001) | TCGA-A5-A0GA-01 | Endometrium | uterine corpus endometrioid carcinoma | Female | >=65 | III/IV | Chemotherapy | taxol | PD |
| Page: 1 2 3 4 |
Top |
Related drugs of malignant transformation related genes |
| Identification of chemicals and drugs interact with genes involved in malignant transfromation |
| (DGIdb 4.0) |
| Entrez ID | Symbol | Category | Interaction Types | Drug Claim Name | Drug Name | PMIDs |
| 11238 | CA5B | DRUGGABLE GENOME | inhibitor | CHEMBL18 | ETHOXZOLAMIDE |
| Page: 1 |

Copyright 2023-Present -The University of Texas Health Science Center at Houston |