
|
|||||
|
 | |
| |
| |
| |
| |
| |
|
Gene: CA11 |
Gene summary for CA11 |
| Gene information | Species | Human | Gene symbol | CA11 | Gene ID | 770 |
| Gene name | carbonic anhydrase 11 | |
| Gene Alias | CA-RP | |
| Cytomap | 19q13.33 | |
| Gene Type | protein-coding | GO ID | GO:0006730 | UniProtAcc | O75493 |
Top |
Malignant transformation analysis |
| Identification of the aberrant gene expression in precancerous and cancerous lesions by comparing the gene expression of stem-like cells in diseased tissues with normal stem cells |
| Entrez ID | Symbol | Replicates | Species | Organ | Tissue | Adj P-value | Log2FC | Malignancy |
| 770 | CA11 | HCC1_Meng | Human | Liver | HCC | 1.47e-12 | -4.69e-02 | 0.0246 |
| 770 | CA11 | HCC2_Meng | Human | Liver | HCC | 1.87e-03 | -2.60e-02 | 0.0107 |
| 770 | CA11 | cirrhotic3 | Human | Liver | Cirrhotic | 3.57e-04 | 1.18e-01 | 0.0215 |
| 770 | CA11 | HCC2 | Human | Liver | HCC | 1.15e-06 | 3.04e+00 | 0.5341 |
| 770 | CA11 | S015 | Human | Liver | HCC | 2.89e-10 | 6.73e-01 | 0.2375 |
| 770 | CA11 | S016 | Human | Liver | HCC | 3.17e-05 | 2.93e-01 | 0.2243 |
| 770 | CA11 | male-WTA | Human | Thyroid | PTC | 6.51e-21 | 1.99e-01 | 0.1037 |
| 770 | CA11 | PTC01 | Human | Thyroid | PTC | 2.96e-04 | 2.36e-01 | 0.1899 |
| 770 | CA11 | PTC04 | Human | Thyroid | PTC | 1.13e-05 | 1.54e-01 | 0.1927 |
| 770 | CA11 | PTC05 | Human | Thyroid | PTC | 9.80e-10 | 4.64e-01 | 0.2065 |
| 770 | CA11 | PTC06 | Human | Thyroid | PTC | 1.56e-13 | 3.81e-01 | 0.2057 |
| 770 | CA11 | PTC07 | Human | Thyroid | PTC | 1.25e-34 | 6.34e-01 | 0.2044 |
| 770 | CA11 | ATC13 | Human | Thyroid | ATC | 1.08e-02 | -8.05e-03 | 0.34 |
| 770 | CA11 | ATC4 | Human | Thyroid | ATC | 4.59e-02 | -7.38e-03 | 0.34 |
| Page: 1 |
| Tissue | Expression Dynamics | Abbreviation |
| Liver | 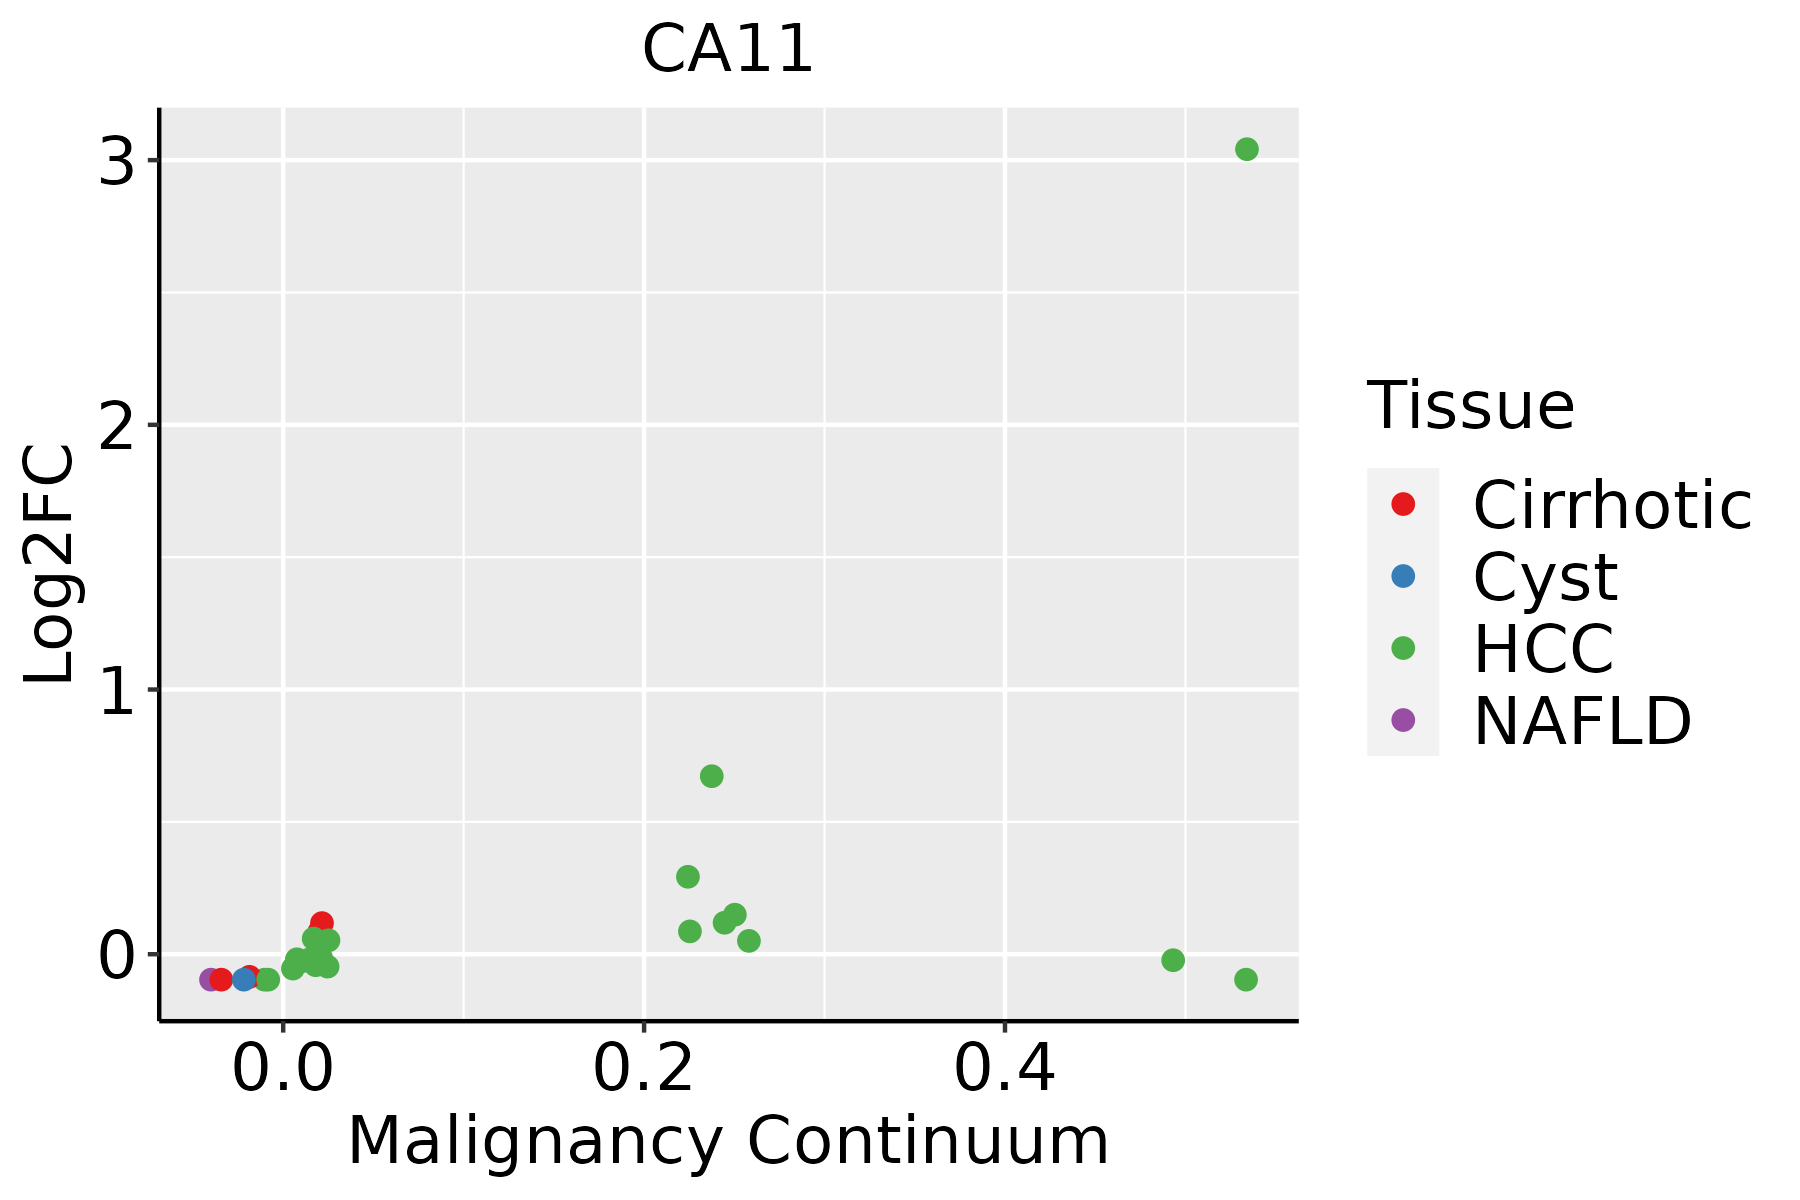 | HCC: Hepatocellular carcinoma |
| NAFLD: Non-alcoholic fatty liver disease | ||
| Thyroid |  | ATC: Anaplastic thyroid cancer |
| HT: Hashimoto's thyroiditis | ||
| PTC: Papillary thyroid cancer |
| ∗log2FC in expression of this searched gene in stem-like cells from each diseased tissue sample relative to stem-like cells in normal samples in each tissue plotted against the malignancy continuum. Samples are colored based on if they are from different disease stage. |
Top |
Malignant transformation related pathway analysis |
| Find out the enriched GO biological processes and KEGG pathways involved in transition from healthy to precancer to cancer |
| Tissue | Disease Stage | Enriched GO biological Processes |
| Colorectum | AD |  |
| Colorectum | SER |  |
| Colorectum | MSS |  |
| Colorectum | MSI-H |  |
| Colorectum | FAP |  |
| ∗Top 15 enriched GO BP terms are showed in the bar plot of each disease state in each tissue. Each row represents a significant GO biological process which is colored according to the -log10(p.adjust). |
| Page: 1 2 3 4 5 6 7 8 9 |
| GO ID | Tissue | Disease Stage | Description | Gene Ratio | Bg Ratio | pvalue | p.adjust | Count |
| GO:00067303 | Liver | Cirrhotic | one-carbon metabolic process | 17/4634 | 40/18723 | 1.04e-02 | 4.61e-02 | 17 |
| Page: 1 |
| Pathway ID | Tissue | Disease Stage | Description | Gene Ratio | Bg Ratio | pvalue | p.adjust | qvalue | Count |
| Page: 1 |
Top |
Cell-cell communication analysis |
| Identification of potential cell-cell interactions between two cell types and their ligand-receptor pairs for different disease states |
| Ligand | Receptor | LRpair | Pathway | Tissue | Disease Stage |
| Page: 1 |
Top |
Single-cell gene regulatory network inference analysis |
| Find out the significant the regulons (TFs) and the target genes of each regulon across cell types for different disease states |
| TF | Cell Type | Tissue | Disease Stage | Target Gene | RSS | Regulon Activity |
| ∗The dot plots of a searched regulon are shown for all cell subpopulations in each disease state of each tissue based on the regulon specific score inferred using pySCENIC and by calculating the average expression. |
| Page: 1 |
Top |
Somatic mutation of malignant transformation related genes |
| Annotation of somatic variants for genes involved in malignant transformation |
| Hugo Symbol | Variant Class | Variant Classification | dbSNP RS | HGVSc | HGVSp | HGVSp Short | SWISSPROT | BIOTYPE | SIFT | PolyPhen | Tumor Sample Barcode | Tissue | Histology | Sex | Age | Stage | Therapy Types | Drugs | Outcome |
| CA11 | SNV | Missense_Mutation | c.359N>G | p.Ser120Cys | p.S120C | O75493 | protein_coding | deleterious(0) | probably_damaging(0.983) | TCGA-D8-A1JA-01 | Breast | breast invasive carcinoma | Female | <65 | III/IV | Chemotherapy | adriamycin | PD | |
| CA11 | SNV | Missense_Mutation | c.469G>A | p.Glu157Lys | p.E157K | O75493 | protein_coding | deleterious(0.04) | probably_damaging(0.942) | TCGA-E2-A10C-01 | Breast | breast invasive carcinoma | Female | <65 | I/II | Chemotherapy | cytoxan | SD | |
| CA11 | SNV | Missense_Mutation | novel | c.698N>A | p.Gly233Asp | p.G233D | O75493 | protein_coding | tolerated(0.18) | possibly_damaging(0.681) | TCGA-OL-A5RW-01 | Breast | breast invasive carcinoma | Female | <65 | I/II | Chemotherapy | adriamycin | CR |
| CA11 | SNV | Missense_Mutation | novel | c.803N>T | p.Ser268Phe | p.S268F | O75493 | protein_coding | deleterious(0.02) | probably_damaging(0.997) | TCGA-DS-A5RQ-01 | Cervix | cervical & endocervical cancer | Female | >=65 | I/II | Chemotherapy | cisplatin | CR |
| CA11 | SNV | Missense_Mutation | novel | c.704N>C | p.Ile235Thr | p.I235T | O75493 | protein_coding | deleterious(0.01) | benign(0.079) | TCGA-GH-A9DA-01 | Cervix | cervical & endocervical cancer | Female | <65 | I/II | Unknown | Unknown | SD |
| CA11 | SNV | Missense_Mutation | novel | c.250N>G | p.Leu84Val | p.L84V | O75493 | protein_coding | deleterious(0) | possibly_damaging(0.46) | TCGA-PN-A8MA-01 | Cervix | cervical & endocervical cancer | Female | <65 | I/II | Chemotherapy | cisplatin | SD |
| CA11 | SNV | Missense_Mutation | novel | c.673G>A | p.Glu225Lys | p.E225K | O75493 | protein_coding | tolerated(0.24) | probably_damaging(0.935) | TCGA-ZJ-AAXT-01 | Cervix | cervical & endocervical cancer | Female | <65 | III/IV | Unknown | Unknown | SD |
| CA11 | SNV | Missense_Mutation | c.5N>C | p.Gly2Ala | p.G2A | O75493 | protein_coding | deleterious_low_confidence(0) | benign(0.348) | TCGA-AA-3710-01 | Colorectum | colon adenocarcinoma | Female | >=65 | I/II | Unknown | Unknown | SD | |
| CA11 | SNV | Missense_Mutation | c.851T>C | p.Leu284Pro | p.L284P | O75493 | protein_coding | deleterious(0) | probably_damaging(0.966) | TCGA-AA-3833-01 | Colorectum | colon adenocarcinoma | Female | <65 | I/II | Unknown | Unknown | SD | |
| CA11 | SNV | Missense_Mutation | novel | c.833C>T | p.Ser278Phe | p.S278F | O75493 | protein_coding | deleterious(0.02) | probably_damaging(0.925) | TCGA-AA-A010-01 | Colorectum | colon adenocarcinoma | Female | <65 | I/II | Chemotherapy | folinic | CR |
| Page: 1 2 3 4 5 |
Top |
Related drugs of malignant transformation related genes |
| Identification of chemicals and drugs interact with genes involved in malignant transfromation |
| (DGIdb 4.0) |
| Entrez ID | Symbol | Category | Interaction Types | Drug Claim Name | Drug Name | PMIDs |
| Page: 1 |

Copyright 2023-Present -The University of Texas Health Science Center at Houston |