Schematic overview of the cellular and molecular mechanisms involved in the cancer progression, including the proposed cellular and molecular mechanisms in cancer cells trajectory. AT1: alveolar type 1 cells; AT2: alveolar type 2 cells; AAH: atypical adenomatous hyperplasia; AIS: adenocarcinoma in situ; MIA: minimally invasive adenocarcinoma; IA: invasive adenocarcinoma; EMT: epithelial-mesenchymal transition

Home

Download

Statistics

Help

Contact

Center for Computational Systems Medicine
leaf

Gene summary

leaf

Malignant transformation analysis

leaf

Malignant transformation related pathway analysis

leaf

Cell-cell communication analysis

leaf

Single-cell gene regulatory network inference analysis

leaf

Somatic mutation of malignant transformation related genes

leaf

Related drugs of malignant transformation related genes

Gene: C9orf78

Gene summary for C9ORF78

check button Gene summary.

Gene informationSpeciesHuman
Gene symbol

C9orf78

Gene ID

51759

Gene namechromosome 9 open reading frame 78
Gene AliasCSU2
Cytomap9q34.11
Gene Typeprotein-coding
GO ID

GO:0000375

UniProtAcc

Q9NZ63


Top

Malignant transformation analysis

check button Identification of the aberrant gene expression in precancerous and cancerous lesions by comparing the gene expression of stem-like cells in diseased tissues with normal stem cells
check button Malignant transformation involving gene list.
Entrez IDSymbolReplicatesSpeciesOrganTissueAdj P-valueLog2FCMalignancy
51759C9orf78HTA11_1938_2000001011HumanColorectumAD3.39e-023.13e-01-0.0811
51759C9orf78HTA11_78_2000001011HumanColorectumAD1.42e-033.17e-01-0.1088
51759C9orf78HTA11_347_2000001011HumanColorectumAD3.28e-154.72e-01-0.1954
51759C9orf78HTA11_696_2000001011HumanColorectumAD1.47e-032.08e-01-0.1464
51759C9orf78HTA11_866_2000001011HumanColorectumAD4.07e-042.21e-01-0.1001
51759C9orf78HTA11_1391_2000001011HumanColorectumAD1.00e-023.47e-01-0.059
51759C9orf78HTA11_7862_2000001011HumanColorectumAD8.34e-033.20e-01-0.0179
51759C9orf78HTA11_866_3004761011HumanColorectumAD4.77e-033.07e-010.096
51759C9orf78HTA11_7696_3000711011HumanColorectumAD1.85e-082.86e-010.0674
51759C9orf78HTA11_99999970781_79442HumanColorectumMSS1.54e-062.91e-010.294
51759C9orf78HTA11_99999965062_69753HumanColorectumMSI-H4.54e-061.25e+000.3487
51759C9orf78HTA11_99999965104_69814HumanColorectumMSS1.80e-177.26e-010.281
51759C9orf78HTA11_99999971662_82457HumanColorectumMSS2.66e-265.99e-010.3859
51759C9orf78HTA11_99999974143_84620HumanColorectumMSS4.68e-062.39e-010.3005
51759C9orf78LZE4THumanEsophagusESCC3.28e-177.12e-010.0811
51759C9orf78LZE5THumanEsophagusESCC1.32e-032.17e-010.0514
51759C9orf78LZE7THumanEsophagusESCC3.33e-119.88e-010.0667
51759C9orf78LZE8THumanEsophagusESCC8.94e-061.67e-010.067
51759C9orf78LZE20THumanEsophagusESCC1.81e-086.15e-010.0662
51759C9orf78LZE24THumanEsophagusESCC4.99e-238.24e-010.0596
Page: 1 2 3 4 5 6 7 

check button Transcriptomic changes along malignancy continuum.
TissueExpression DynamicsAbbreviation
Colorectum (GSE201348)The image shows the transcriptomic changes along malignancy continuum.log2FC in expression of this searched gene in stem-like cells from each diseased tissue sample relative to stem-like cells in normal samples in each tissue plotted against the malignancy continuum. Samples are colored based on if they are from different disease stage.FAP: Familial adenomatous polyposis
CRC: Colorectal cancer
Colorectum (HTA11)The image shows the transcriptomic changes along malignancy continuum.log2FC in expression of this searched gene in stem-like cells from each diseased tissue sample relative to stem-like cells in normal samples in each tissue plotted against the malignancy continuum. Samples are colored based on if they are from different disease stage.AD: Adenomas
SER: Sessile serrated lesions
MSI-H: Microsatellite-high colorectal cancer
MSS: Microsatellite stable colorectal cancer
EsophagusThe image shows the transcriptomic changes along malignancy continuum.log2FC in expression of this searched gene in stem-like cells from each diseased tissue sample relative to stem-like cells in normal samples in each tissue plotted against the malignancy continuum. Samples are colored based on if they are from different disease stage.
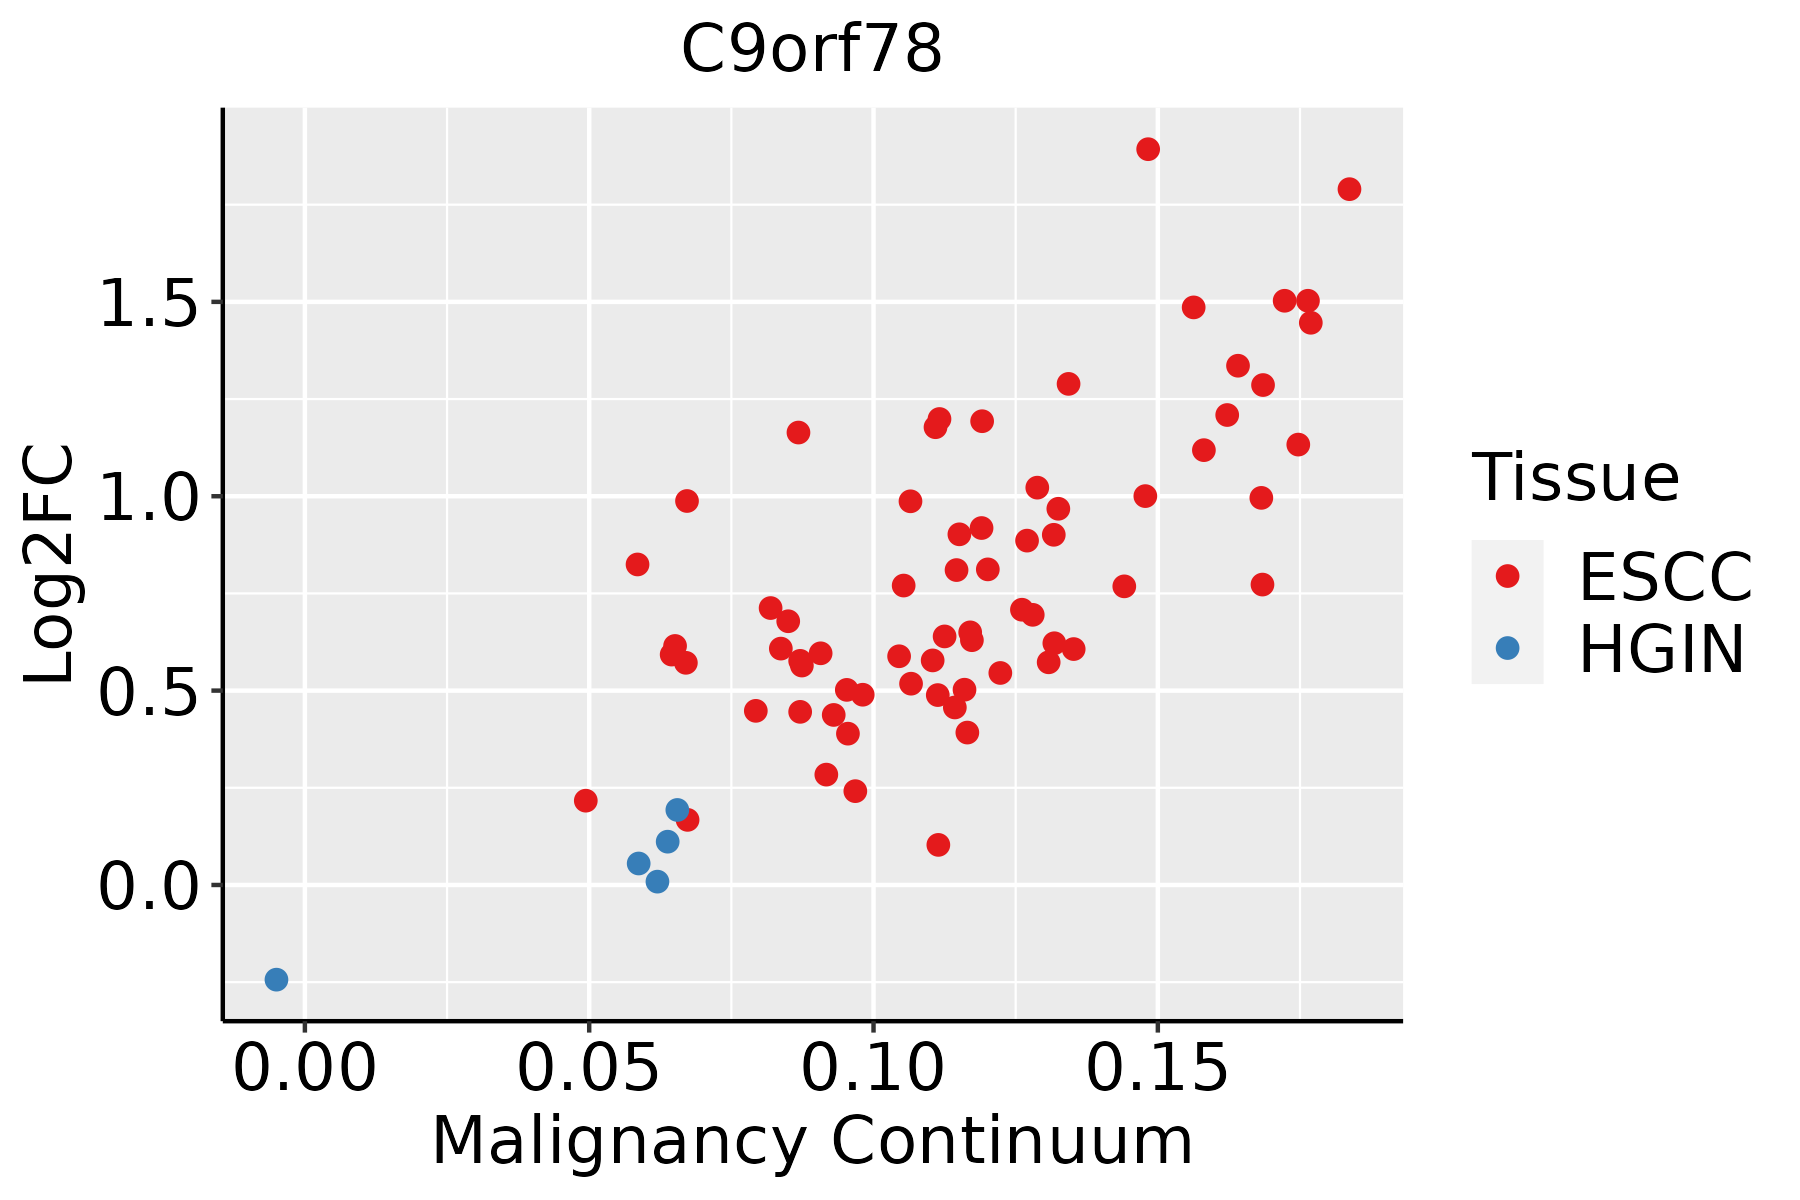
ESCC: Esophageal squamous cell carcinoma
HGIN: High-grade intraepithelial neoplasias
LGIN: Low-grade intraepithelial neoplasias
LiverThe image shows the transcriptomic changes along malignancy continuum.log2FC in expression of this searched gene in stem-like cells from each diseased tissue sample relative to stem-like cells in normal samples in each tissue plotted against the malignancy continuum. Samples are colored based on if they are from different disease stage.
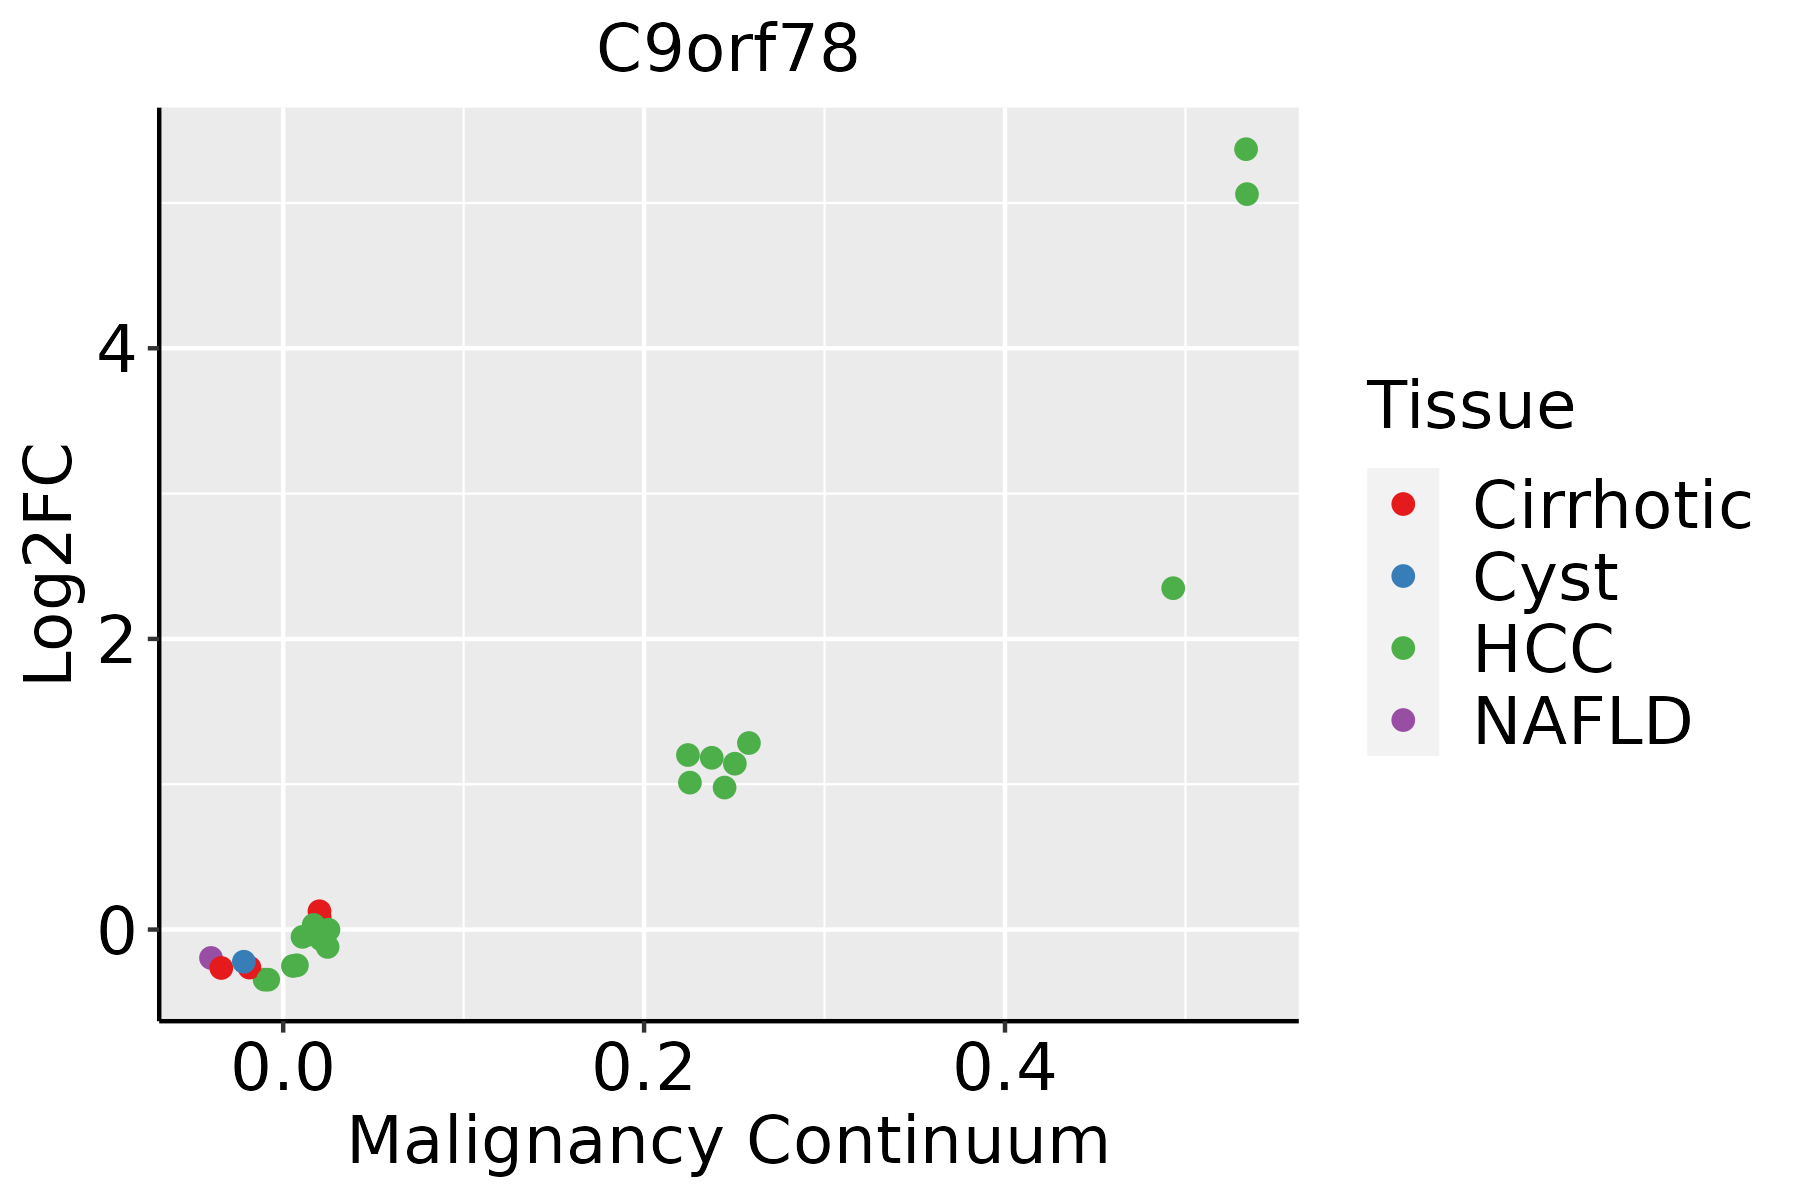
HCC: Hepatocellular carcinoma
NAFLD: Non-alcoholic fatty liver disease
Oral CavityThe image shows the transcriptomic changes along malignancy continuum.log2FC in expression of this searched gene in stem-like cells from each diseased tissue sample relative to stem-like cells in normal samples in each tissue plotted against the malignancy continuum. Samples are colored based on if they are from different disease stage.
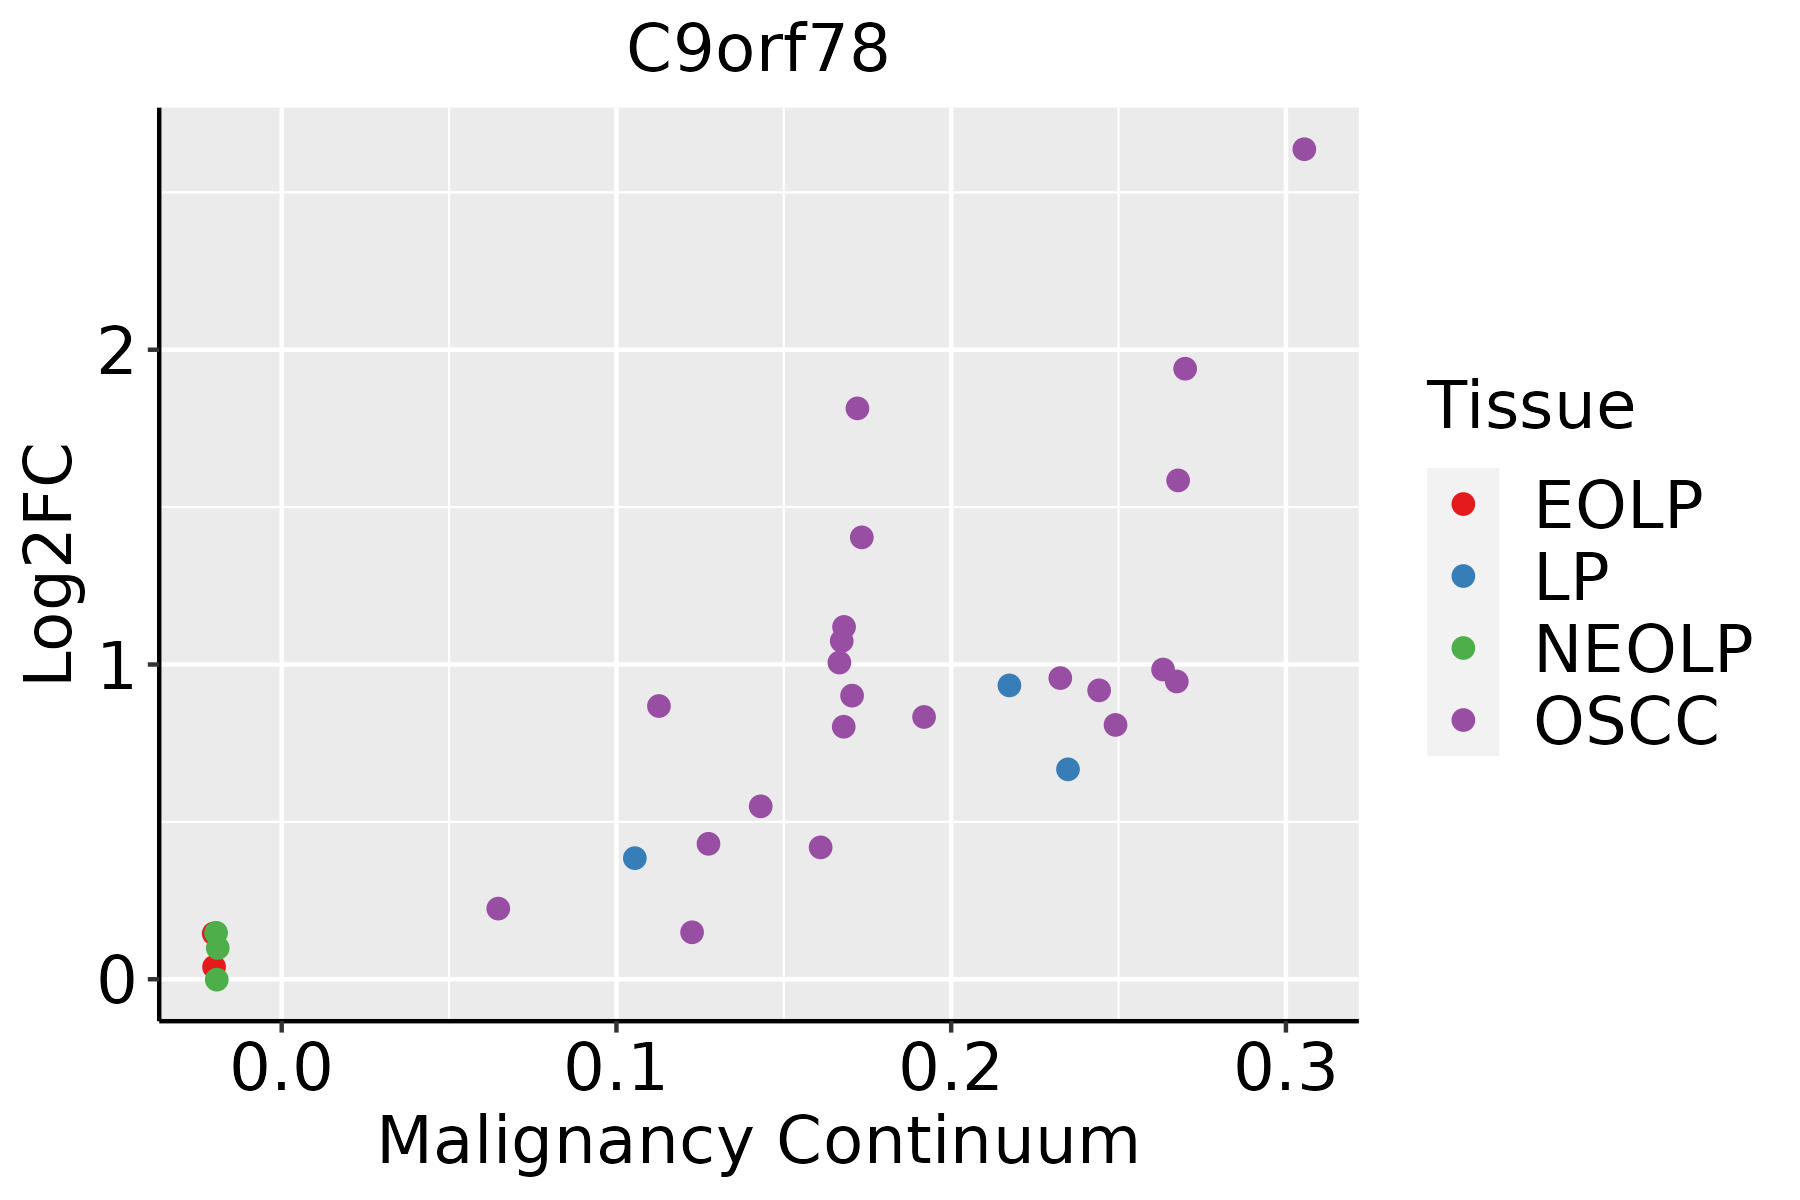
EOLP: Erosive Oral lichen planus
LP: leukoplakia
NEOLP: Non-erosive oral lichen planus
OSCC: Oral squamous cell carcinoma
ProstateThe image shows the transcriptomic changes along malignancy continuum.log2FC in expression of this searched gene in stem-like cells from each diseased tissue sample relative to stem-like cells in normal samples in each tissue plotted against the malignancy continuum. Samples are colored based on if they are from different disease stage.
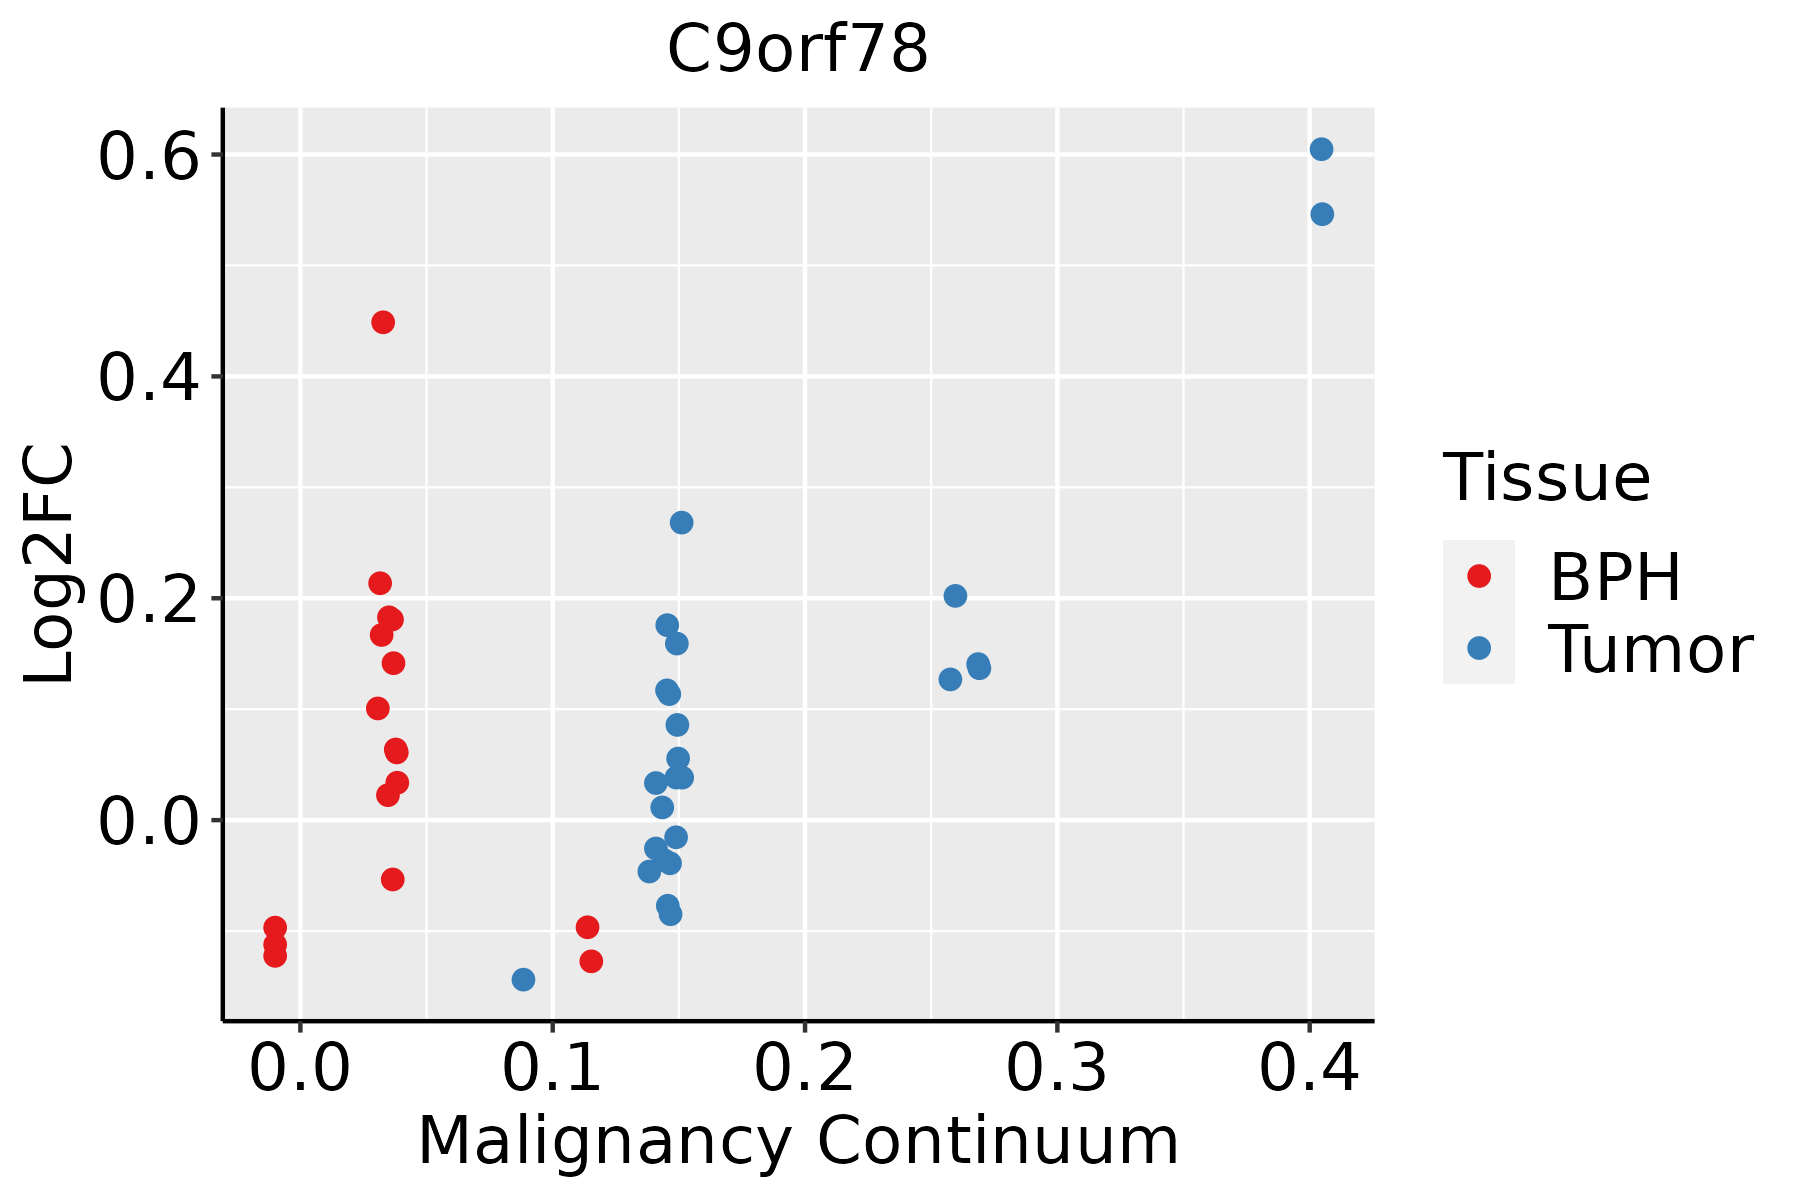
BPH: Benign Prostatic Hyperplasia
SkinThe image shows the transcriptomic changes along malignancy continuum.log2FC in expression of this searched gene in stem-like cells from each diseased tissue sample relative to stem-like cells in normal samples in each tissue plotted against the malignancy continuum. Samples are colored based on if they are from different disease stage.
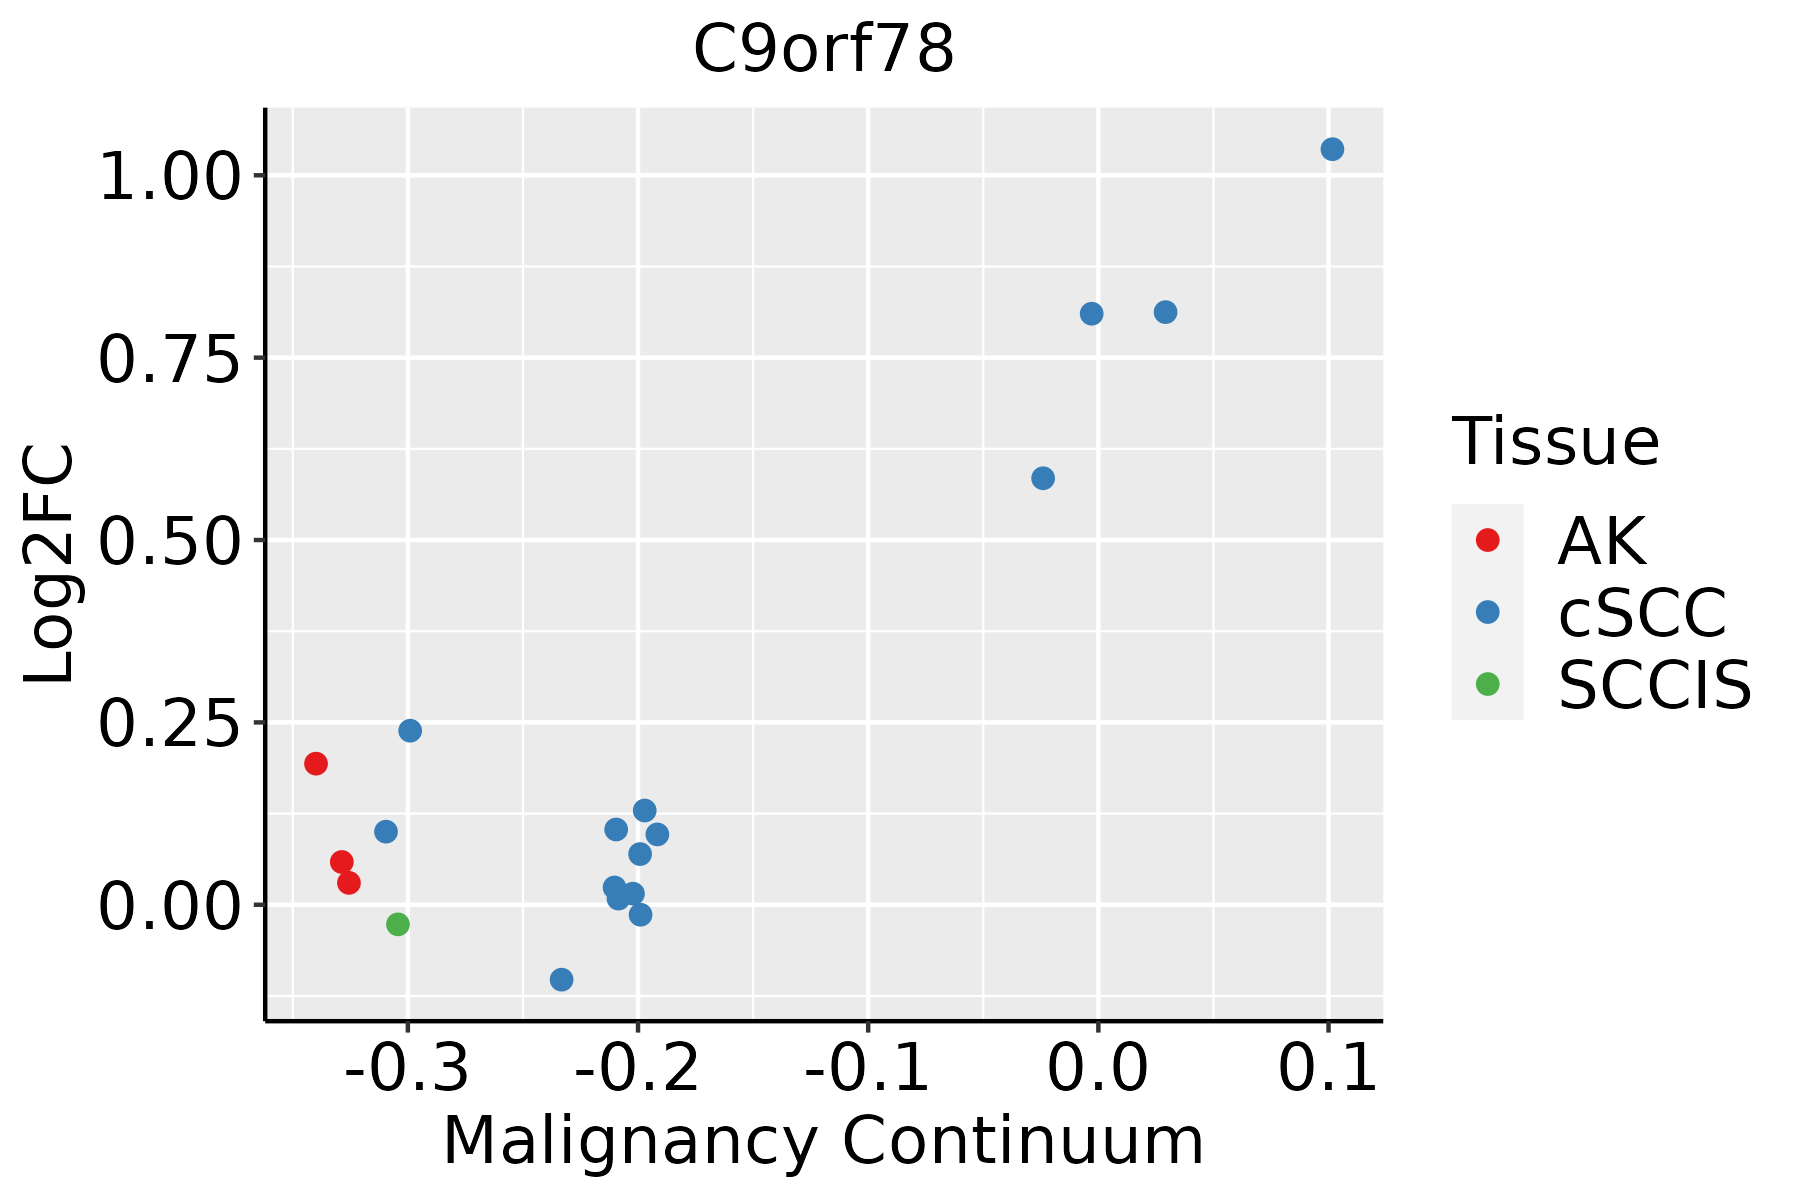
AK: Actinic keratosis
cSCC: Cutaneous squamous cell carcinoma
SCCIS:squamous cell carcinoma in situ
ThyroidThe image shows the transcriptomic changes along malignancy continuum.log2FC in expression of this searched gene in stem-like cells from each diseased tissue sample relative to stem-like cells in normal samples in each tissue plotted against the malignancy continuum. Samples are colored based on if they are from different disease stage.
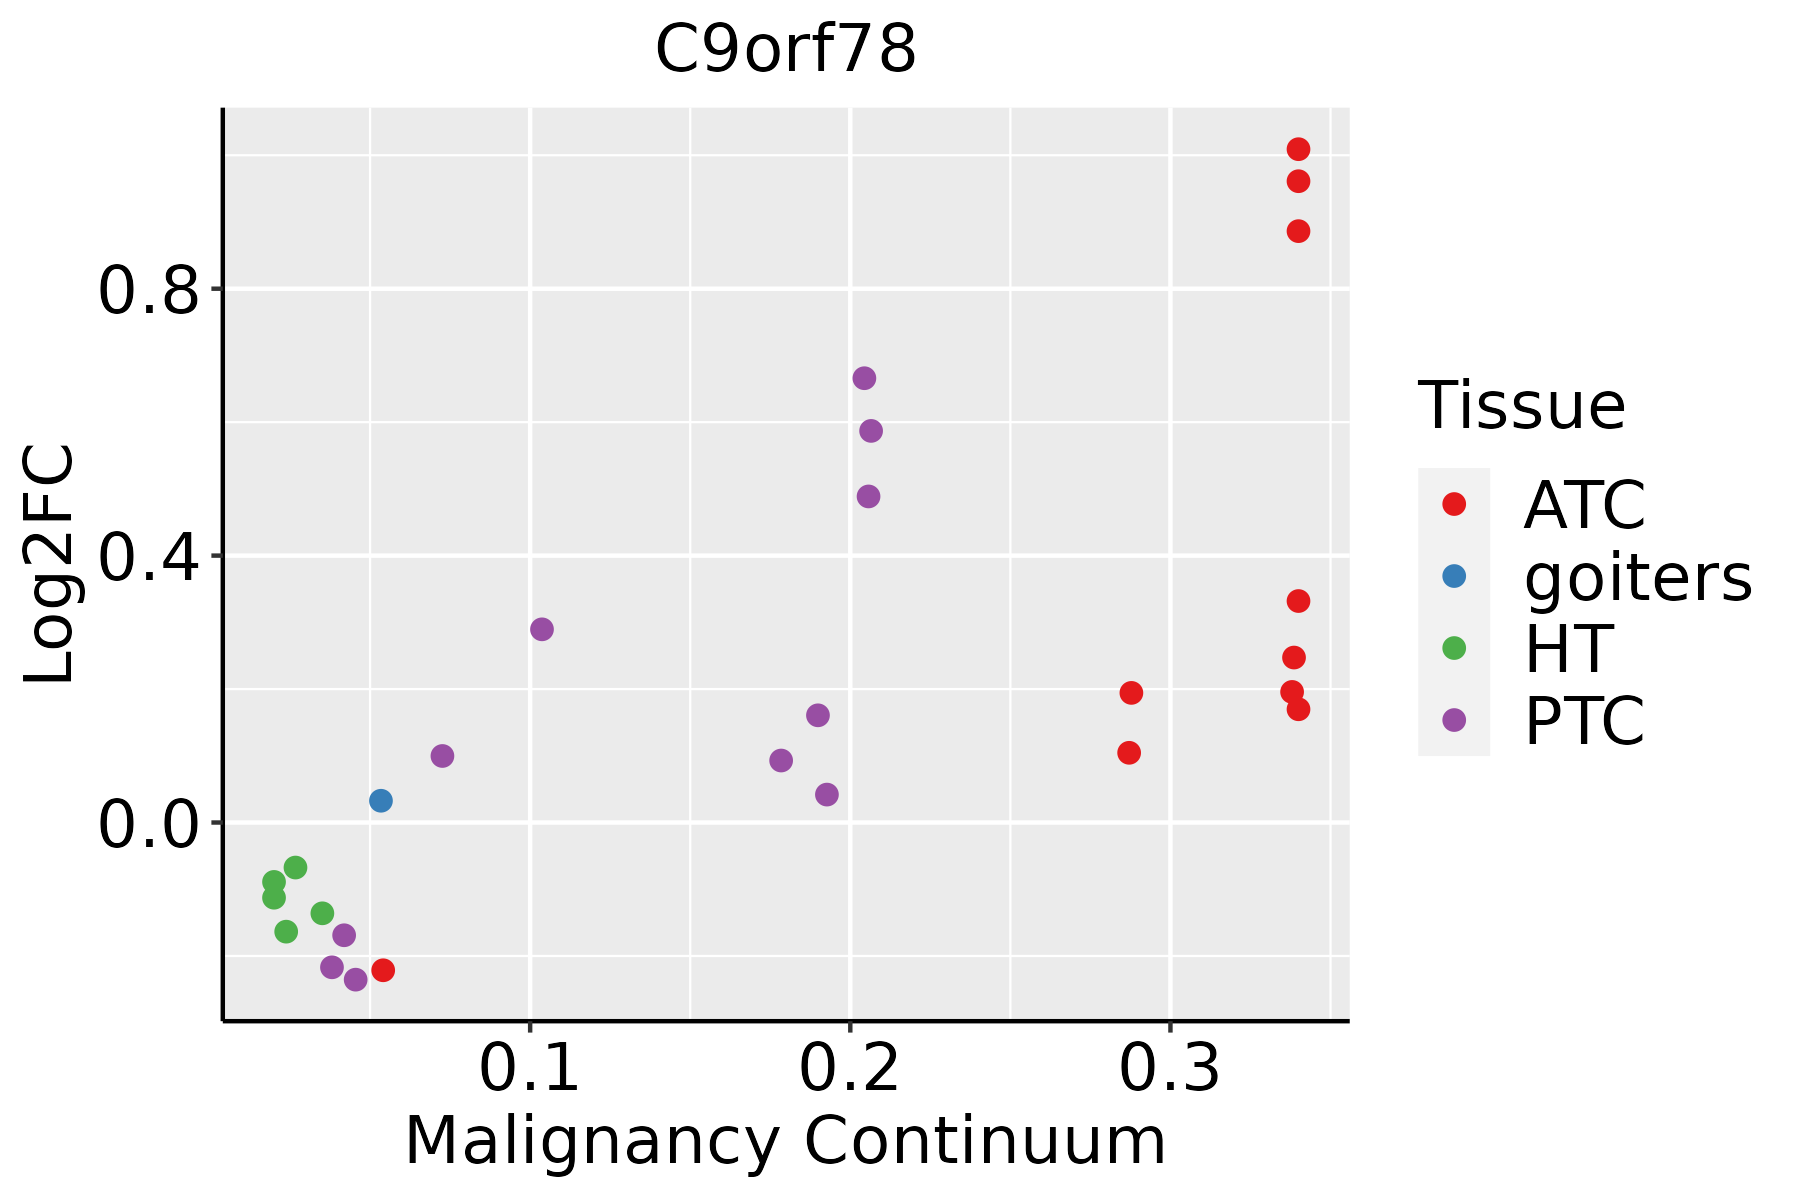
ATC: Anaplastic thyroid cancer
HT: Hashimoto's thyroiditis
PTC: Papillary thyroid cancer
∗log2FC in expression of this searched gene in stem-like cells from each diseased tissue sample relative to stem-like cells in normal samples in each tissue plotted against the malignancy continuum. Samples are colored based on if they are from different disease stage.

Top

Malignant transformation related pathway analysis

check buttonFind out the enriched GO biological processes and KEGG pathways involved in transition from healthy to precancer to cancer
check button Figure of enriched GO biological processes.
TissueDisease StageEnriched GO biological Processes
ColorectumADGO analysis - Figure of enriched GO biological processes: Top 15 enriched GO BP terms are showed in the bar plot of each disease state in each tissue. Each row represents a significant GO biological process which is colored according to the -log10(p.adjust).
ColorectumSERGO analysis - Figure of enriched GO biological processes: Top 15 enriched GO BP terms are showed in the bar plot of each disease state in each tissue. Each row represents a significant GO biological process which is colored according to the -log10(p.adjust).
ColorectumMSSGO analysis - Figure of enriched GO biological processes: Top 15 enriched GO BP terms are showed in the bar plot of each disease state in each tissue. Each row represents a significant GO biological process which is colored according to the -log10(p.adjust).
ColorectumMSI-HGO analysis - Figure of enriched GO biological processes: Top 15 enriched GO BP terms are showed in the bar plot of each disease state in each tissue. Each row represents a significant GO biological process which is colored according to the -log10(p.adjust).
ColorectumFAPGO analysis - Figure of enriched GO biological processes: Top 15 enriched GO BP terms are showed in the bar plot of each disease state in each tissue. Each row represents a significant GO biological process which is colored according to the -log10(p.adjust).
∗Top 15 enriched GO BP terms are showed in the bar plot of each disease state in each tissue. Each row represents a significant GO biological process which is colored according to the -log10(p.adjust).
Page: 1 2 3 4 5 6 7 8 9 

check button Enriched GO biological processes.
GO IDTissueDisease StageDescriptionGene RatioBg Ratiopvaluep.adjustCount
GO:0008380ColorectumADRNA splicing169/3918434/187233.59e-182.04e-15169
GO:0000377ColorectumADRNA splicing, via transesterification reactions with bulged adenosine as nucleophile130/3918320/187235.88e-162.16e-13130
GO:0000398ColorectumADmRNA splicing, via spliceosome130/3918320/187235.88e-162.16e-13130
GO:0000375ColorectumADRNA splicing, via transesterification reactions131/3918324/187237.11e-162.22e-13131
GO:00083802ColorectumMSSRNA splicing159/3467434/187231.75e-191.22e-16159
GO:00003772ColorectumMSSRNA splicing, via transesterification reactions with bulged adenosine as nucleophile121/3467320/187232.52e-168.27e-14121
GO:00003982ColorectumMSSmRNA splicing, via spliceosome121/3467320/187232.52e-168.27e-14121
GO:00003752ColorectumMSSRNA splicing, via transesterification reactions122/3467324/187232.75e-168.58e-14122
GO:00083803ColorectumMSI-HRNA splicing82/1319434/187231.22e-164.53e-1482
GO:00003753ColorectumMSI-HRNA splicing, via transesterification reactions67/1319324/187237.99e-162.61e-1367
GO:00003773ColorectumMSI-HRNA splicing, via transesterification reactions with bulged adenosine as nucleophile66/1319320/187231.51e-154.41e-1366
GO:00003983ColorectumMSI-HmRNA splicing, via spliceosome66/1319320/187231.51e-154.41e-1366
GO:0008380111EsophagusESCCRNA splicing336/8552434/187231.74e-423.67e-39336
GO:0000375111EsophagusESCCRNA splicing, via transesterification reactions248/8552324/187233.05e-301.49e-27248
GO:0000377111EsophagusESCCRNA splicing, via transesterification reactions with bulged adenosine as nucleophile244/8552320/187232.52e-291.07e-26244
GO:0000398111EsophagusESCCmRNA splicing, via spliceosome244/8552320/187232.52e-291.07e-26244
GO:000838012LiverCirrhoticRNA splicing229/4634434/187239.13e-372.86e-33229
GO:000037512LiverCirrhoticRNA splicing, via transesterification reactions175/4634324/187235.95e-307.47e-27175
GO:000037712LiverCirrhoticRNA splicing, via transesterification reactions with bulged adenosine as nucleophile172/4634320/187234.02e-293.60e-26172
GO:000039812LiverCirrhoticmRNA splicing, via spliceosome172/4634320/187234.02e-293.60e-26172
Page: 1 2 3 

check button Enriched KEGG pathways.
Pathway IDTissueDisease StageDescriptionGene RatioBg Ratiopvaluep.adjustqvalueCount
Page: 1 

Top

Cell-cell communication analysis

check buttonIdentification of potential cell-cell interactions between two cell types and their ligand-receptor pairs for different disease states
LigandReceptorLRpairPathwayTissueDisease Stage
Page: 1 

Top

Single-cell gene regulatory network inference analysis

check buttonFind out the significant the regulons (TFs) and the target genes of each regulon across cell types for different disease states
TFCell TypeTissueDisease StageTarget GeneRSSRegulon Activity
∗The dot plots of a searched regulon are shown for all cell subpopulations in each disease state of each tissue based on the regulon specific score inferred using pySCENIC and by calculating the average expression.
Page: 1 

Top

Somatic mutation of malignant transformation related genes

check buttonAnnotation of somatic variants for genes involved in malignant transformation
Hugo SymbolVariant ClassVariant ClassificationdbSNP RSHGVScHGVSpHGVSp ShortSWISSPROTBIOTYPESIFTPolyPhenTumor Sample BarcodeTissueHistologySexAgeStageTherapy TypesDrugsOutcome
C9orf78SNVMissense_Mutationnovelc.855N>Tp.Met285Ilep.M285IQ9NZ63protein_codingtolerated(0.06)benign(0.444)TCGA-AN-A046-01Breastbreast invasive carcinomaFemale>=65I/IIUnknownUnknownSD
C9orf78SNVMissense_Mutationnovelc.94N>Cp.Glu32Glnp.E32QQ9NZ63protein_codingtolerated(0.06)possibly_damaging(0.706)TCGA-BH-A28O-01Breastbreast invasive carcinomaFemale<65III/IVChemotherapycytoxanCR
C9orf78insertionNonsense_Mutationnovelc.704_705insAAATAAAAGCTACTCATAAGGTTAGCTGGGTGCAGTp.Pro235_Ile236insAsnLysSerTyrSerTerGlyTerLeuGlyAlaValp.P235_I236insNKSYS*G*LGAVQ9NZ63protein_codingTCGA-AN-A0FX-01Breastbreast invasive carcinomaFemale<65I/IIUnknownUnknownSD
C9orf78SNVMissense_Mutationc.97G>Ap.Glu33Lysp.E33KQ9NZ63protein_codingdeleterious(0.01)possibly_damaging(0.681)TCGA-C5-A7UH-01Cervixcervical & endocervical cancerFemale<65III/IVChemotherapycisplatinSD
C9orf78SNVMissense_Mutationnovelc.18G>Tp.Lys6Asnp.K6NQ9NZ63protein_codingdeleterious(0.03)benign(0.066)TCGA-C5-A7UH-01Cervixcervical & endocervical cancerFemale<65III/IVChemotherapycisplatinSD
C9orf78SNVMissense_Mutationrs139248631c.701N>Tp.Ala234Valp.A234VQ9NZ63protein_codingtolerated(0.09)benign(0.01)TCGA-AA-A02R-01Colorectumcolon adenocarcinomaFemale>=65I/IIUnknownUnknownPD
C9orf78SNVMissense_Mutationnovelc.415N>Ap.Pro139Thrp.P139TQ9NZ63protein_codingtolerated(0.52)benign(0.038)TCGA-AZ-4315-01Colorectumcolon adenocarcinomaMale<65I/IIUnknownUnknownSD
C9orf78SNVMissense_Mutationnovelc.840N>Tp.Glu280Aspp.E280DQ9NZ63protein_codingtolerated(0.24)benign(0.057)TCGA-F5-6814-01Colorectumrectum adenocarcinomaMale<65I/IIUnknownUnknownSD
C9orf78insertionFrame_Shift_Insnovelc.827_828insTp.Tyr277LeufsTer4p.Y277Lfs*4Q9NZ63protein_codingTCGA-AA-3856-01Colorectumcolon adenocarcinomaMale<65I/IIUnknownUnknownSD
C9orf78SNVMissense_Mutationrs758042858c.700N>Ap.Ala234Thrp.A234TQ9NZ63protein_codingtolerated(0.22)benign(0.001)TCGA-AJ-A3OK-01Endometriumuterine corpus endometrioid carcinomaFemale>=65I/IIChemotherapycarboplatinCR
Page: 1 2 3 

Top

Related drugs of malignant transformation related genes

check buttonIdentification of chemicals and drugs interact with genes involved in malignant transfromation
(DGIdb 4.0)
Entrez IDSymbolCategoryInteraction TypesDrug Claim NameDrug NamePMIDs
Page: 1