
|
|||||
|
 | |
| |
| |
| |
| |
| |
|
Gene: C9orf69 |
Gene summary for C9ORF69 |
| Gene information | Species | Human | Gene symbol | C9orf69 | Gene ID | 90120 |
| Gene name | transmembrane protein 250 | |
| Gene Alias | C9orf69 | |
| Cytomap | 9q34.3 | |
| Gene Type | protein-coding | GO ID | GO:0000910 | UniProtAcc | H0YL14 |
Top |
Malignant transformation analysis |
| Identification of the aberrant gene expression in precancerous and cancerous lesions by comparing the gene expression of stem-like cells in diseased tissues with normal stem cells |
| Entrez ID | Symbol | Replicates | Species | Organ | Tissue | Adj P-value | Log2FC | Malignancy |
| 90120 | C9orf69 | P1T-E | Human | Esophagus | ESCC | 1.04e-03 | 2.29e-01 | 0.0875 |
| 90120 | C9orf69 | P2T-E | Human | Esophagus | ESCC | 2.40e-25 | 2.56e-01 | 0.1177 |
| 90120 | C9orf69 | P4T-E | Human | Esophagus | ESCC | 1.81e-05 | 1.33e-01 | 0.1323 |
| 90120 | C9orf69 | P8T-E | Human | Esophagus | ESCC | 1.25e-16 | 2.53e-01 | 0.0889 |
| 90120 | C9orf69 | P9T-E | Human | Esophagus | ESCC | 2.43e-06 | 9.81e-02 | 0.1131 |
| 90120 | C9orf69 | P10T-E | Human | Esophagus | ESCC | 2.54e-06 | 1.06e-01 | 0.116 |
| 90120 | C9orf69 | P11T-E | Human | Esophagus | ESCC | 2.45e-10 | 2.50e-01 | 0.1426 |
| 90120 | C9orf69 | P15T-E | Human | Esophagus | ESCC | 1.49e-09 | 1.33e-01 | 0.1149 |
| 90120 | C9orf69 | P21T-E | Human | Esophagus | ESCC | 5.59e-11 | 2.73e-01 | 0.1617 |
| 90120 | C9orf69 | P22T-E | Human | Esophagus | ESCC | 1.54e-04 | 9.31e-02 | 0.1236 |
| 90120 | C9orf69 | P23T-E | Human | Esophagus | ESCC | 8.68e-11 | 2.05e-01 | 0.108 |
| 90120 | C9orf69 | P24T-E | Human | Esophagus | ESCC | 9.50e-06 | 1.61e-01 | 0.1287 |
| 90120 | C9orf69 | P26T-E | Human | Esophagus | ESCC | 1.05e-04 | 5.80e-02 | 0.1276 |
| 90120 | C9orf69 | P27T-E | Human | Esophagus | ESCC | 4.24e-04 | 7.85e-02 | 0.1055 |
| 90120 | C9orf69 | P28T-E | Human | Esophagus | ESCC | 1.18e-11 | 2.08e-01 | 0.1149 |
| 90120 | C9orf69 | P30T-E | Human | Esophagus | ESCC | 4.48e-15 | 3.96e-01 | 0.137 |
| 90120 | C9orf69 | P31T-E | Human | Esophagus | ESCC | 1.13e-08 | 2.10e-01 | 0.1251 |
| 90120 | C9orf69 | P32T-E | Human | Esophagus | ESCC | 5.10e-08 | 1.80e-01 | 0.1666 |
| 90120 | C9orf69 | P36T-E | Human | Esophagus | ESCC | 1.10e-06 | 2.06e-01 | 0.1187 |
| 90120 | C9orf69 | P37T-E | Human | Esophagus | ESCC | 1.34e-18 | 4.44e-01 | 0.1371 |
| Page: 1 2 3 4 |
| Tissue | Expression Dynamics | Abbreviation |
| Esophagus |  | ESCC: Esophageal squamous cell carcinoma |
| HGIN: High-grade intraepithelial neoplasias | ||
| LGIN: Low-grade intraepithelial neoplasias | ||
| Oral Cavity | 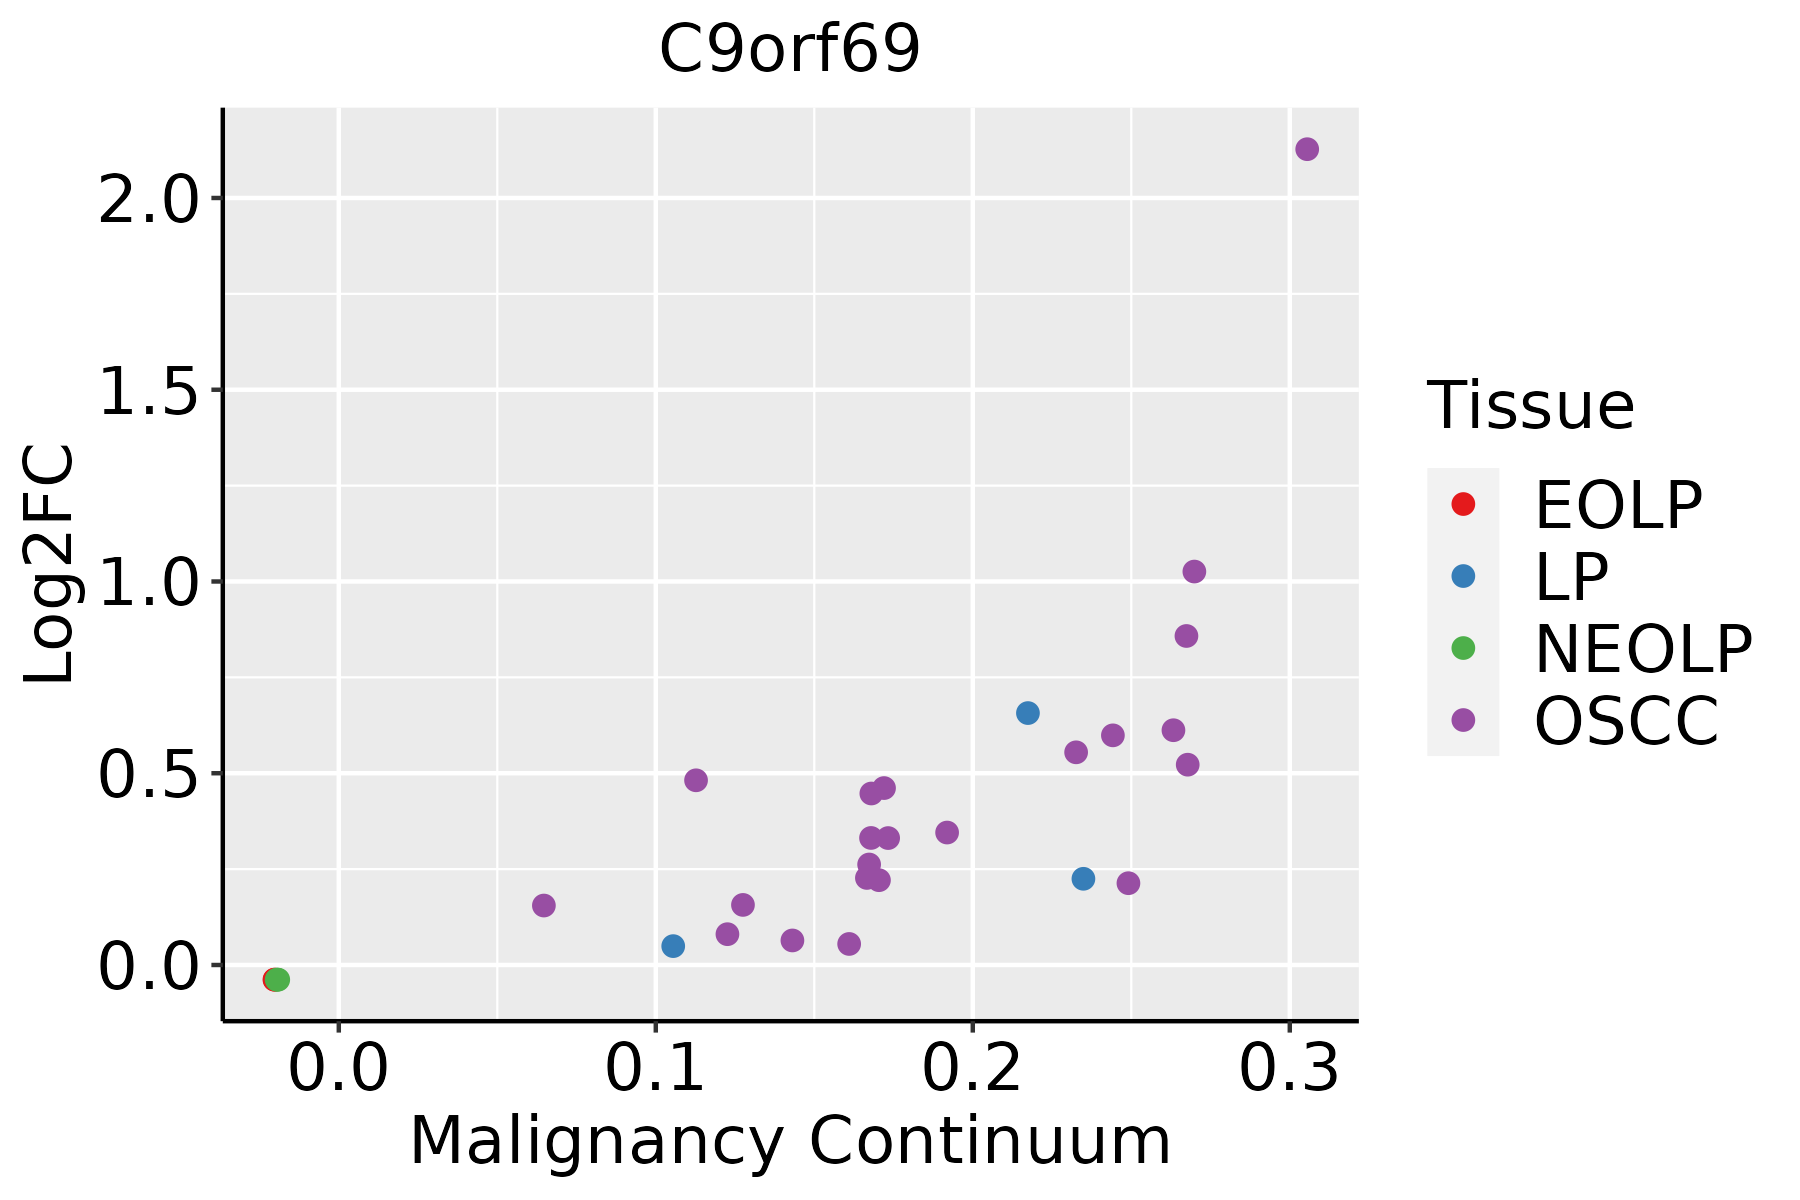 | EOLP: Erosive Oral lichen planus |
| LP: leukoplakia | ||
| NEOLP: Non-erosive oral lichen planus | ||
| OSCC: Oral squamous cell carcinoma | ||
| Skin | 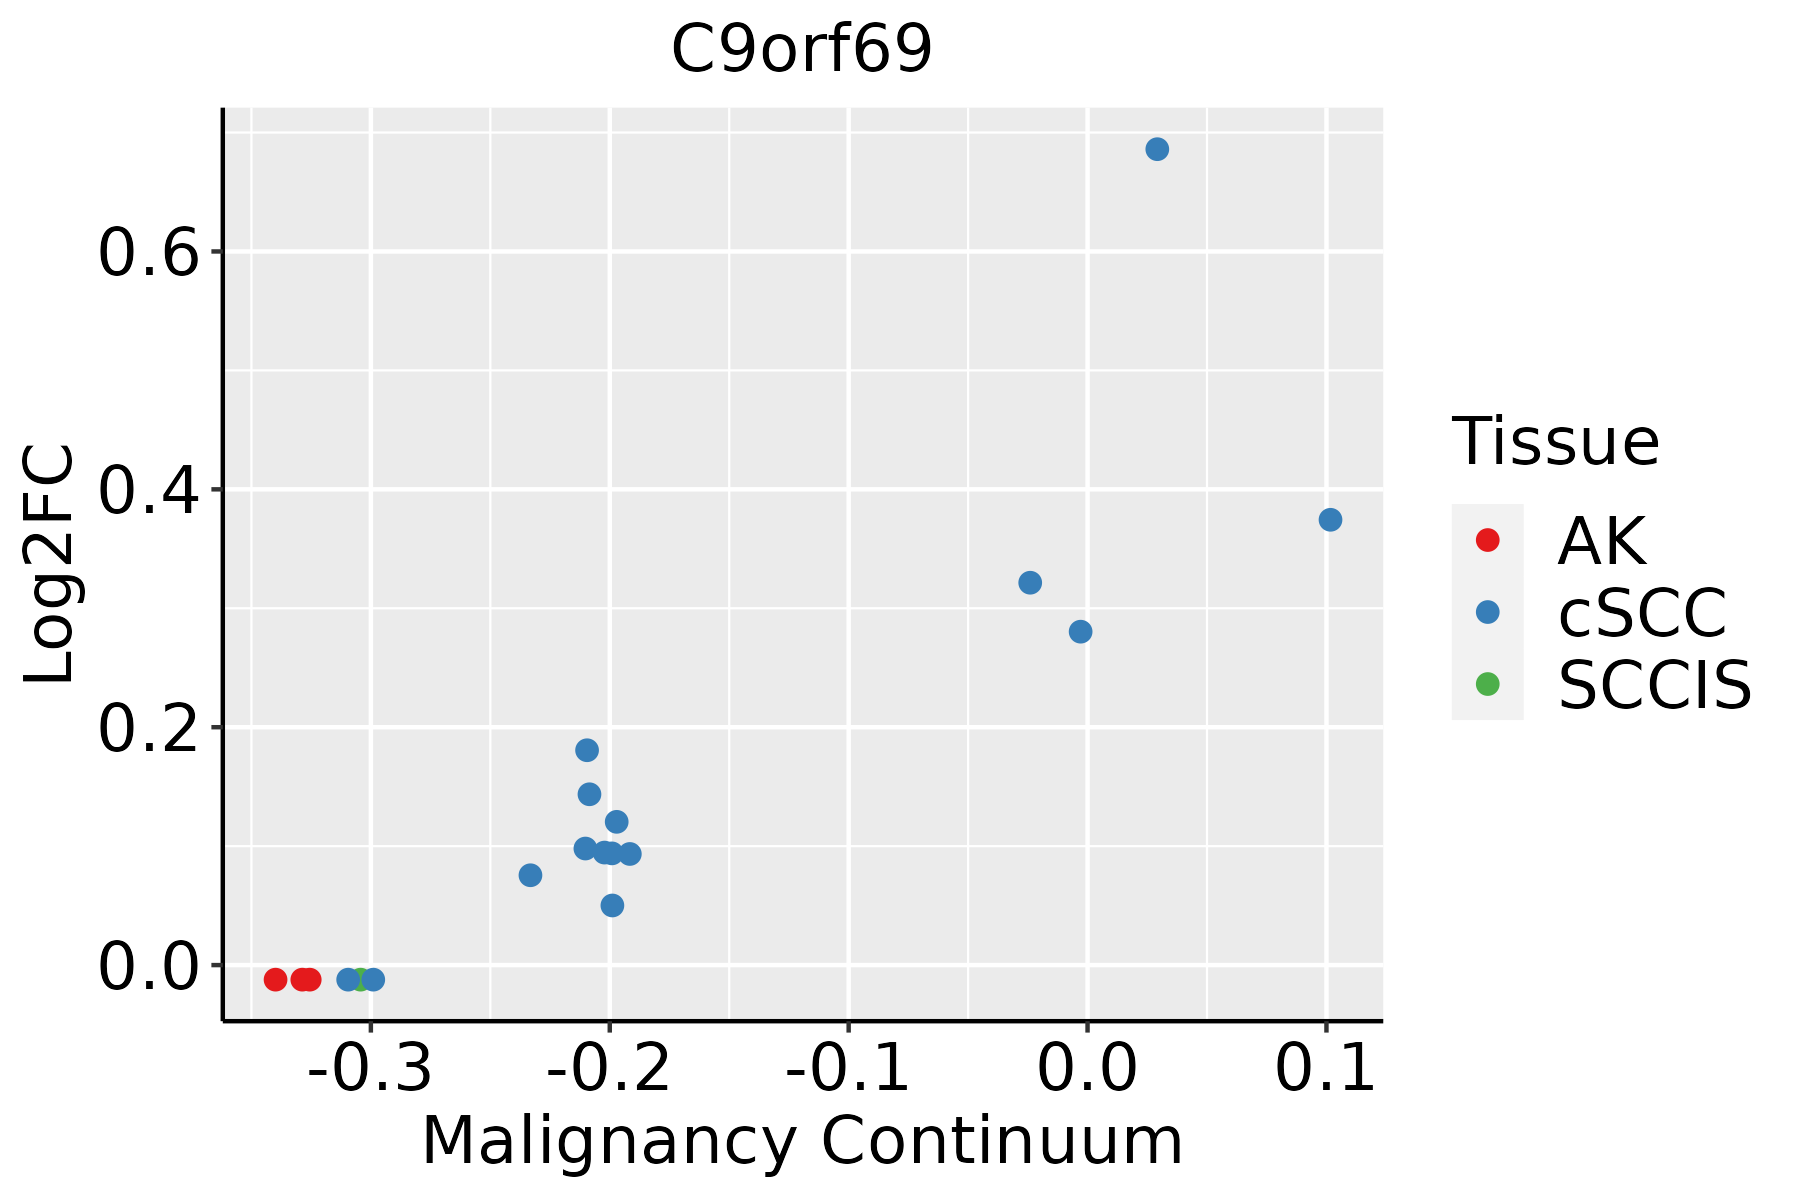 | AK: Actinic keratosis |
| cSCC: Cutaneous squamous cell carcinoma | ||
| SCCIS:squamous cell carcinoma in situ |
| ∗log2FC in expression of this searched gene in stem-like cells from each diseased tissue sample relative to stem-like cells in normal samples in each tissue plotted against the malignancy continuum. Samples are colored based on if they are from different disease stage. |
Top |
Malignant transformation related pathway analysis |
| Find out the enriched GO biological processes and KEGG pathways involved in transition from healthy to precancer to cancer |
| Tissue | Disease Stage | Enriched GO biological Processes |
| Colorectum | AD |  |
| Colorectum | SER |  |
| Colorectum | MSS |  |
| Colorectum | MSI-H |  |
| Colorectum | FAP |  |
| ∗Top 15 enriched GO BP terms are showed in the bar plot of each disease state in each tissue. Each row represents a significant GO biological process which is colored according to the -log10(p.adjust). |
| Page: 1 2 3 4 5 6 7 8 9 |
| GO ID | Tissue | Disease Stage | Description | Gene Ratio | Bg Ratio | pvalue | p.adjust | Count |
| Page: 1 |
| Pathway ID | Tissue | Disease Stage | Description | Gene Ratio | Bg Ratio | pvalue | p.adjust | qvalue | Count |
| Page: 1 |
Top |
Cell-cell communication analysis |
| Identification of potential cell-cell interactions between two cell types and their ligand-receptor pairs for different disease states |
| Ligand | Receptor | LRpair | Pathway | Tissue | Disease Stage |
| Page: 1 |
Top |
Single-cell gene regulatory network inference analysis |
| Find out the significant the regulons (TFs) and the target genes of each regulon across cell types for different disease states |
| TF | Cell Type | Tissue | Disease Stage | Target Gene | RSS | Regulon Activity |
| ∗The dot plots of a searched regulon are shown for all cell subpopulations in each disease state of each tissue based on the regulon specific score inferred using pySCENIC and by calculating the average expression. |
| Page: 1 |
Top |
Somatic mutation of malignant transformation related genes |
| Annotation of somatic variants for genes involved in malignant transformation |
| Hugo Symbol | Variant Class | Variant Classification | dbSNP RS | HGVSc | HGVSp | HGVSp Short | SWISSPROT | BIOTYPE | SIFT | PolyPhen | Tumor Sample Barcode | Tissue | Histology | Sex | Age | Stage | Therapy Types | Drugs | Outcome |
| C9orf69 | SNV | Missense_Mutation | rs776310987 | c.104N>A | p.Arg35His | p.R35H | H0YL14 | protein_coding | deleterious(0.01) | possibly_damaging(0.75) | TCGA-2W-A8YY-01 | Cervix | cervical & endocervical cancer | Female | <65 | I/II | Chemotherapy | cisplatin | CR |
| C9orf69 | SNV | Missense_Mutation | novel | c.275G>A | p.Arg92His | p.R92H | H0YL14 | protein_coding | tolerated(0.22) | benign(0.327) | TCGA-AA-A010-01 | Colorectum | colon adenocarcinoma | Female | <65 | I/II | Chemotherapy | folinic | CR |
| C9orf69 | SNV | Missense_Mutation | rs758876273 | c.154G>A | p.Gly52Ser | p.G52S | H0YL14 | protein_coding | tolerated(0.14) | probably_damaging(0.997) | TCGA-B5-A3FC-01 | Endometrium | uterine corpus endometrioid carcinoma | Female | <65 | I/II | Unknown | Unknown | SD |
| C9orf69 | SNV | Missense_Mutation | novel | c.307N>T | p.Arg103Cys | p.R103C | H0YL14 | protein_coding | tolerated(0.07) | possibly_damaging(0.732) | TCGA-EO-A22U-01 | Endometrium | uterine corpus endometrioid carcinoma | Female | >=65 | I/II | Unknown | Unknown | SD |
| C9orf69 | SNV | Missense_Mutation | rs574533266 | c.163C>T | p.Arg55Cys | p.R55C | H0YL14 | protein_coding | deleterious(0.03) | benign(0.003) | TCGA-33-AASJ-01 | Lung | lung squamous cell carcinoma | Male | <65 | I/II | Unknown | Unknown | PD |
| C9orf69 | SNV | Missense_Mutation | novel | c.139N>T | p.Thr47Ser | p.T47S | H0YL14 | protein_coding | tolerated(0.87) | benign(0.021) | TCGA-68-7757-01 | Lung | lung squamous cell carcinoma | Male | >=65 | I/II | Unknown | Unknown | SD |
| C9orf69 | SNV | Missense_Mutation | c.187N>G | p.Ser63Gly | p.S63G | H0YL14 | protein_coding | tolerated(0.24) | probably_damaging(0.962) | TCGA-BR-4368-01 | Stomach | stomach adenocarcinoma | Female | >=65 | III/IV | Unknown | Unknown | SD | |
| C9orf69 | SNV | Missense_Mutation | c.295N>A | p.Leu99Met | p.L99M | H0YL14 | protein_coding | tolerated(0.07) | probably_damaging(0.994) | TCGA-HU-A4GT-01 | Stomach | stomach adenocarcinoma | Female | >=65 | I/II | Chemotherapy | copolang | SD | |
| C9orf69 | SNV | Missense_Mutation | novel | c.166N>C | p.Phe56Leu | p.F56L | H0YL14 | protein_coding | tolerated(0.31) | probably_damaging(0.962) | TCGA-VQ-A91E-01 | Stomach | stomach adenocarcinoma | Female | >=65 | III/IV | Chemotherapy | fluorouracil | CR |
| Page: 1 |
Top |
Related drugs of malignant transformation related genes |
| Identification of chemicals and drugs interact with genes involved in malignant transfromation |
| (DGIdb 4.0) |
| Entrez ID | Symbol | Category | Interaction Types | Drug Claim Name | Drug Name | PMIDs |
| Page: 1 |

Copyright 2023-Present -The University of Texas Health Science Center at Houston |