
|
|||||
|
 | |
| |
| |
| |
| |
| |
|
Gene: C9orf64 |
Gene summary for C9ORF64 |
| Gene information | Species | Human | Gene symbol | C9orf64 | Gene ID | 84267 |
| Gene name | chromosome 9 open reading frame 64 | |
| Gene Alias | C9orf64 | |
| Cytomap | 9q21.32 | |
| Gene Type | protein-coding | GO ID | GO:0006139 | UniProtAcc | Q5T6V5 |
Top |
Malignant transformation analysis |
| Identification of the aberrant gene expression in precancerous and cancerous lesions by comparing the gene expression of stem-like cells in diseased tissues with normal stem cells |
| Entrez ID | Symbol | Replicates | Species | Organ | Tissue | Adj P-value | Log2FC | Malignancy |
| 84267 | C9orf64 | HCC1_Meng | Human | Liver | HCC | 4.61e-27 | 5.55e-02 | 0.0246 |
| 84267 | C9orf64 | HCC2_Meng | Human | Liver | HCC | 8.09e-04 | 4.05e-02 | 0.0107 |
| 84267 | C9orf64 | HCC1 | Human | Liver | HCC | 7.48e-06 | 1.22e+00 | 0.5336 |
| 84267 | C9orf64 | HCC2 | Human | Liver | HCC | 1.82e-11 | 1.24e+00 | 0.5341 |
| 84267 | C9orf64 | S014 | Human | Liver | HCC | 9.80e-09 | 2.72e-01 | 0.2254 |
| 84267 | C9orf64 | S015 | Human | Liver | HCC | 1.66e-06 | 3.24e-01 | 0.2375 |
| 84267 | C9orf64 | S016 | Human | Liver | HCC | 4.67e-06 | 2.46e-01 | 0.2243 |
| 84267 | C9orf64 | S027 | Human | Liver | HCC | 2.83e-03 | 3.60e-01 | 0.2446 |
| 84267 | C9orf64 | S028 | Human | Liver | HCC | 1.40e-04 | 2.59e-01 | 0.2503 |
| 84267 | C9orf64 | S029 | Human | Liver | HCC | 8.33e-03 | 2.01e-01 | 0.2581 |
| 84267 | C9orf64 | C04 | Human | Oral cavity | OSCC | 3.66e-05 | 2.15e-01 | 0.2633 |
| 84267 | C9orf64 | C21 | Human | Oral cavity | OSCC | 2.19e-09 | 3.28e-01 | 0.2678 |
| 84267 | C9orf64 | C30 | Human | Oral cavity | OSCC | 7.23e-18 | 7.28e-01 | 0.3055 |
| 84267 | C9orf64 | C43 | Human | Oral cavity | OSCC | 1.71e-07 | 1.57e-01 | 0.1704 |
| 84267 | C9orf64 | C46 | Human | Oral cavity | OSCC | 5.40e-08 | 2.15e-01 | 0.1673 |
| 84267 | C9orf64 | C06 | Human | Oral cavity | OSCC | 1.75e-06 | 8.05e-01 | 0.2699 |
| 84267 | C9orf64 | C08 | Human | Oral cavity | OSCC | 5.80e-06 | 6.95e-02 | 0.1919 |
| 84267 | C9orf64 | SYSMH1 | Human | Oral cavity | OSCC | 1.10e-06 | 9.78e-02 | 0.1127 |
| 84267 | C9orf64 | SYSMH3 | Human | Oral cavity | OSCC | 1.83e-04 | 1.30e-01 | 0.2442 |
| 84267 | C9orf64 | SYSMH6 | Human | Oral cavity | OSCC | 1.34e-02 | 5.80e-02 | 0.1275 |
| Page: 1 |
| Tissue | Expression Dynamics | Abbreviation |
| Liver | 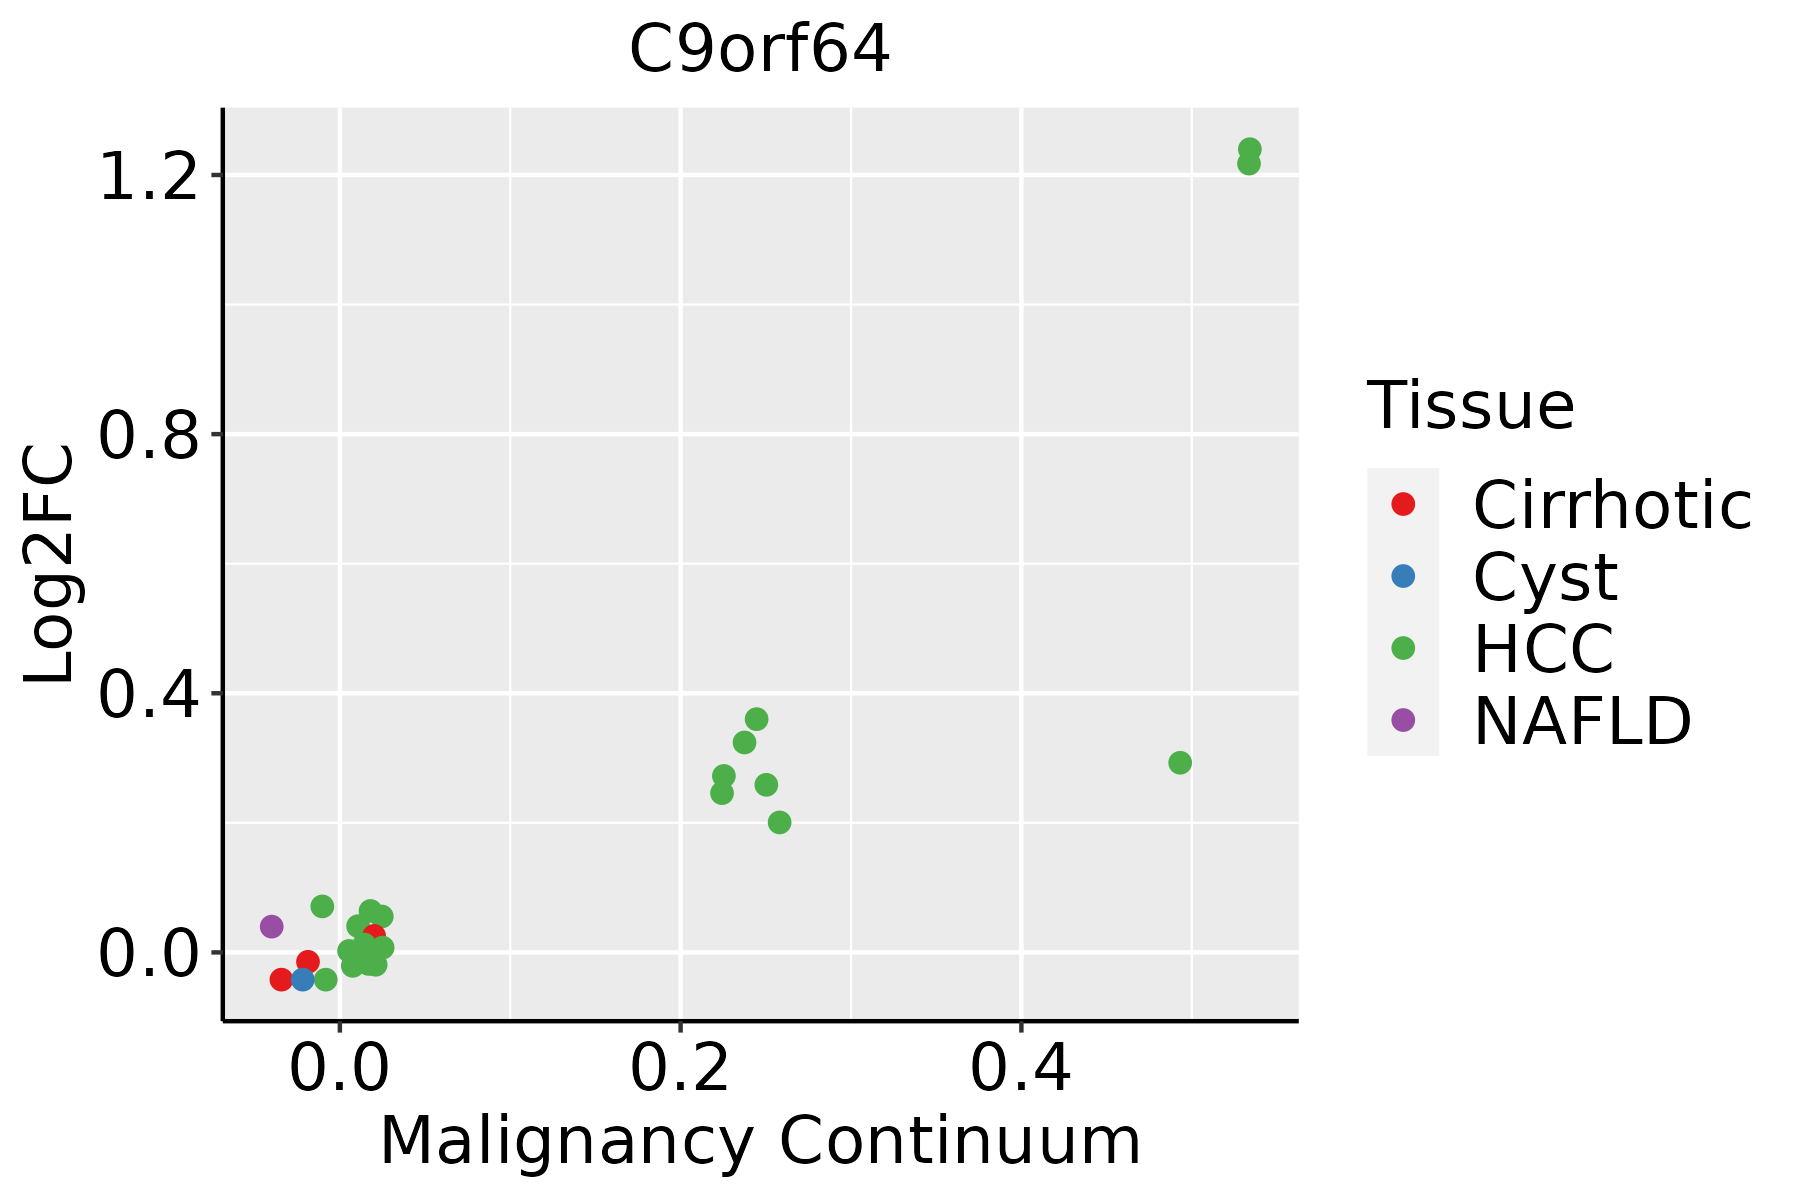 | HCC: Hepatocellular carcinoma |
| NAFLD: Non-alcoholic fatty liver disease | ||
| Oral Cavity | 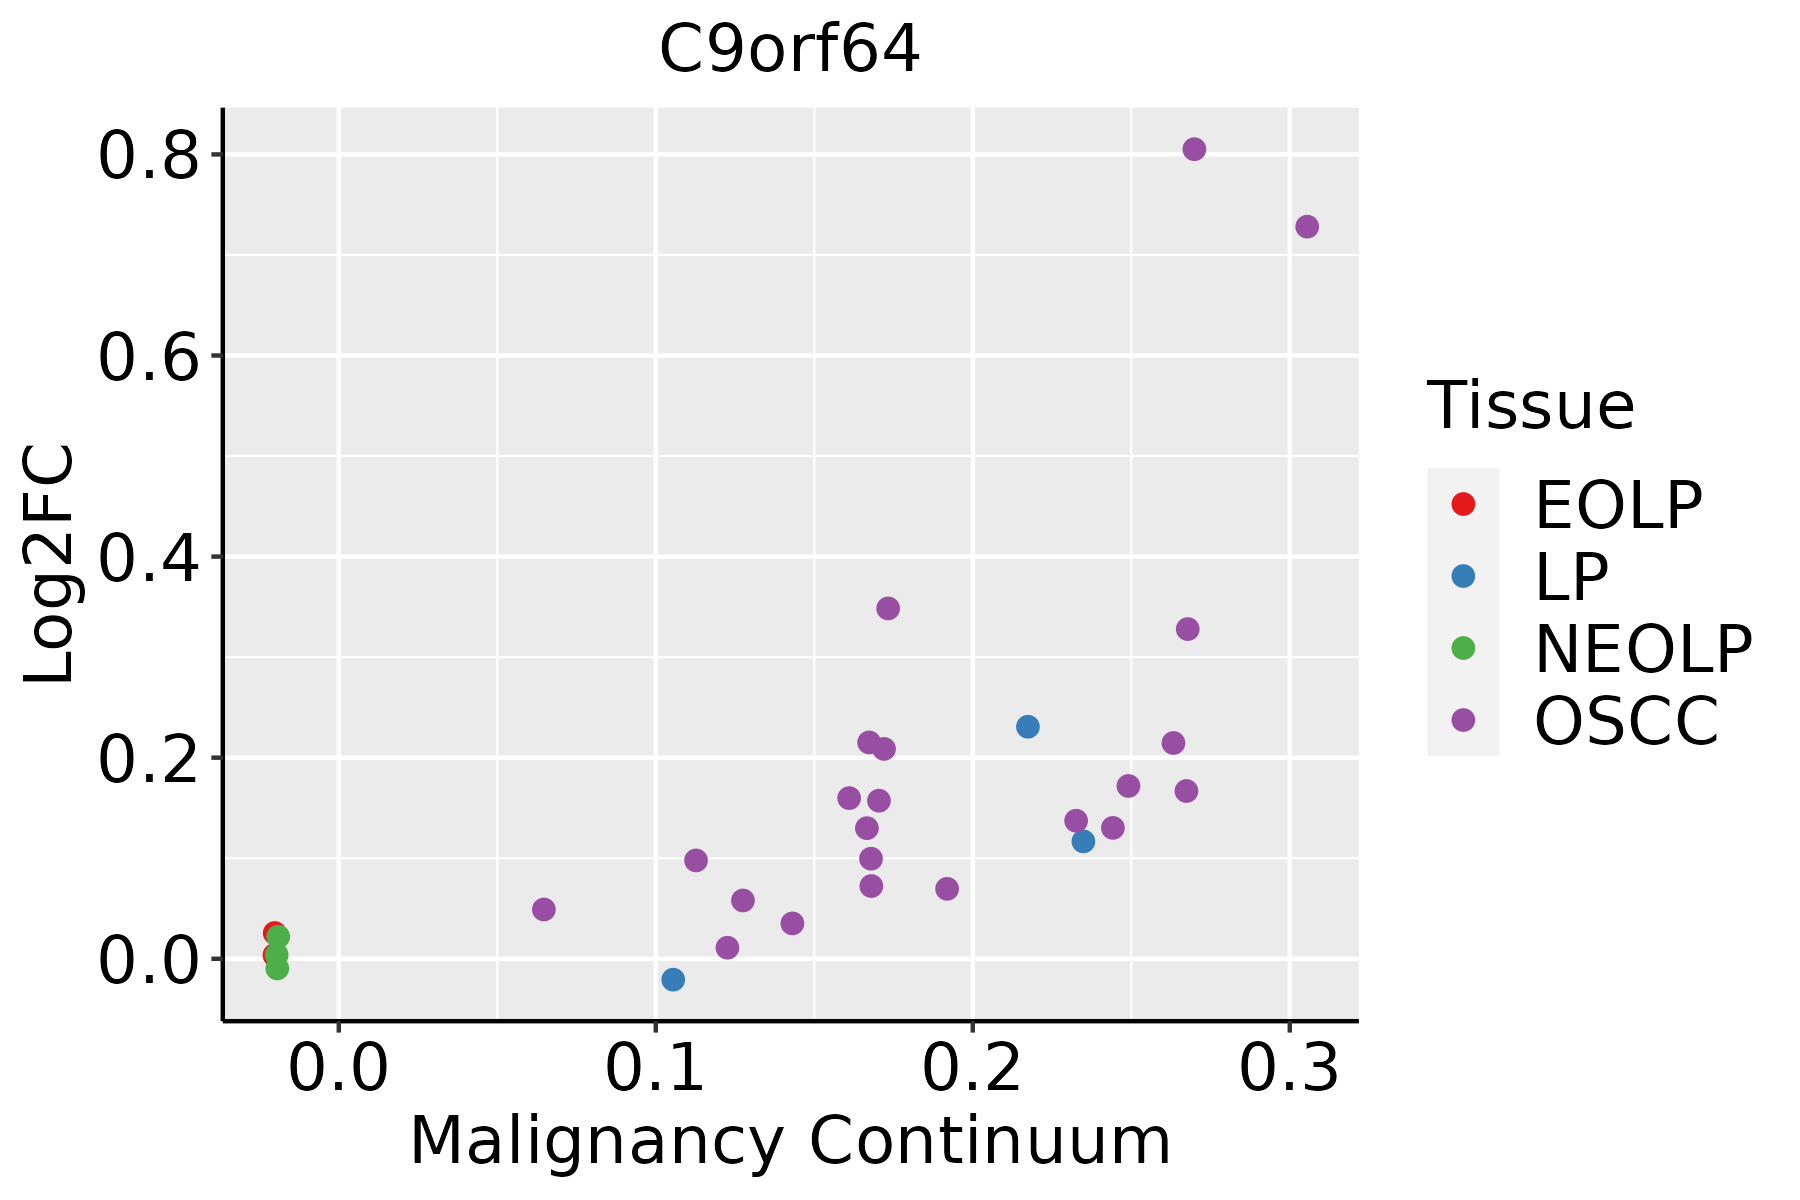 | EOLP: Erosive Oral lichen planus |
| LP: leukoplakia | ||
| NEOLP: Non-erosive oral lichen planus | ||
| OSCC: Oral squamous cell carcinoma |
| ∗log2FC in expression of this searched gene in stem-like cells from each diseased tissue sample relative to stem-like cells in normal samples in each tissue plotted against the malignancy continuum. Samples are colored based on if they are from different disease stage. |
Top |
Malignant transformation related pathway analysis |
| Find out the enriched GO biological processes and KEGG pathways involved in transition from healthy to precancer to cancer |
| Tissue | Disease Stage | Enriched GO biological Processes |
| Colorectum | AD |  |
| Colorectum | SER |  |
| Colorectum | MSS |  |
| Colorectum | MSI-H |  |
| Colorectum | FAP |  |
| ∗Top 15 enriched GO BP terms are showed in the bar plot of each disease state in each tissue. Each row represents a significant GO biological process which is colored according to the -log10(p.adjust). |
| Page: 1 2 3 4 5 6 7 8 9 |
| GO ID | Tissue | Disease Stage | Description | Gene Ratio | Bg Ratio | pvalue | p.adjust | Count |
| GO:00344702 | Liver | HCC | ncRNA processing | 293/7958 | 395/18723 | 4.26e-38 | 6.76e-35 | 293 |
| GO:00346601 | Liver | HCC | ncRNA metabolic process | 332/7958 | 485/18723 | 1.48e-31 | 7.80e-29 | 332 |
| GO:0008033 | Liver | HCC | tRNA processing | 87/7958 | 127/18723 | 2.66e-09 | 7.23e-08 | 87 |
| GO:0006399 | Liver | HCC | tRNA metabolic process | 108/7958 | 179/18723 | 1.07e-06 | 1.59e-05 | 108 |
| GO:0009451 | Liver | HCC | RNA modification | 101/7958 | 167/18723 | 2.02e-06 | 2.78e-05 | 101 |
| GO:0006400 | Liver | HCC | tRNA modification | 60/7958 | 90/18723 | 3.09e-06 | 4.09e-05 | 60 |
| GO:00344709 | Oral cavity | OSCC | ncRNA processing | 263/7305 | 395/18723 | 4.38e-29 | 2.78e-26 | 263 |
| GO:00346605 | Oral cavity | OSCC | ncRNA metabolic process | 296/7305 | 485/18723 | 2.94e-23 | 6.65e-21 | 296 |
| GO:00080332 | Oral cavity | OSCC | tRNA processing | 78/7305 | 127/18723 | 2.56e-07 | 4.00e-06 | 78 |
| GO:00063991 | Oral cavity | OSCC | tRNA metabolic process | 101/7305 | 179/18723 | 1.65e-06 | 2.15e-05 | 101 |
| GO:00094511 | Oral cavity | OSCC | RNA modification | 95/7305 | 167/18723 | 2.05e-06 | 2.62e-05 | 95 |
| GO:00064001 | Oral cavity | OSCC | tRNA modification | 53/7305 | 90/18723 | 1.04e-04 | 7.70e-04 | 53 |
| Page: 1 |
| Pathway ID | Tissue | Disease Stage | Description | Gene Ratio | Bg Ratio | pvalue | p.adjust | qvalue | Count |
| Page: 1 |
Top |
Cell-cell communication analysis |
| Identification of potential cell-cell interactions between two cell types and their ligand-receptor pairs for different disease states |
| Ligand | Receptor | LRpair | Pathway | Tissue | Disease Stage |
| Page: 1 |
Top |
Single-cell gene regulatory network inference analysis |
| Find out the significant the regulons (TFs) and the target genes of each regulon across cell types for different disease states |
| TF | Cell Type | Tissue | Disease Stage | Target Gene | RSS | Regulon Activity |
| ∗The dot plots of a searched regulon are shown for all cell subpopulations in each disease state of each tissue based on the regulon specific score inferred using pySCENIC and by calculating the average expression. |
| Page: 1 |
Top |
Somatic mutation of malignant transformation related genes |
| Annotation of somatic variants for genes involved in malignant transformation |
| Hugo Symbol | Variant Class | Variant Classification | dbSNP RS | HGVSc | HGVSp | HGVSp Short | SWISSPROT | BIOTYPE | SIFT | PolyPhen | Tumor Sample Barcode | Tissue | Histology | Sex | Age | Stage | Therapy Types | Drugs | Outcome |
| C9orf64 | SNV | Missense_Mutation | c.451N>C | p.Ile151Leu | p.I151L | Q5T6V5 | protein_coding | tolerated(0.28) | benign(0.109) | TCGA-E9-A22E-01 | Breast | breast invasive carcinoma | Female | <65 | III/IV | Chemotherapy | cyclophosphane | SD | |
| C9orf64 | insertion | Frame_Shift_Ins | novel | c.152_153insATACTTGCCATCGGACCTAACGGCCTTTGAGGTT | p.Leu52TyrfsTer14 | p.L52Yfs*14 | Q5T6V5 | protein_coding | TCGA-AN-A0FX-01 | Breast | breast invasive carcinoma | Female | <65 | I/II | Unknown | Unknown | SD | ||
| C9orf64 | SNV | Missense_Mutation | c.134N>A | p.Arg45His | p.R45H | Q5T6V5 | protein_coding | tolerated(0.08) | benign(0.197) | TCGA-AA-3510-01 | Colorectum | colon adenocarcinoma | Male | >=65 | I/II | Unknown | Unknown | SD | |
| C9orf64 | SNV | Missense_Mutation | c.58G>A | p.Asp20Asn | p.D20N | Q5T6V5 | protein_coding | tolerated(0.16) | probably_damaging(0.996) | TCGA-AA-A010-01 | Colorectum | colon adenocarcinoma | Female | <65 | I/II | Chemotherapy | folinic | CR | |
| C9orf64 | SNV | Missense_Mutation | c.391C>T | p.Arg131Trp | p.R131W | Q5T6V5 | protein_coding | deleterious(0.01) | benign(0.003) | TCGA-CA-6717-01 | Colorectum | colon adenocarcinoma | Male | <65 | I/II | Chemotherapy | oxaliplatin | CR | |
| C9orf64 | SNV | Missense_Mutation | c.118G>A | p.Ala40Thr | p.A40T | Q5T6V5 | protein_coding | tolerated(0.45) | benign(0) | TCGA-G4-6588-01 | Colorectum | colon adenocarcinoma | Female | <65 | I/II | Unknown | Unknown | SD | |
| C9orf64 | SNV | Missense_Mutation | c.736N>A | p.Leu246Ile | p.L246I | Q5T6V5 | protein_coding | deleterious(0) | probably_damaging(0.998) | TCGA-F5-6814-01 | Colorectum | rectum adenocarcinoma | Male | <65 | I/II | Unknown | Unknown | SD | |
| C9orf64 | SNV | Missense_Mutation | rs757632690 | c.623N>A | p.Arg208Gln | p.R208Q | Q5T6V5 | protein_coding | deleterious(0) | probably_damaging(0.998) | TCGA-A5-A0G2-01 | Endometrium | uterine corpus endometrioid carcinoma | Female | <65 | III/IV | Unknown | Unknown | SD |
| C9orf64 | SNV | Missense_Mutation | novel | c.607N>A | p.Val203Ile | p.V203I | Q5T6V5 | protein_coding | tolerated(0.48) | benign(0.007) | TCGA-A5-A1OF-01 | Endometrium | uterine corpus endometrioid carcinoma | Female | <65 | I/II | Unknown | Unknown | SD |
| C9orf64 | SNV | Missense_Mutation | rs751832233 | c.868N>T | p.Arg290Trp | p.R290W | Q5T6V5 | protein_coding | tolerated(0.13) | probably_damaging(0.96) | TCGA-AJ-A8CT-01 | Endometrium | uterine corpus endometrioid carcinoma | Female | <65 | I/II | Unknown | Unknown | SD |
| Page: 1 2 3 |
Top |
Related drugs of malignant transformation related genes |
| Identification of chemicals and drugs interact with genes involved in malignant transfromation |
| (DGIdb 4.0) |
| Entrez ID | Symbol | Category | Interaction Types | Drug Claim Name | Drug Name | PMIDs |
| Page: 1 |

Copyright 2023-Present -The University of Texas Health Science Center at Houston |