
|
|||||
|
 | |
| |
| |
| |
| |
| |
|
Gene: C9orf172 |
Gene summary for C9ORF172 |
| Gene information | Species | Human | Gene symbol | C9orf172 | Gene ID | 389813 |
| Gene name | apical junction component 1 homolog | |
| Gene Alias | C9orf172 | |
| Cytomap | 9q34.3 | |
| Gene Type | protein-coding | GO ID | GO:0008150 | UniProtAcc | C9J069 |
Top |
Malignant transformation analysis |
| Identification of the aberrant gene expression in precancerous and cancerous lesions by comparing the gene expression of stem-like cells in diseased tissues with normal stem cells |
| Entrez ID | Symbol | Replicates | Species | Organ | Tissue | Adj P-value | Log2FC | Malignancy |
| 389813 | C9orf172 | P1T-E | Human | Esophagus | ESCC | 1.64e-05 | 3.13e-01 | 0.0875 |
| 389813 | C9orf172 | P2T-E | Human | Esophagus | ESCC | 6.62e-20 | 4.28e-01 | 0.1177 |
| 389813 | C9orf172 | P4T-E | Human | Esophagus | ESCC | 3.78e-04 | 1.36e-01 | 0.1323 |
| 389813 | C9orf172 | P5T-E | Human | Esophagus | ESCC | 1.85e-18 | 3.34e-01 | 0.1327 |
| 389813 | C9orf172 | P8T-E | Human | Esophagus | ESCC | 3.75e-03 | 1.04e-01 | 0.0889 |
| 389813 | C9orf172 | P9T-E | Human | Esophagus | ESCC | 8.38e-03 | 1.01e-01 | 0.1131 |
| 389813 | C9orf172 | P10T-E | Human | Esophagus | ESCC | 2.02e-06 | 1.44e-01 | 0.116 |
| 389813 | C9orf172 | P11T-E | Human | Esophagus | ESCC | 6.74e-09 | 3.22e-01 | 0.1426 |
| 389813 | C9orf172 | P15T-E | Human | Esophagus | ESCC | 3.34e-06 | 1.46e-01 | 0.1149 |
| 389813 | C9orf172 | P17T-E | Human | Esophagus | ESCC | 7.83e-16 | 5.35e-01 | 0.1278 |
| 389813 | C9orf172 | P20T-E | Human | Esophagus | ESCC | 4.04e-16 | 3.58e-01 | 0.1124 |
| 389813 | C9orf172 | P21T-E | Human | Esophagus | ESCC | 1.30e-15 | 2.88e-01 | 0.1617 |
| 389813 | C9orf172 | P22T-E | Human | Esophagus | ESCC | 9.44e-07 | 1.86e-01 | 0.1236 |
| 389813 | C9orf172 | P23T-E | Human | Esophagus | ESCC | 4.97e-06 | 1.78e-01 | 0.108 |
| 389813 | C9orf172 | P24T-E | Human | Esophagus | ESCC | 1.76e-12 | 3.00e-01 | 0.1287 |
| 389813 | C9orf172 | P26T-E | Human | Esophagus | ESCC | 4.31e-06 | 1.37e-01 | 0.1276 |
| 389813 | C9orf172 | P27T-E | Human | Esophagus | ESCC | 8.84e-05 | 1.56e-01 | 0.1055 |
| 389813 | C9orf172 | P28T-E | Human | Esophagus | ESCC | 1.97e-10 | 1.94e-01 | 0.1149 |
| 389813 | C9orf172 | P30T-E | Human | Esophagus | ESCC | 7.79e-07 | 3.43e-01 | 0.137 |
| 389813 | C9orf172 | P31T-E | Human | Esophagus | ESCC | 3.75e-03 | 8.48e-02 | 0.1251 |
| Page: 1 2 3 |
| Tissue | Expression Dynamics | Abbreviation |
| Esophagus | 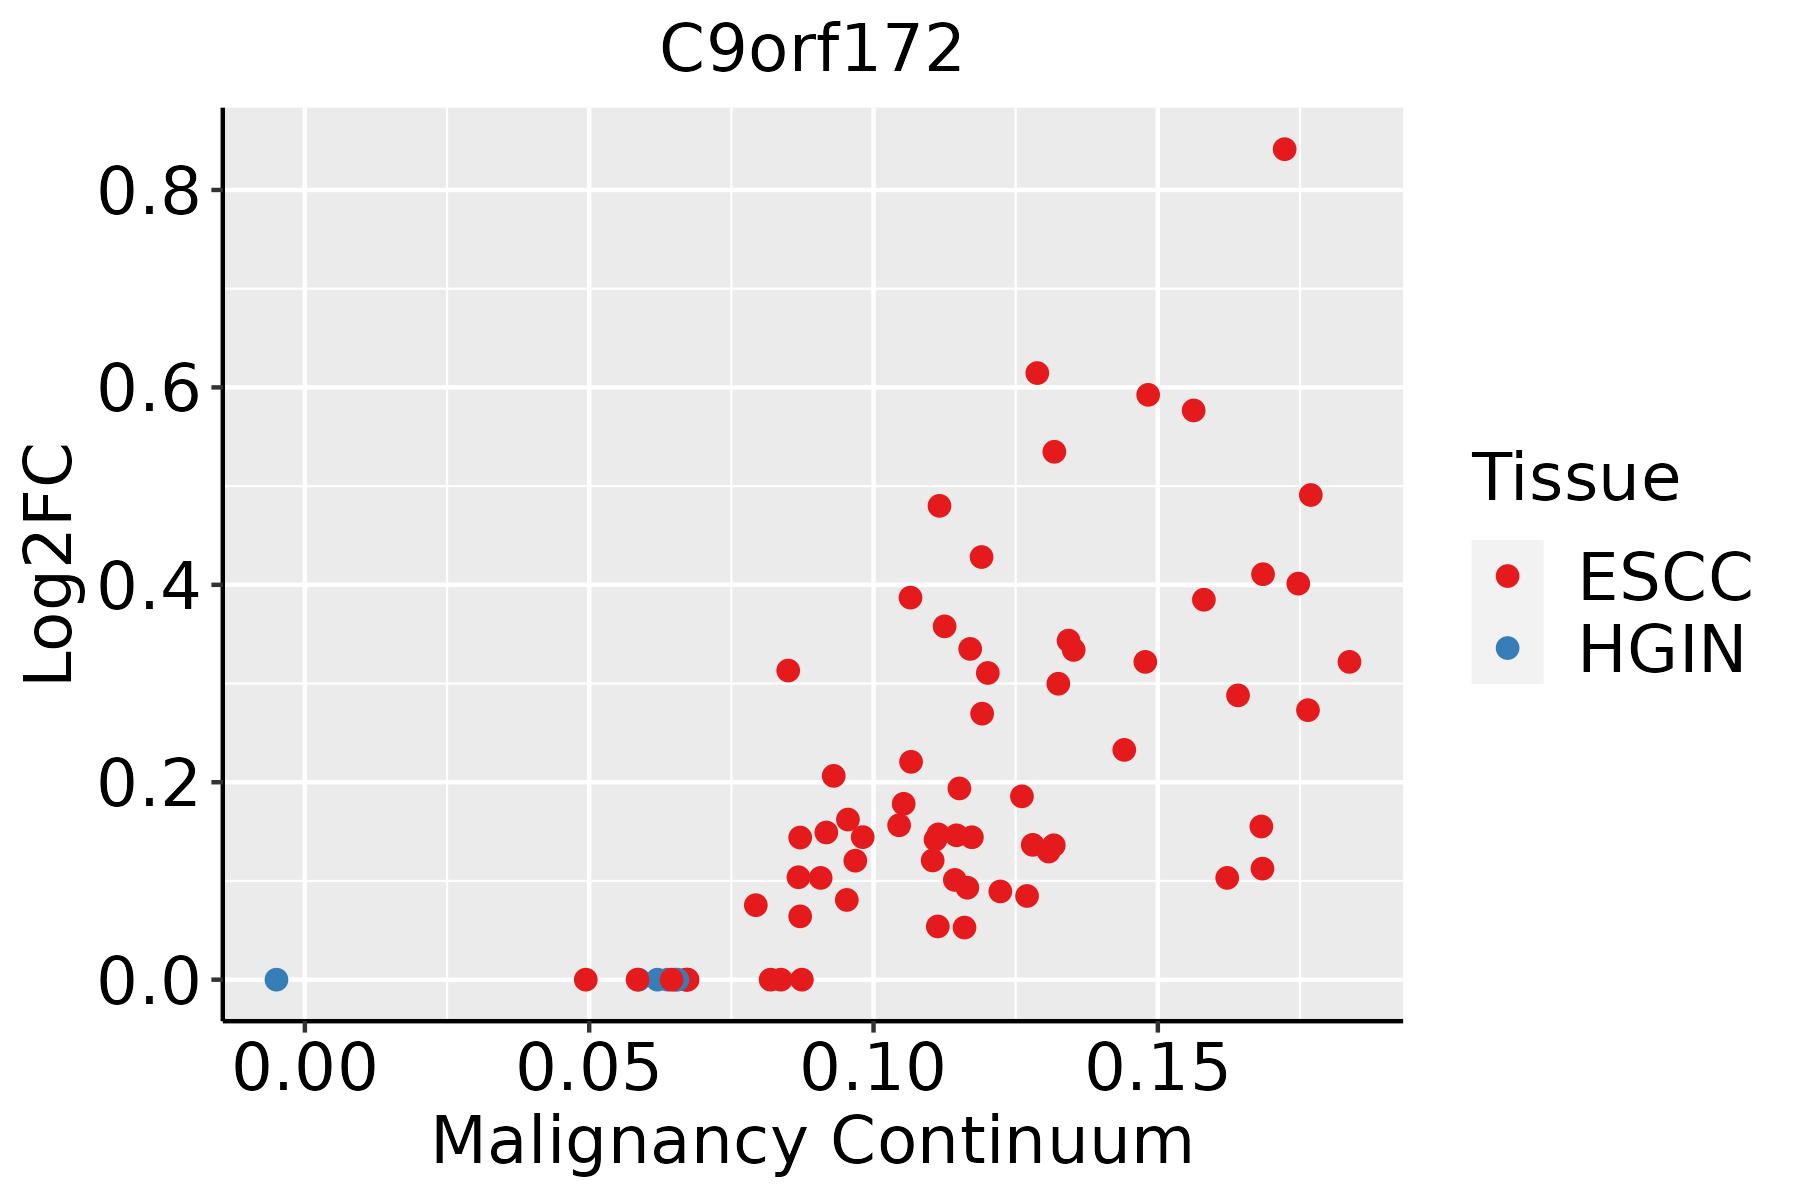 | ESCC: Esophageal squamous cell carcinoma |
| HGIN: High-grade intraepithelial neoplasias | ||
| LGIN: Low-grade intraepithelial neoplasias |
| ∗log2FC in expression of this searched gene in stem-like cells from each diseased tissue sample relative to stem-like cells in normal samples in each tissue plotted against the malignancy continuum. Samples are colored based on if they are from different disease stage. |
Top |
Malignant transformation related pathway analysis |
| Find out the enriched GO biological processes and KEGG pathways involved in transition from healthy to precancer to cancer |
| Tissue | Disease Stage | Enriched GO biological Processes |
| Colorectum | AD |  |
| Colorectum | SER |  |
| Colorectum | MSS |  |
| Colorectum | MSI-H |  |
| Colorectum | FAP |  |
| ∗Top 15 enriched GO BP terms are showed in the bar plot of each disease state in each tissue. Each row represents a significant GO biological process which is colored according to the -log10(p.adjust). |
| Page: 1 2 3 4 5 6 7 8 9 |
| GO ID | Tissue | Disease Stage | Description | Gene Ratio | Bg Ratio | pvalue | p.adjust | Count |
| Page: 1 |
| Pathway ID | Tissue | Disease Stage | Description | Gene Ratio | Bg Ratio | pvalue | p.adjust | qvalue | Count |
| Page: 1 |
Top |
Cell-cell communication analysis |
| Identification of potential cell-cell interactions between two cell types and their ligand-receptor pairs for different disease states |
| Ligand | Receptor | LRpair | Pathway | Tissue | Disease Stage |
| Page: 1 |
Top |
Single-cell gene regulatory network inference analysis |
| Find out the significant the regulons (TFs) and the target genes of each regulon across cell types for different disease states |
| TF | Cell Type | Tissue | Disease Stage | Target Gene | RSS | Regulon Activity |
| ∗The dot plots of a searched regulon are shown for all cell subpopulations in each disease state of each tissue based on the regulon specific score inferred using pySCENIC and by calculating the average expression. |
| Page: 1 |
Top |
Somatic mutation of malignant transformation related genes |
| Annotation of somatic variants for genes involved in malignant transformation |
| Hugo Symbol | Variant Class | Variant Classification | dbSNP RS | HGVSc | HGVSp | HGVSp Short | SWISSPROT | BIOTYPE | SIFT | PolyPhen | Tumor Sample Barcode | Tissue | Histology | Sex | Age | Stage | Therapy Types | Drugs | Outcome |
| C9orf172 | SNV | Missense_Mutation | rs757182652 | c.940G>A | p.Glu314Lys | p.E314K | C9J069 | protein_coding | tolerated(0.15) | benign(0.443) | TCGA-PE-A5DE-01 | Breast | breast invasive carcinoma | Female | <65 | I/II | Chemotherapy | taxotere | CR |
| C9orf172 | SNV | Missense_Mutation | rs375917223 | c.142N>T | p.Arg48Cys | p.R48C | C9J069 | protein_coding | deleterious(0) | probably_damaging(0.973) | TCGA-A6-5665-01 | Colorectum | colon adenocarcinoma | Female | >=65 | I/II | Unknown | Unknown | PD |
| C9orf172 | SNV | Missense_Mutation | c.1850N>A | p.Arg617Gln | p.R617Q | C9J069 | protein_coding | tolerated(0.17) | benign(0.253) | TCGA-A6-6780-01 | Colorectum | colon adenocarcinoma | Male | >=65 | I/II | Unknown | Unknown | SD | |
| C9orf172 | SNV | Missense_Mutation | c.2785N>A | p.Glu929Lys | p.E929K | C9J069 | protein_coding | deleterious(0) | probably_damaging(0.997) | TCGA-DM-A1DA-01 | Colorectum | colon adenocarcinoma | Female | >=65 | III/IV | Unknown | Unknown | SD | |
| C9orf172 | SNV | Missense_Mutation | c.2185A>G | p.Ser729Gly | p.S729G | C9J069 | protein_coding | deleterious(0.02) | benign(0.365) | TCGA-NH-A5IV-01 | Colorectum | colon adenocarcinoma | Female | >=65 | I/II | Unknown | Unknown | SD | |
| C9orf172 | SNV | Missense_Mutation | novel | c.35N>T | p.Ser12Leu | p.S12L | C9J069 | protein_coding | deleterious(0) | possibly_damaging(0.773) | TCGA-EI-6917-01 | Colorectum | rectum adenocarcinoma | Male | <65 | III/IV | Chemotherapy | 5fluorouracil+oxaciplatina+l-folinian | SD |
| C9orf172 | SNV | Missense_Mutation | novel | c.843N>A | p.Phe281Leu | p.F281L | C9J069 | protein_coding | deleterious(0.02) | possibly_damaging(0.861) | TCGA-AP-A1E0-01 | Endometrium | uterine corpus endometrioid carcinoma | Female | <65 | III/IV | Chemotherapy | paclitaxel | SD |
| C9orf172 | SNV | Missense_Mutation | rs758258222 | c.883G>A | p.Ala295Thr | p.A295T | C9J069 | protein_coding | tolerated(0.6) | benign(0) | TCGA-BG-A0MQ-01 | Endometrium | uterine corpus endometrioid carcinoma | Female | >=65 | I/II | Unknown | Unknown | SD |
| C9orf172 | SNV | Missense_Mutation | novel | c.122N>C | p.Glu41Ala | p.E41A | C9J069 | protein_coding | tolerated(0.74) | benign(0) | TCGA-BG-A221-01 | Endometrium | uterine corpus endometrioid carcinoma | Female | >=65 | I/II | Unknown | Unknown | SD |
| C9orf172 | SNV | Missense_Mutation | rs745988535 | c.793N>A | p.Ala265Thr | p.A265T | C9J069 | protein_coding | tolerated(0.4) | benign(0.005) | TCGA-EY-A2OM-01 | Endometrium | uterine corpus endometrioid carcinoma | Female | <65 | I/II | Chemotherapy | taxol | SD |
| Page: 1 2 3 4 |
Top |
Related drugs of malignant transformation related genes |
| Identification of chemicals and drugs interact with genes involved in malignant transfromation |
| (DGIdb 4.0) |
| Entrez ID | Symbol | Category | Interaction Types | Drug Claim Name | Drug Name | PMIDs |
| Page: 1 |

Copyright 2023-Present -The University of Texas Health Science Center at Houston |