
|
|||||
|
 | |
| |
| |
| |
| |
| |
|
Gene: C9orf142 |
Gene summary for C9ORF142 |
| Gene information | Species | Human | Gene symbol | C9orf142 | Gene ID | 286257 |
| Gene name | PAXX non-homologous end joining factor | |
| Gene Alias | C9orf142 | |
| Cytomap | 9q34.3 | |
| Gene Type | protein-coding | GO ID | GO:0006139 | UniProtAcc | Q9BUH6 |
Top |
Malignant transformation analysis |
| Identification of the aberrant gene expression in precancerous and cancerous lesions by comparing the gene expression of stem-like cells in diseased tissues with normal stem cells |
| Entrez ID | Symbol | Replicates | Species | Organ | Tissue | Adj P-value | Log2FC | Malignancy |
| 286257 | C9orf142 | P1T-E | Human | Esophagus | ESCC | 5.29e-17 | 1.00e+00 | 0.0875 |
| 286257 | C9orf142 | P2T-E | Human | Esophagus | ESCC | 6.61e-54 | 1.11e+00 | 0.1177 |
| 286257 | C9orf142 | P4T-E | Human | Esophagus | ESCC | 7.11e-40 | 1.09e+00 | 0.1323 |
| 286257 | C9orf142 | P5T-E | Human | Esophagus | ESCC | 1.80e-65 | 1.30e+00 | 0.1327 |
| 286257 | C9orf142 | P8T-E | Human | Esophagus | ESCC | 7.14e-67 | 1.21e+00 | 0.0889 |
| 286257 | C9orf142 | P9T-E | Human | Esophagus | ESCC | 1.47e-26 | 7.30e-01 | 0.1131 |
| 286257 | C9orf142 | P10T-E | Human | Esophagus | ESCC | 1.91e-39 | 7.98e-01 | 0.116 |
| 286257 | C9orf142 | P11T-E | Human | Esophagus | ESCC | 4.81e-28 | 1.07e+00 | 0.1426 |
| 286257 | C9orf142 | P12T-E | Human | Esophagus | ESCC | 1.47e-36 | 8.12e-01 | 0.1122 |
| 286257 | C9orf142 | P15T-E | Human | Esophagus | ESCC | 1.11e-39 | 8.75e-01 | 0.1149 |
| 286257 | C9orf142 | P16T-E | Human | Esophagus | ESCC | 3.05e-35 | 7.26e-01 | 0.1153 |
| 286257 | C9orf142 | P17T-E | Human | Esophagus | ESCC | 3.81e-14 | 8.67e-01 | 0.1278 |
| 286257 | C9orf142 | P19T-E | Human | Esophagus | ESCC | 1.38e-12 | 8.45e-01 | 0.1662 |
| 286257 | C9orf142 | P20T-E | Human | Esophagus | ESCC | 2.71e-32 | 6.73e-01 | 0.1124 |
| 286257 | C9orf142 | P21T-E | Human | Esophagus | ESCC | 7.12e-71 | 1.36e+00 | 0.1617 |
| 286257 | C9orf142 | P22T-E | Human | Esophagus | ESCC | 1.92e-66 | 1.08e+00 | 0.1236 |
| 286257 | C9orf142 | P23T-E | Human | Esophagus | ESCC | 1.23e-36 | 8.06e-01 | 0.108 |
| 286257 | C9orf142 | P24T-E | Human | Esophagus | ESCC | 4.16e-35 | 7.04e-01 | 0.1287 |
| 286257 | C9orf142 | P26T-E | Human | Esophagus | ESCC | 2.55e-38 | 7.87e-01 | 0.1276 |
| 286257 | C9orf142 | P27T-E | Human | Esophagus | ESCC | 2.95e-44 | 8.12e-01 | 0.1055 |
| Page: 1 2 3 4 5 |
| Tissue | Expression Dynamics | Abbreviation |
| Esophagus |  | ESCC: Esophageal squamous cell carcinoma |
| HGIN: High-grade intraepithelial neoplasias | ||
| LGIN: Low-grade intraepithelial neoplasias | ||
| Oral Cavity | 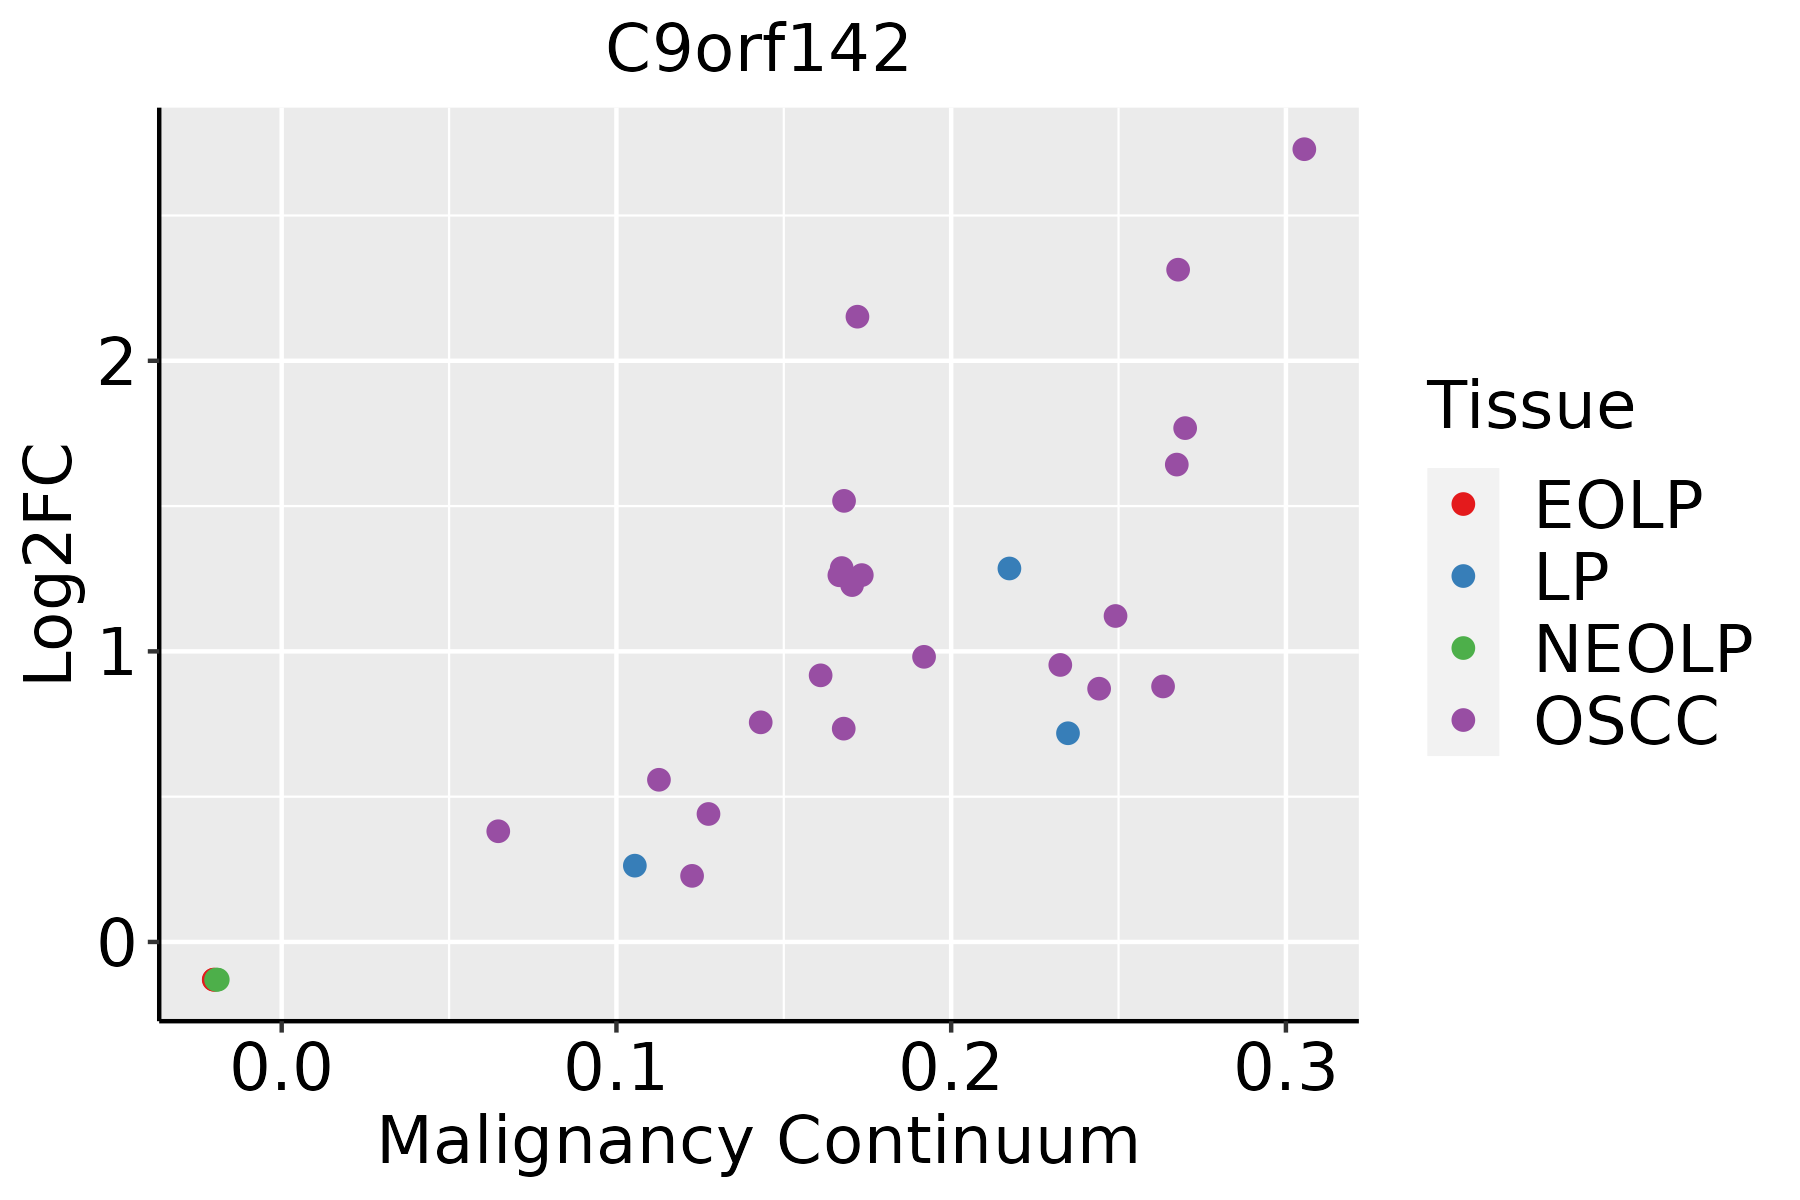 | EOLP: Erosive Oral lichen planus |
| LP: leukoplakia | ||
| NEOLP: Non-erosive oral lichen planus | ||
| OSCC: Oral squamous cell carcinoma | ||
| Prostate | 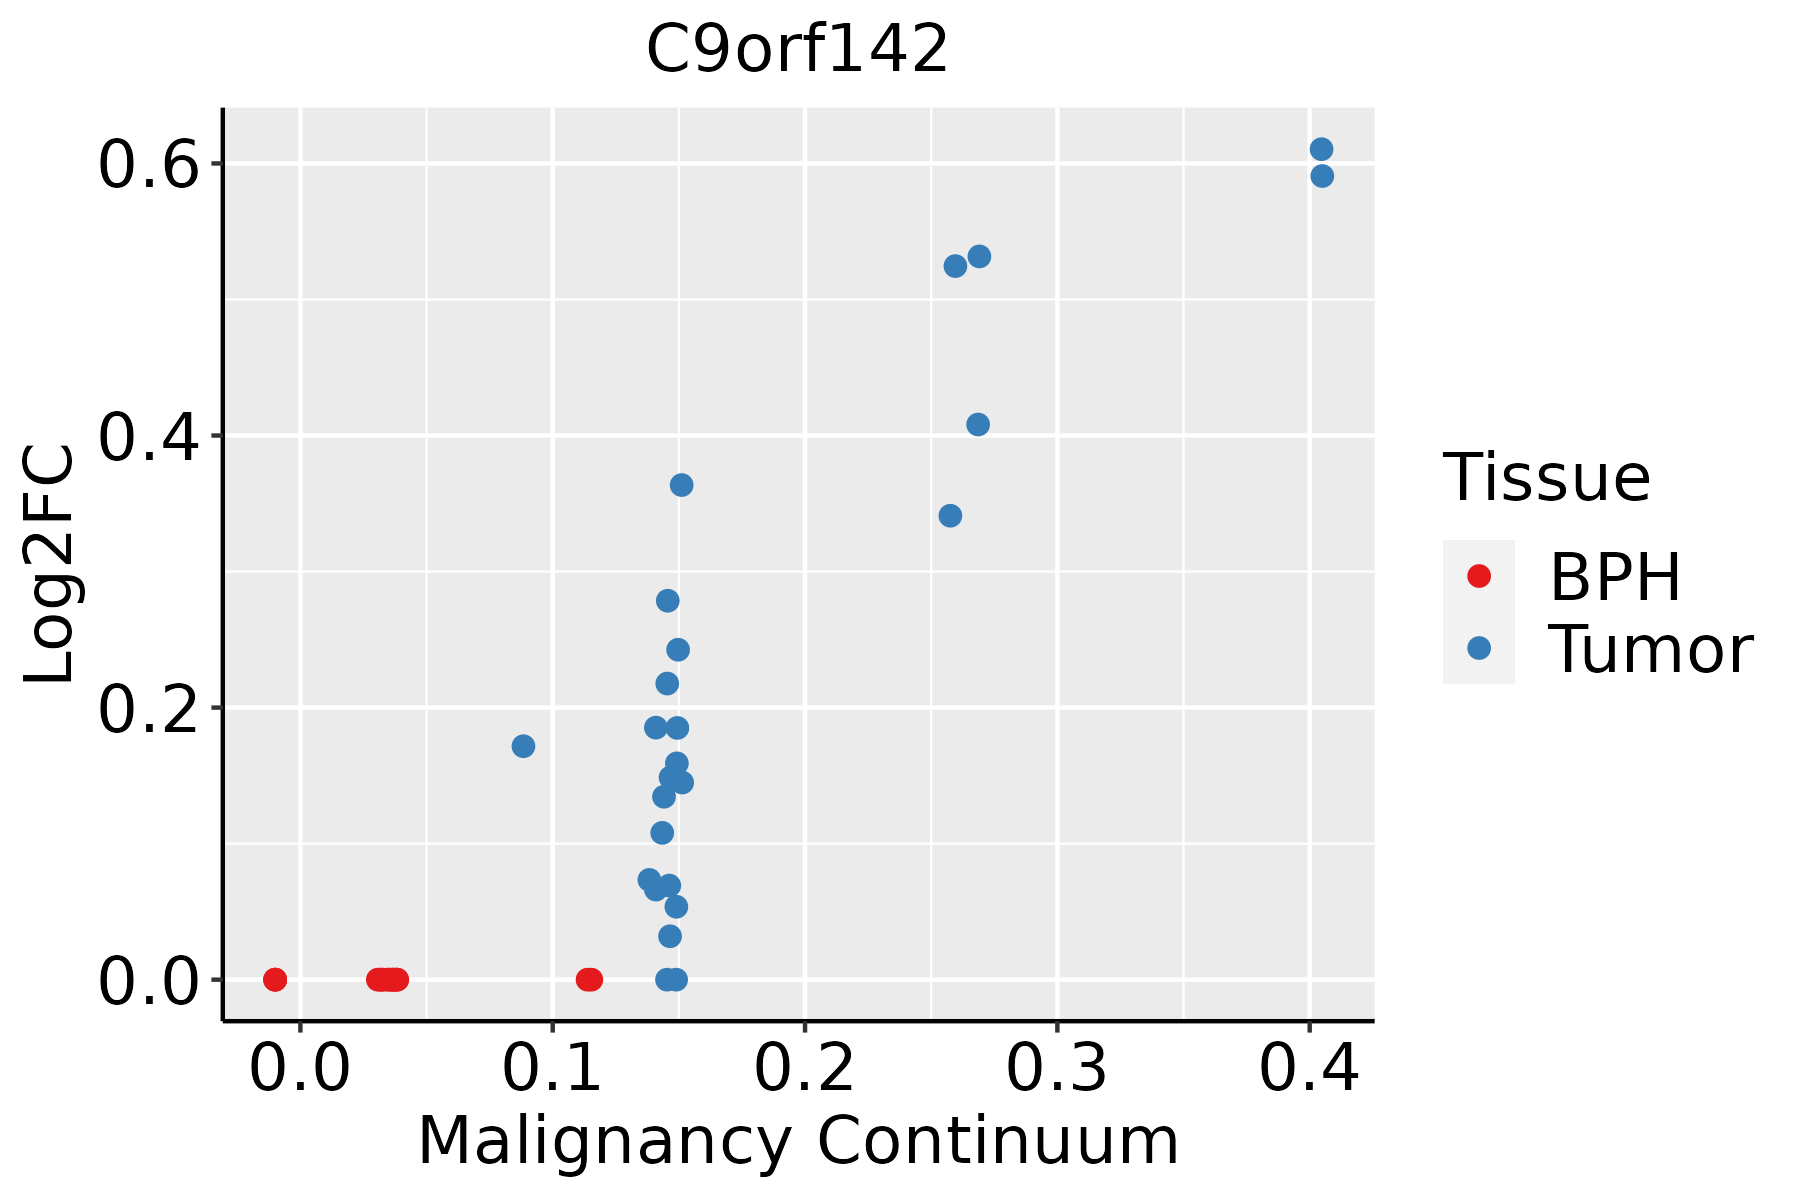 | BPH: Benign Prostatic Hyperplasia |
| Skin |  | AK: Actinic keratosis |
| cSCC: Cutaneous squamous cell carcinoma | ||
| SCCIS:squamous cell carcinoma in situ |
| ∗log2FC in expression of this searched gene in stem-like cells from each diseased tissue sample relative to stem-like cells in normal samples in each tissue plotted against the malignancy continuum. Samples are colored based on if they are from different disease stage. |
Top |
Malignant transformation related pathway analysis |
| Find out the enriched GO biological processes and KEGG pathways involved in transition from healthy to precancer to cancer |
| Tissue | Disease Stage | Enriched GO biological Processes |
| Colorectum | AD |  |
| Colorectum | SER |  |
| Colorectum | MSS |  |
| Colorectum | MSI-H |  |
| Colorectum | FAP |  |
| ∗Top 15 enriched GO BP terms are showed in the bar plot of each disease state in each tissue. Each row represents a significant GO biological process which is colored according to the -log10(p.adjust). |
| Page: 1 2 3 4 5 6 7 8 9 |
| GO ID | Tissue | Disease Stage | Description | Gene Ratio | Bg Ratio | pvalue | p.adjust | Count |
| Page: 1 |
| Pathway ID | Tissue | Disease Stage | Description | Gene Ratio | Bg Ratio | pvalue | p.adjust | qvalue | Count |
| Page: 1 |
Top |
Cell-cell communication analysis |
| Identification of potential cell-cell interactions between two cell types and their ligand-receptor pairs for different disease states |
| Ligand | Receptor | LRpair | Pathway | Tissue | Disease Stage |
| Page: 1 |
Top |
Single-cell gene regulatory network inference analysis |
| Find out the significant the regulons (TFs) and the target genes of each regulon across cell types for different disease states |
| TF | Cell Type | Tissue | Disease Stage | Target Gene | RSS | Regulon Activity |
| ∗The dot plots of a searched regulon are shown for all cell subpopulations in each disease state of each tissue based on the regulon specific score inferred using pySCENIC and by calculating the average expression. |
| Page: 1 |
Top |
Somatic mutation of malignant transformation related genes |
| Annotation of somatic variants for genes involved in malignant transformation |
| Hugo Symbol | Variant Class | Variant Classification | dbSNP RS | HGVSc | HGVSp | HGVSp Short | SWISSPROT | BIOTYPE | SIFT | PolyPhen | Tumor Sample Barcode | Tissue | Histology | Sex | Age | Stage | Therapy Types | Drugs | Outcome |
| C9orf142 | SNV | Missense_Mutation | c.457C>A | p.Pro153Thr | p.P153T | Q9BUH6 | protein_coding | tolerated(0.17) | benign(0) | TCGA-A7-A26G-01 | Breast | breast invasive carcinoma | Female | <65 | I/II | Chemotherapy | taxotere | SD | |
| C9orf142 | SNV | Missense_Mutation | rs558231652 | c.536N>A | p.Arg179Gln | p.R179Q | Q9BUH6 | protein_coding | deleterious(0.04) | possibly_damaging(0.695) | TCGA-E2-A15G-01 | Breast | breast invasive carcinoma | Female | >=65 | I/II | Hormone Therapy | arimidex | SD |
| C9orf142 | SNV | Missense_Mutation | novel | c.190T>G | p.Phe64Val | p.F64V | Q9BUH6 | protein_coding | tolerated(0.21) | benign(0.039) | TCGA-AA-3984-01 | Colorectum | colon adenocarcinoma | Female | <65 | I/II | Unknown | Unknown | SD |
| C9orf142 | deletion | Frame_Shift_Del | c.218delN | p.Arg75GlyfsTer13 | p.R75Gfs*13 | Q9BUH6 | protein_coding | TCGA-QG-A5Z2-01 | Colorectum | colon adenocarcinoma | Male | <65 | I/II | Unknown | Unknown | SD | |||
| C9orf142 | SNV | Missense_Mutation | rs558231652 | c.536N>A | p.Arg179Gln | p.R179Q | Q9BUH6 | protein_coding | deleterious(0.04) | possibly_damaging(0.695) | TCGA-A5-A7WJ-01 | Endometrium | uterine corpus endometrioid carcinoma | Female | <65 | I/II | Unknown | Unknown | SD |
| C9orf142 | SNV | Missense_Mutation | rs370085766 | c.604N>A | p.Asp202Asn | p.D202N | Q9BUH6 | protein_coding | deleterious(0) | possibly_damaging(0.659) | TCGA-AP-A0LM-01 | Endometrium | uterine corpus endometrioid carcinoma | Female | <65 | III/IV | Chemotherapy | cisplatin | SD |
| C9orf142 | SNV | Missense_Mutation | novel | c.568N>C | p.Phe190Leu | p.F190L | Q9BUH6 | protein_coding | deleterious(0.01) | possibly_damaging(0.877) | TCGA-B5-A11E-01 | Endometrium | uterine corpus endometrioid carcinoma | Female | <65 | I/II | Unknown | Unknown | SD |
| C9orf142 | SNV | Missense_Mutation | novel | c.280N>T | p.Ala94Ser | p.A94S | Q9BUH6 | protein_coding | deleterious(0.02) | probably_damaging(0.938) | TCGA-B5-A5OC-01 | Endometrium | uterine corpus endometrioid carcinoma | Female | >=65 | III/IV | Chemotherapy | cisplatin | SD |
| C9orf142 | SNV | Missense_Mutation | c.573G>T | p.Lys191Asn | p.K191N | Q9BUH6 | protein_coding | deleterious(0) | probably_damaging(0.998) | TCGA-BS-A0UV-01 | Endometrium | uterine corpus endometrioid carcinoma | Female | <65 | III/IV | Unknown | Unknown | SD | |
| C9orf142 | SNV | Missense_Mutation | rs370085766 | c.604G>A | p.Asp202Asn | p.D202N | Q9BUH6 | protein_coding | deleterious(0) | possibly_damaging(0.659) | TCGA-D1-A103-01 | Endometrium | uterine corpus endometrioid carcinoma | Female | >=65 | I/II | Unknown | Unknown | SD |
| Page: 1 2 |
Top |
Related drugs of malignant transformation related genes |
| Identification of chemicals and drugs interact with genes involved in malignant transfromation |
| (DGIdb 4.0) |
| Entrez ID | Symbol | Category | Interaction Types | Drug Claim Name | Drug Name | PMIDs |
| Page: 1 |

Copyright 2023-Present -The University of Texas Health Science Center at Houston |