
|
|||||
|
 | |
| |
| |
| |
| |
| |
|
Gene: C8orf88 |
Gene summary for C8ORF88 |
| Gene information | Species | Human | Gene symbol | C8orf88 | Gene ID | 100127983 |
| Gene name | chromosome 8 open reading frame 88 | |
| Gene Alias | C8orf88 | |
| Cytomap | 8q21.3 | |
| Gene Type | protein-coding | GO ID | GO:0006412 | UniProtAcc | P0DMB2 |
Top |
Malignant transformation analysis |
| Identification of the aberrant gene expression in precancerous and cancerous lesions by comparing the gene expression of stem-like cells in diseased tissues with normal stem cells |
| Entrez ID | Symbol | Replicates | Species | Organ | Tissue | Adj P-value | Log2FC | Malignancy |
| 100127983 | C8orf88 | P2T-E | Human | Esophagus | ESCC | 1.93e-40 | 6.71e-01 | 0.1177 |
| 100127983 | C8orf88 | P10T-E | Human | Esophagus | ESCC | 2.54e-14 | 2.77e-01 | 0.116 |
| 100127983 | C8orf88 | P11T-E | Human | Esophagus | ESCC | 1.09e-02 | 1.66e-01 | 0.1426 |
| 100127983 | C8orf88 | P16T-E | Human | Esophagus | ESCC | 1.74e-35 | 5.69e-01 | 0.1153 |
| 100127983 | C8orf88 | P22T-E | Human | Esophagus | ESCC | 1.23e-05 | 6.68e-02 | 0.1236 |
| 100127983 | C8orf88 | P30T-E | Human | Esophagus | ESCC | 5.51e-03 | 2.92e-01 | 0.137 |
| 100127983 | C8orf88 | P32T-E | Human | Esophagus | ESCC | 2.41e-21 | 3.94e-01 | 0.1666 |
| 100127983 | C8orf88 | P37T-E | Human | Esophagus | ESCC | 1.22e-16 | 3.38e-01 | 0.1371 |
| 100127983 | C8orf88 | P38T-E | Human | Esophagus | ESCC | 4.11e-09 | 5.52e-01 | 0.127 |
| 100127983 | C8orf88 | P44T-E | Human | Esophagus | ESCC | 2.21e-02 | 1.03e-01 | 0.1096 |
| 100127983 | C8orf88 | P56T-E | Human | Esophagus | ESCC | 3.10e-05 | 6.11e-01 | 0.1613 |
| 100127983 | C8orf88 | P57T-E | Human | Esophagus | ESCC | 7.62e-05 | 1.52e-01 | 0.0926 |
| 100127983 | C8orf88 | P62T-E | Human | Esophagus | ESCC | 7.75e-03 | 5.53e-02 | 0.1302 |
| 100127983 | C8orf88 | P75T-E | Human | Esophagus | ESCC | 2.04e-02 | 9.90e-02 | 0.1125 |
| 100127983 | C8orf88 | P76T-E | Human | Esophagus | ESCC | 6.19e-22 | 4.09e-01 | 0.1207 |
| 100127983 | C8orf88 | P79T-E | Human | Esophagus | ESCC | 1.27e-05 | 1.84e-01 | 0.1154 |
| 100127983 | C8orf88 | P80T-E | Human | Esophagus | ESCC | 3.68e-14 | 6.07e-01 | 0.155 |
| 100127983 | C8orf88 | P83T-E | Human | Esophagus | ESCC | 2.45e-30 | 9.06e-01 | 0.1738 |
| 100127983 | C8orf88 | P89T-E | Human | Esophagus | ESCC | 4.14e-16 | 8.14e-01 | 0.1752 |
| 100127983 | C8orf88 | P107T-E | Human | Esophagus | ESCC | 2.38e-19 | 5.40e-01 | 0.171 |
| Page: 1 2 |
| Tissue | Expression Dynamics | Abbreviation |
| Esophagus | 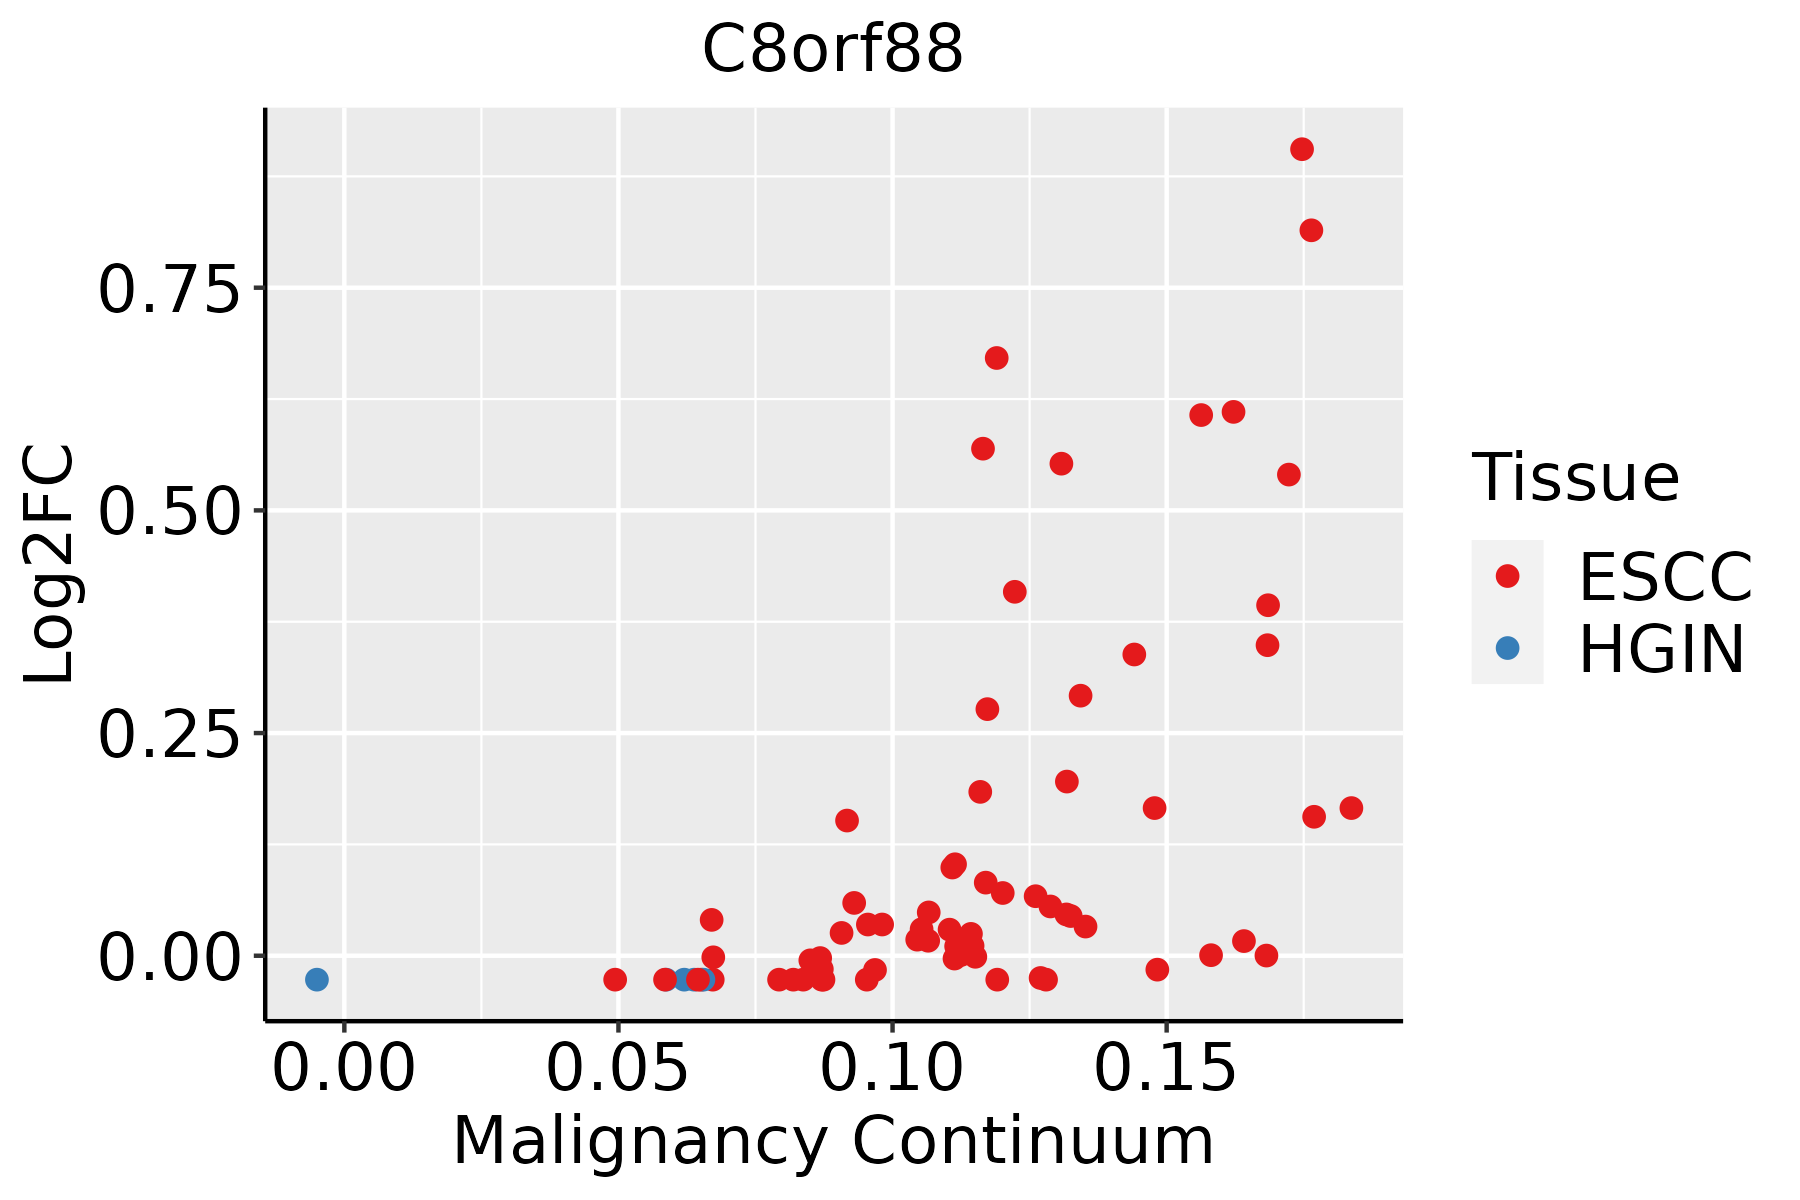 | ESCC: Esophageal squamous cell carcinoma |
| HGIN: High-grade intraepithelial neoplasias | ||
| LGIN: Low-grade intraepithelial neoplasias | ||
| Liver | 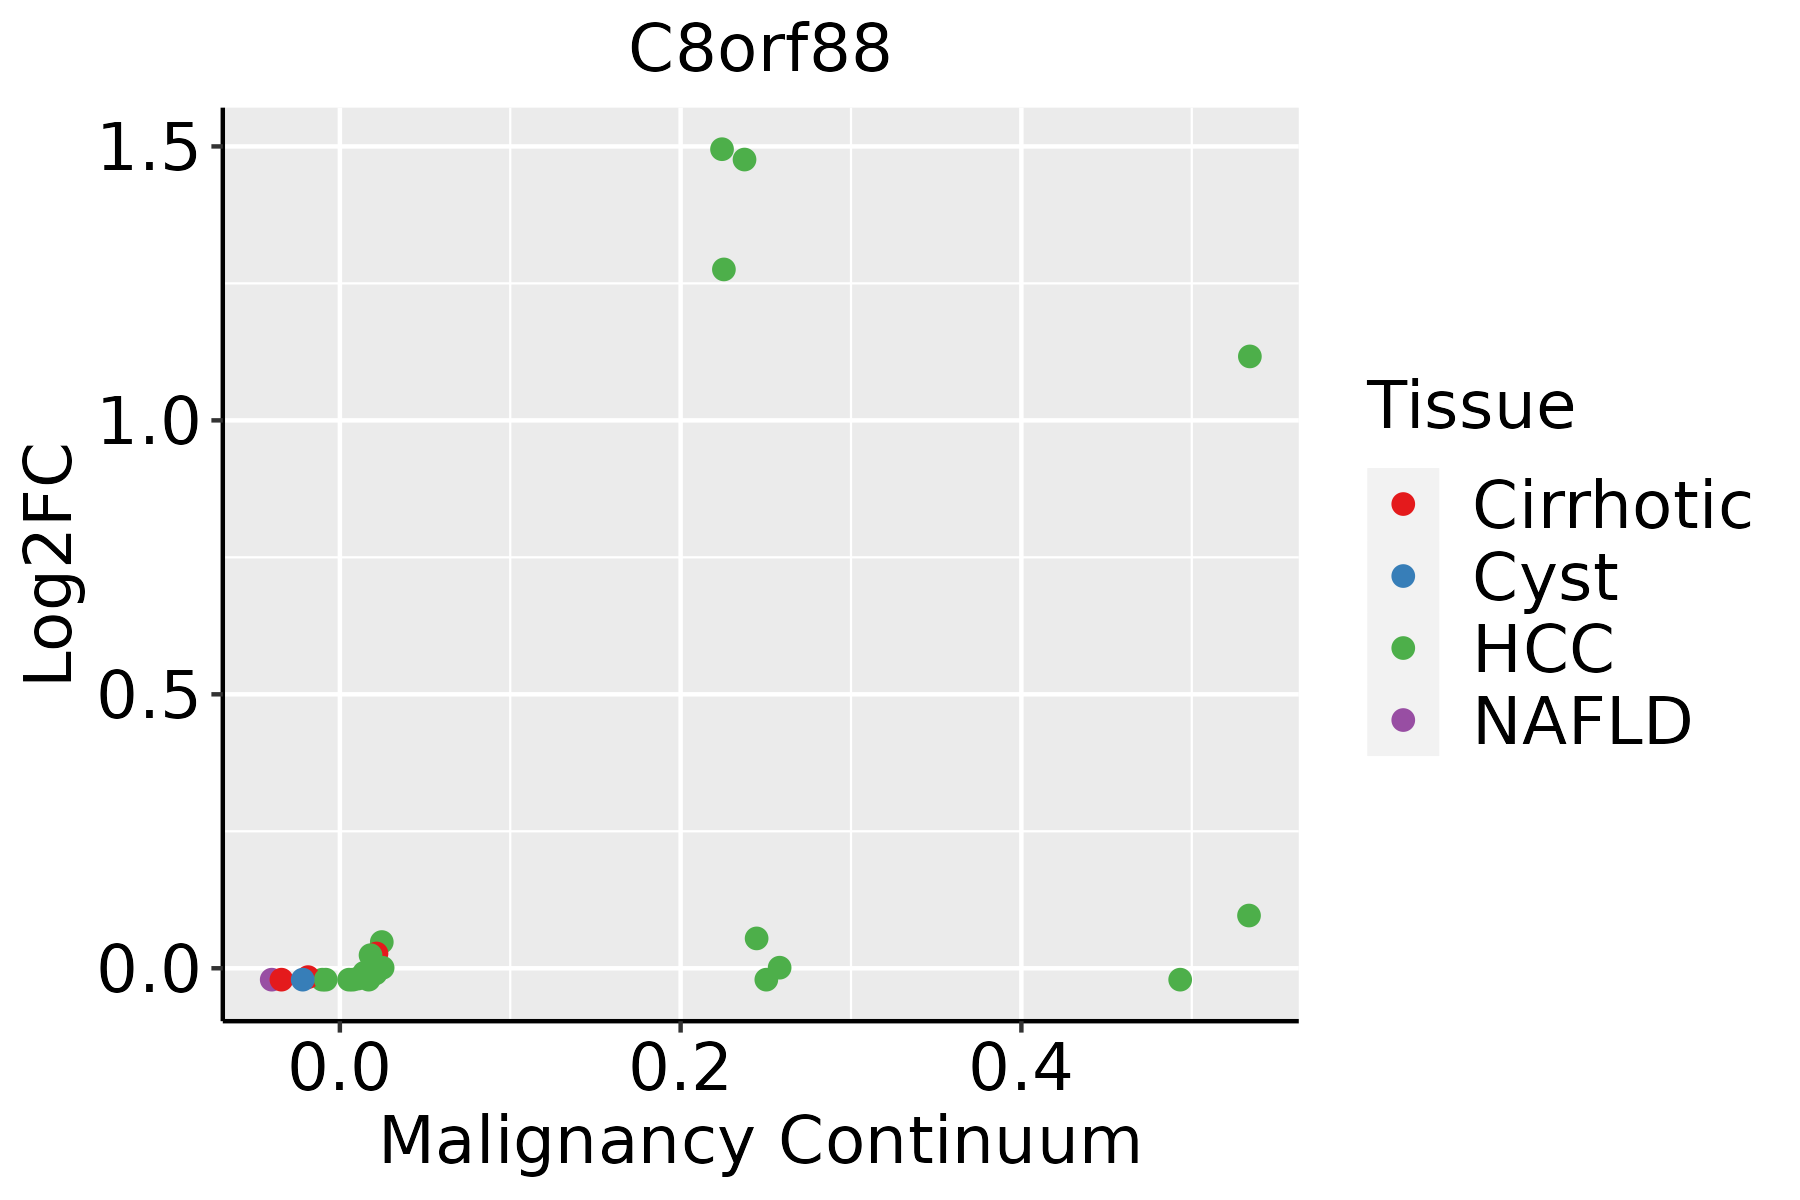 | HCC: Hepatocellular carcinoma |
| NAFLD: Non-alcoholic fatty liver disease |
| ∗log2FC in expression of this searched gene in stem-like cells from each diseased tissue sample relative to stem-like cells in normal samples in each tissue plotted against the malignancy continuum. Samples are colored based on if they are from different disease stage. |
Top |
Malignant transformation related pathway analysis |
| Find out the enriched GO biological processes and KEGG pathways involved in transition from healthy to precancer to cancer |
| Tissue | Disease Stage | Enriched GO biological Processes |
| Colorectum | AD |  |
| Colorectum | SER |  |
| Colorectum | MSS |  |
| Colorectum | MSI-H |  |
| Colorectum | FAP |  |
| ∗Top 15 enriched GO BP terms are showed in the bar plot of each disease state in each tissue. Each row represents a significant GO biological process which is colored according to the -log10(p.adjust). |
| Page: 1 2 3 4 5 6 7 8 9 |
| GO ID | Tissue | Disease Stage | Description | Gene Ratio | Bg Ratio | pvalue | p.adjust | Count |
| GO:0006413110 | Esophagus | ESCC | translational initiation | 100/8552 | 118/18723 | 1.16e-18 | 1.25e-16 | 100 |
| GO:0006417111 | Esophagus | ESCC | regulation of translation | 304/8552 | 468/18723 | 1.53e-17 | 1.33e-15 | 304 |
| GO:000644617 | Esophagus | ESCC | regulation of translational initiation | 65/8552 | 79/18723 | 2.04e-11 | 7.07e-10 | 65 |
| GO:004594714 | Esophagus | ESCC | negative regulation of translational initiation | 16/8552 | 19/18723 | 6.45e-04 | 3.43e-03 | 16 |
| GO:003424914 | Esophagus | ESCC | negative regulation of cellular amide metabolic process | 144/8552 | 273/18723 | 1.08e-02 | 3.67e-02 | 144 |
| GO:000641722 | Liver | HCC | regulation of translation | 287/7958 | 468/18723 | 8.79e-17 | 8.08e-15 | 287 |
| GO:000641322 | Liver | HCC | translational initiation | 94/7958 | 118/18723 | 1.39e-16 | 1.24e-14 | 94 |
| GO:000644622 | Liver | HCC | regulation of translational initiation | 62/7958 | 79/18723 | 6.85e-11 | 2.48e-09 | 62 |
| GO:003424921 | Liver | HCC | negative regulation of cellular amide metabolic process | 144/7958 | 273/18723 | 3.80e-04 | 2.61e-03 | 144 |
| GO:001714821 | Liver | HCC | negative regulation of translation | 129/7958 | 245/18723 | 8.14e-04 | 4.87e-03 | 129 |
| GO:004594711 | Liver | HCC | negative regulation of translational initiation | 15/7958 | 19/18723 | 1.36e-03 | 7.28e-03 | 15 |
| Page: 1 |
| Pathway ID | Tissue | Disease Stage | Description | Gene Ratio | Bg Ratio | pvalue | p.adjust | qvalue | Count |
| Page: 1 |
Top |
Cell-cell communication analysis |
| Identification of potential cell-cell interactions between two cell types and their ligand-receptor pairs for different disease states |
| Ligand | Receptor | LRpair | Pathway | Tissue | Disease Stage |
| Page: 1 |
Top |
Single-cell gene regulatory network inference analysis |
| Find out the significant the regulons (TFs) and the target genes of each regulon across cell types for different disease states |
| TF | Cell Type | Tissue | Disease Stage | Target Gene | RSS | Regulon Activity |
| ∗The dot plots of a searched regulon are shown for all cell subpopulations in each disease state of each tissue based on the regulon specific score inferred using pySCENIC and by calculating the average expression. |
| Page: 1 |
Top |
Somatic mutation of malignant transformation related genes |
| Annotation of somatic variants for genes involved in malignant transformation |
| Hugo Symbol | Variant Class | Variant Classification | dbSNP RS | HGVSc | HGVSp | HGVSp Short | SWISSPROT | BIOTYPE | SIFT | PolyPhen | Tumor Sample Barcode | Tissue | Histology | Sex | Age | Stage | Therapy Types | Drugs | Outcome |
| C8orf88 | SNV | Missense_Mutation | novel | c.65N>T | p.Ser22Phe | p.S22F | P0DMB2 | protein_coding | deleterious(0.02) | probably_damaging(0.991) | TCGA-5L-AAT1-01 | Breast | breast invasive carcinoma | Female | <65 | III/IV | Hormone Therapy | letrozol | SD |
| C8orf88 | SNV | Missense_Mutation | novel | c.23N>T | p.Gly8Val | p.G8V | P0DMB2 | protein_coding | tolerated(0.26) | probably_damaging(1) | TCGA-LL-A5YP-01 | Breast | breast invasive carcinoma | Female | <65 | I/II | Chemotherapy | cytoxan | SD |
| C8orf88 | SNV | Missense_Mutation | novel | c.16T>G | p.Leu6Val | p.L6V | P0DMB2 | protein_coding | tolerated(0.22) | benign(0.138) | TCGA-AJ-A5DW-01 | Endometrium | uterine corpus endometrioid carcinoma | Female | <65 | I/II | Unknown | Unknown | SD |
| C8orf88 | SNV | Missense_Mutation | novel | c.128N>C | p.Ile43Thr | p.I43T | P0DMB2 | protein_coding | tolerated(0.09) | benign(0.03) | TCGA-B5-A3FA-01 | Endometrium | uterine corpus endometrioid carcinoma | Female | >=65 | I/II | Unknown | Unknown | SD |
| C8orf88 | SNV | Missense_Mutation | novel | c.233N>C | p.Lys78Thr | p.K78T | P0DMB2 | protein_coding | tolerated(0.83) | benign(0.365) | TCGA-EY-A1G8-01 | Endometrium | uterine corpus endometrioid carcinoma | Female | >=65 | I/II | Unknown | Unknown | SD |
| Page: 1 |
Top |
Related drugs of malignant transformation related genes |
| Identification of chemicals and drugs interact with genes involved in malignant transfromation |
| (DGIdb 4.0) |
| Entrez ID | Symbol | Category | Interaction Types | Drug Claim Name | Drug Name | PMIDs |
| Page: 1 |

Copyright 2023-Present -The University of Texas Health Science Center at Houston |