
|
|||||
|
 | |
| |
| |
| |
| |
| |
|
Gene: C8orf76 |
Gene summary for C8ORF76 |
| Gene information | Species | Human | Gene symbol | C8orf76 | Gene ID | 84933 |
| Gene name | chromosome 8 open reading frame 76 | |
| Gene Alias | C8orf76 | |
| Cytomap | 8q24.13 | |
| Gene Type | protein-coding | GO ID | NA | UniProtAcc | Q96K31 |
Top |
Malignant transformation analysis |
| Identification of the aberrant gene expression in precancerous and cancerous lesions by comparing the gene expression of stem-like cells in diseased tissues with normal stem cells |
| Entrez ID | Symbol | Replicates | Species | Organ | Tissue | Adj P-value | Log2FC | Malignancy |
| 84933 | C8orf76 | LZE4T | Human | Esophagus | ESCC | 7.45e-17 | 3.87e-01 | 0.0811 |
| 84933 | C8orf76 | LZE7T | Human | Esophagus | ESCC | 6.00e-04 | 3.37e-01 | 0.0667 |
| 84933 | C8orf76 | LZE8T | Human | Esophagus | ESCC | 4.99e-11 | 3.27e-01 | 0.067 |
| 84933 | C8orf76 | LZE20T | Human | Esophagus | ESCC | 1.67e-07 | 2.53e-01 | 0.0662 |
| 84933 | C8orf76 | LZE24T | Human | Esophagus | ESCC | 4.49e-23 | 4.67e-01 | 0.0596 |
| 84933 | C8orf76 | LZE21T | Human | Esophagus | ESCC | 9.56e-03 | 2.44e-01 | 0.0655 |
| 84933 | C8orf76 | LZE6T | Human | Esophagus | ESCC | 2.04e-02 | 2.90e-01 | 0.0845 |
| 84933 | C8orf76 | P1T-E | Human | Esophagus | ESCC | 4.30e-05 | 2.17e-01 | 0.0875 |
| 84933 | C8orf76 | P2T-E | Human | Esophagus | ESCC | 1.03e-23 | 4.56e-01 | 0.1177 |
| 84933 | C8orf76 | P4T-E | Human | Esophagus | ESCC | 1.08e-24 | 5.51e-01 | 0.1323 |
| 84933 | C8orf76 | P5T-E | Human | Esophagus | ESCC | 8.85e-23 | 4.47e-01 | 0.1327 |
| 84933 | C8orf76 | P8T-E | Human | Esophagus | ESCC | 1.79e-19 | 3.91e-01 | 0.0889 |
| 84933 | C8orf76 | P9T-E | Human | Esophagus | ESCC | 1.02e-21 | 4.94e-01 | 0.1131 |
| 84933 | C8orf76 | P10T-E | Human | Esophagus | ESCC | 1.99e-20 | 3.05e-01 | 0.116 |
| 84933 | C8orf76 | P11T-E | Human | Esophagus | ESCC | 1.35e-11 | 4.24e-01 | 0.1426 |
| 84933 | C8orf76 | P12T-E | Human | Esophagus | ESCC | 3.89e-40 | 5.87e-01 | 0.1122 |
| 84933 | C8orf76 | P15T-E | Human | Esophagus | ESCC | 1.93e-23 | 4.57e-01 | 0.1149 |
| 84933 | C8orf76 | P16T-E | Human | Esophagus | ESCC | 2.75e-30 | 6.05e-01 | 0.1153 |
| 84933 | C8orf76 | P17T-E | Human | Esophagus | ESCC | 2.75e-08 | 4.18e-01 | 0.1278 |
| 84933 | C8orf76 | P19T-E | Human | Esophagus | ESCC | 1.20e-05 | 4.40e-01 | 0.1662 |
| Page: 1 2 3 4 5 |
| Tissue | Expression Dynamics | Abbreviation |
| Esophagus | 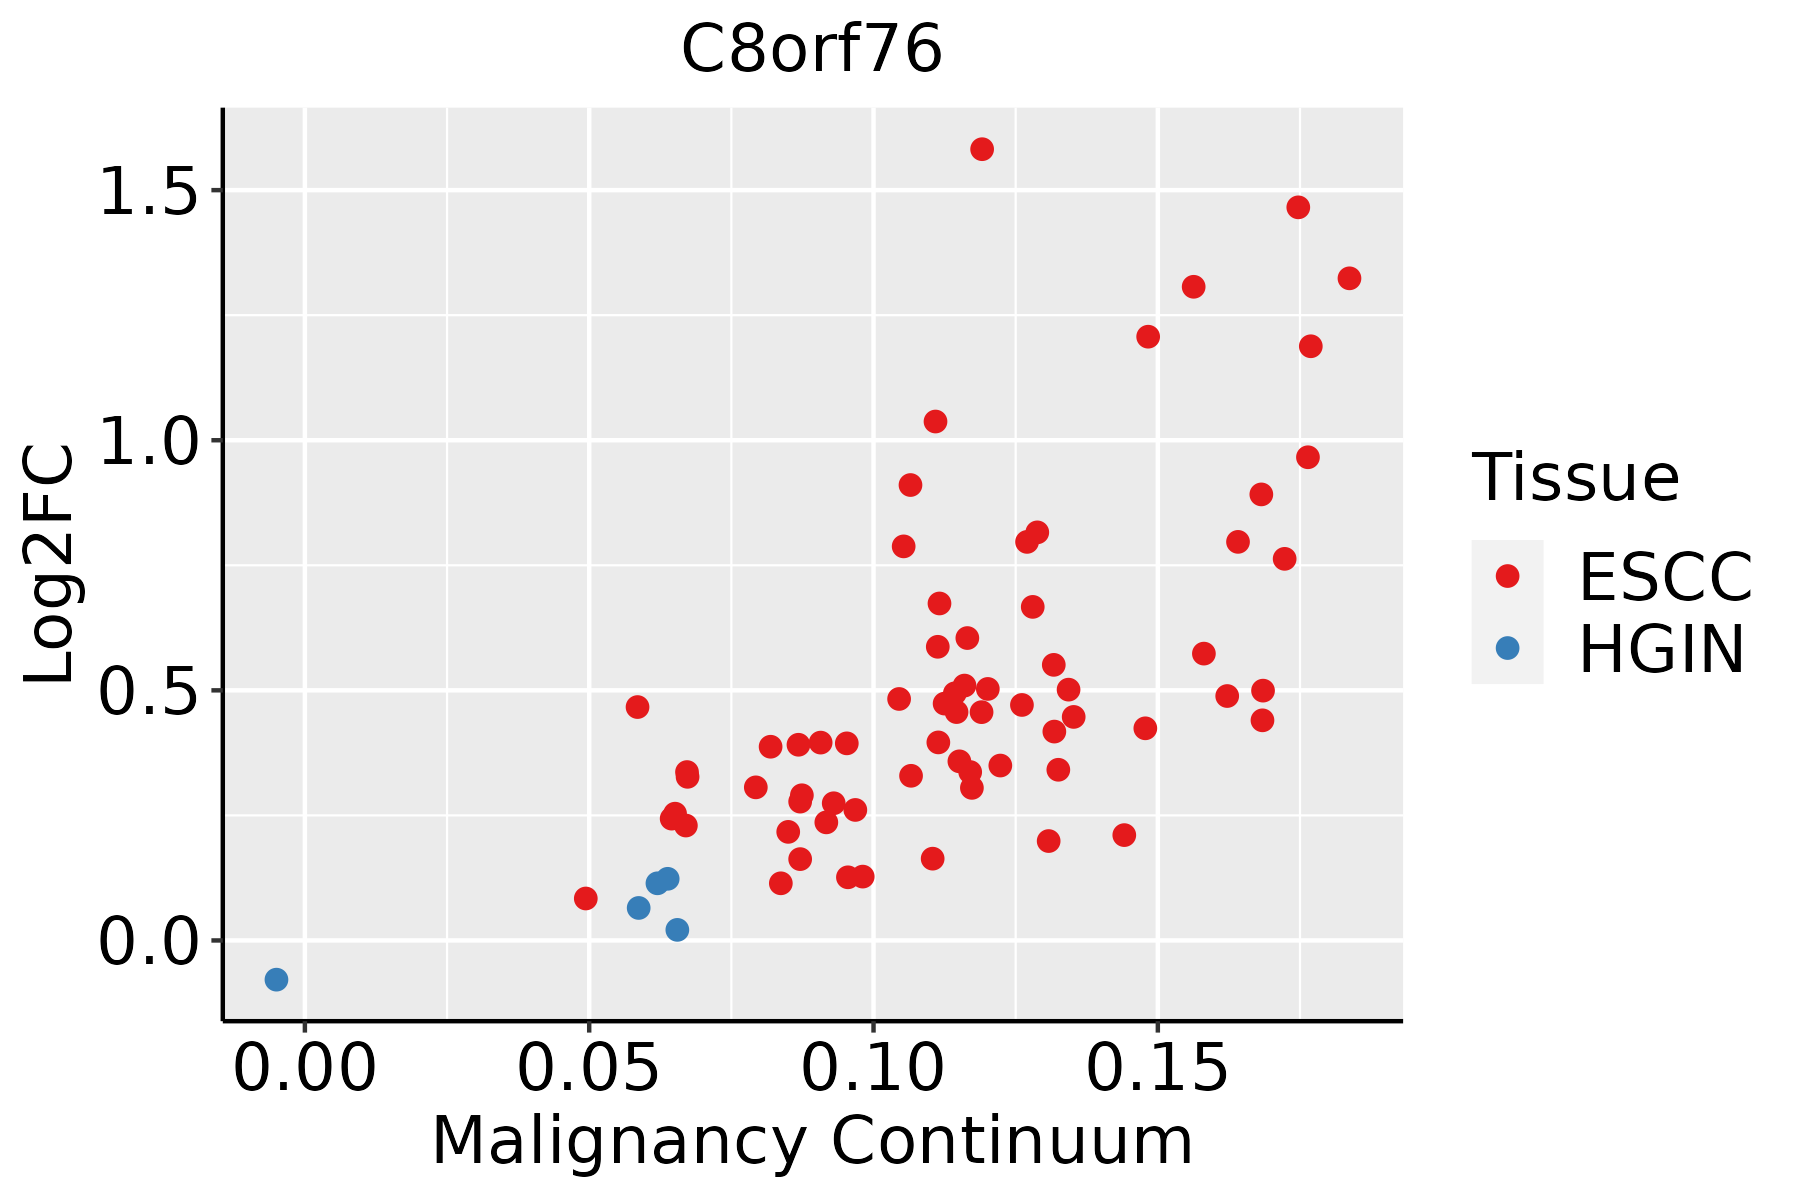 | ESCC: Esophageal squamous cell carcinoma |
| HGIN: High-grade intraepithelial neoplasias | ||
| LGIN: Low-grade intraepithelial neoplasias | ||
| Liver |  | HCC: Hepatocellular carcinoma |
| NAFLD: Non-alcoholic fatty liver disease | ||
| Oral Cavity | 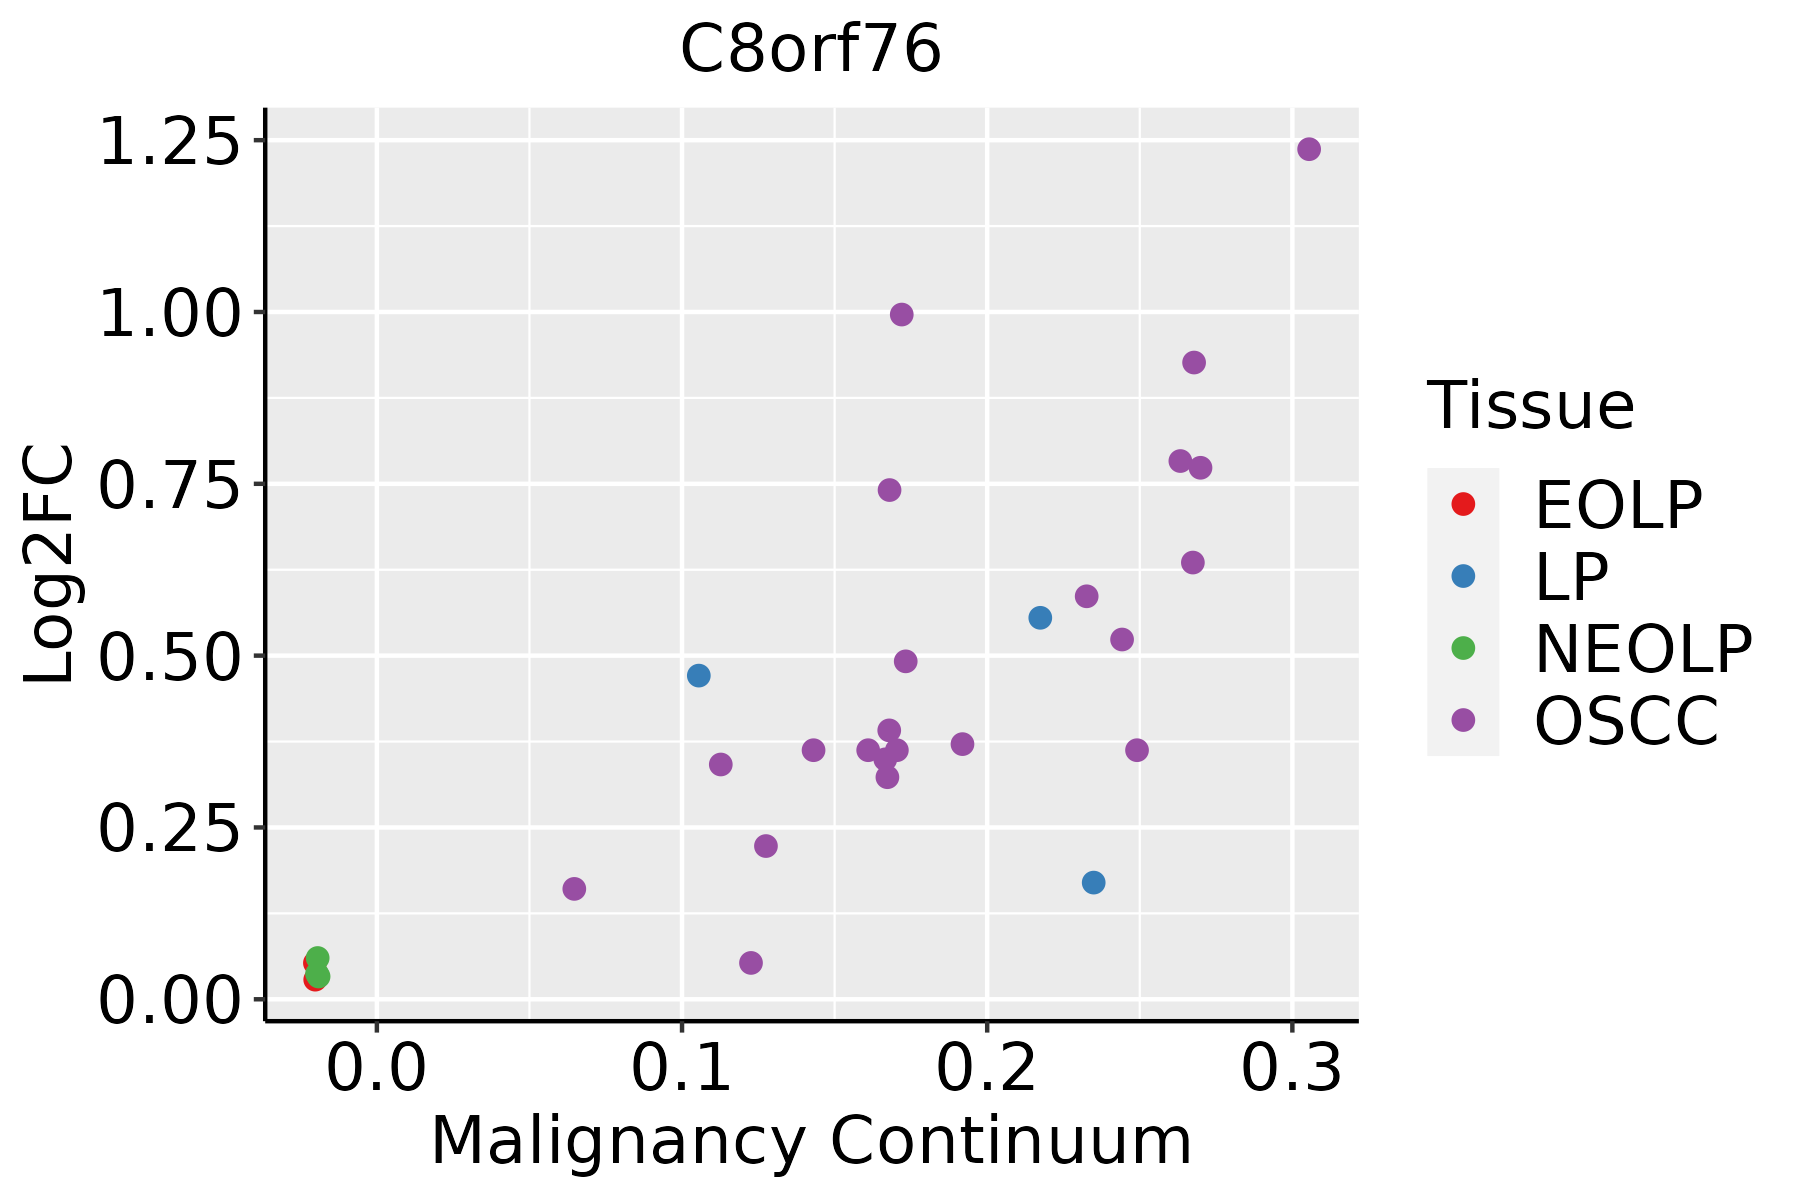 | EOLP: Erosive Oral lichen planus |
| LP: leukoplakia | ||
| NEOLP: Non-erosive oral lichen planus | ||
| OSCC: Oral squamous cell carcinoma |
| ∗log2FC in expression of this searched gene in stem-like cells from each diseased tissue sample relative to stem-like cells in normal samples in each tissue plotted against the malignancy continuum. Samples are colored based on if they are from different disease stage. |
Top |
Malignant transformation related pathway analysis |
| Find out the enriched GO biological processes and KEGG pathways involved in transition from healthy to precancer to cancer |
| Tissue | Disease Stage | Enriched GO biological Processes |
| Colorectum | AD |  |
| Colorectum | SER |  |
| Colorectum | MSS |  |
| Colorectum | MSI-H |  |
| Colorectum | FAP |  |
| ∗Top 15 enriched GO BP terms are showed in the bar plot of each disease state in each tissue. Each row represents a significant GO biological process which is colored according to the -log10(p.adjust). |
| Page: 1 2 3 4 5 6 7 8 9 |
| GO ID | Tissue | Disease Stage | Description | Gene Ratio | Bg Ratio | pvalue | p.adjust | Count |
| Page: 1 |
| Pathway ID | Tissue | Disease Stage | Description | Gene Ratio | Bg Ratio | pvalue | p.adjust | qvalue | Count |
| Page: 1 |
Top |
Cell-cell communication analysis |
| Identification of potential cell-cell interactions between two cell types and their ligand-receptor pairs for different disease states |
| Ligand | Receptor | LRpair | Pathway | Tissue | Disease Stage |
| Page: 1 |
Top |
Single-cell gene regulatory network inference analysis |
| Find out the significant the regulons (TFs) and the target genes of each regulon across cell types for different disease states |
| TF | Cell Type | Tissue | Disease Stage | Target Gene | RSS | Regulon Activity |
| ∗The dot plots of a searched regulon are shown for all cell subpopulations in each disease state of each tissue based on the regulon specific score inferred using pySCENIC and by calculating the average expression. |
| Page: 1 |
Top |
Somatic mutation of malignant transformation related genes |
| Annotation of somatic variants for genes involved in malignant transformation |
| Hugo Symbol | Variant Class | Variant Classification | dbSNP RS | HGVSc | HGVSp | HGVSp Short | SWISSPROT | BIOTYPE | SIFT | PolyPhen | Tumor Sample Barcode | Tissue | Histology | Sex | Age | Stage | Therapy Types | Drugs | Outcome |
| C8orf76 | SNV | Missense_Mutation | novel | c.1010N>C | p.Val337Ala | p.V337A | Q96K31 | protein_coding | tolerated(0.13) | possibly_damaging(0.54) | TCGA-GI-A2C9-01 | Breast | breast invasive carcinoma | Female | <65 | I/II | Unspecific | SD | |
| C8orf76 | insertion | Nonsense_Mutation | novel | c.358-1_358insCCTAGAACTTTTTGAAGCTTAAAATTA | p.Leu119_Glu120insProArgThrPheTerSerLeuLysLeu | p.L119_E120insPRTF*SLKL | Q96K31 | protein_coding | TCGA-A8-A085-01 | Breast | breast invasive carcinoma | Male | <65 | I/II | Hormone Therapy | tamoxiphen | SD | ||
| C8orf76 | insertion | In_Frame_Ins | novel | c.471_472insAACTATGCGGGCCGGGCGCGG | p.Ile157_Ser158insAsnTyrAlaGlyArgAlaArg | p.I157_S158insNYAGRAR | Q96K31 | protein_coding | TCGA-B6-A0RE-01 | Breast | breast invasive carcinoma | Female | <65 | I/II | Unknown | Unknown | SD | ||
| C8orf76 | deletion | Frame_Shift_Del | novel | c.633_634delNN | p.Asp211GlufsTer7 | p.D211Efs*7 | Q96K31 | protein_coding | TCGA-E2-A1II-01 | Breast | breast invasive carcinoma | Female | <65 | I/II | Chemotherapy | doxorubicin | SD | ||
| C8orf76 | SNV | Missense_Mutation | rs374975138 | c.851N>T | p.Ser284Leu | p.S284L | Q96K31 | protein_coding | deleterious(0) | probably_damaging(0.998) | TCGA-VS-A94Z-01 | Cervix | cervical & endocervical cancer | Female | <65 | I/II | Chemotherapy | cisplatin | CR |
| C8orf76 | SNV | Missense_Mutation | rs559914198 | c.902T>C | p.Met301Thr | p.M301T | Q96K31 | protein_coding | deleterious(0) | benign(0.058) | TCGA-AM-5821-01 | Colorectum | colon adenocarcinoma | Female | >=65 | I/II | Unknown | Unknown | SD |
| C8orf76 | SNV | Missense_Mutation | c.761N>G | p.Glu254Gly | p.E254G | Q96K31 | protein_coding | tolerated(0.15) | benign(0) | TCGA-CM-5348-01 | Colorectum | colon adenocarcinoma | Male | >=65 | III/IV | Unknown | Unknown | SD | |
| C8orf76 | SNV | Missense_Mutation | c.297N>T | p.Gln99His | p.Q99H | Q96K31 | protein_coding | deleterious(0) | probably_damaging(0.919) | TCGA-A5-A0G1-01 | Endometrium | uterine corpus endometrioid carcinoma | Female | >=65 | I/II | Unknown | Unknown | SD | |
| C8orf76 | SNV | Missense_Mutation | novel | c.473C>A | p.Ser158Tyr | p.S158Y | Q96K31 | protein_coding | deleterious(0.01) | possibly_damaging(0.891) | TCGA-A5-A2K5-01 | Endometrium | uterine corpus endometrioid carcinoma | Female | >=65 | I/II | Unknown | Unknown | SD |
| C8orf76 | SNV | Missense_Mutation | c.547N>A | p.Ala183Thr | p.A183T | Q96K31 | protein_coding | tolerated(0.28) | benign(0.003) | TCGA-AP-A059-01 | Endometrium | uterine corpus endometrioid carcinoma | Female | >=65 | I/II | Unknown | Unknown | SD |
| Page: 1 2 3 |
Top |
Related drugs of malignant transformation related genes |
| Identification of chemicals and drugs interact with genes involved in malignant transfromation |
| (DGIdb 4.0) |
| Entrez ID | Symbol | Category | Interaction Types | Drug Claim Name | Drug Name | PMIDs |
| Page: 1 |

Copyright 2023-Present -The University of Texas Health Science Center at Houston |