
|
|||||
|
 | |
| |
| |
| |
| |
| |
|
Gene: C8orf59 |
Gene summary for C8ORF59 |
| Gene information | Species | Human | Gene symbol | C8orf59 | Gene ID | 401466 |
| Gene name | ribosomal biogenesis factor | |
| Gene Alias | C8orf59 | |
| Cytomap | 8q21.2 | |
| Gene Type | protein-coding | GO ID | GO:0008150 | UniProtAcc | A0A024R838 |
Top |
Malignant transformation analysis |
| Identification of the aberrant gene expression in precancerous and cancerous lesions by comparing the gene expression of stem-like cells in diseased tissues with normal stem cells |
| Entrez ID | Symbol | Replicates | Species | Organ | Tissue | Adj P-value | Log2FC | Malignancy |
| 401466 | C8orf59 | GSM4909281 | Human | Breast | IDC | 1.20e-29 | 6.58e-01 | 0.21 |
| 401466 | C8orf59 | GSM4909285 | Human | Breast | IDC | 6.52e-06 | 2.78e-01 | 0.21 |
| 401466 | C8orf59 | GSM4909287 | Human | Breast | IDC | 6.03e-04 | 3.13e-01 | 0.2057 |
| 401466 | C8orf59 | GSM4909290 | Human | Breast | IDC | 2.48e-12 | 5.23e-01 | 0.2096 |
| 401466 | C8orf59 | GSM4909292 | Human | Breast | IDC | 8.96e-05 | 6.36e-01 | 0.1236 |
| 401466 | C8orf59 | GSM4909294 | Human | Breast | IDC | 1.39e-09 | 2.43e-01 | 0.2022 |
| 401466 | C8orf59 | GSM4909296 | Human | Breast | IDC | 1.57e-11 | 3.07e-01 | 0.1524 |
| 401466 | C8orf59 | GSM4909297 | Human | Breast | IDC | 9.25e-12 | -9.51e-02 | 0.1517 |
| 401466 | C8orf59 | GSM4909301 | Human | Breast | IDC | 4.39e-05 | -2.03e-01 | 0.1577 |
| 401466 | C8orf59 | GSM4909306 | Human | Breast | IDC | 2.71e-04 | 2.79e-01 | 0.1564 |
| 401466 | C8orf59 | GSM4909311 | Human | Breast | IDC | 2.98e-34 | 1.09e-01 | 0.1534 |
| 401466 | C8orf59 | GSM4909312 | Human | Breast | IDC | 4.14e-31 | 4.58e-01 | 0.1552 |
| 401466 | C8orf59 | GSM4909316 | Human | Breast | IDC | 3.51e-03 | 3.04e-01 | 0.21 |
| 401466 | C8orf59 | GSM4909317 | Human | Breast | IDC | 2.42e-18 | 5.61e-01 | 0.1355 |
| 401466 | C8orf59 | GSM4909318 | Human | Breast | IDC | 1.67e-10 | 6.90e-01 | 0.2031 |
| 401466 | C8orf59 | GSM4909319 | Human | Breast | IDC | 3.11e-41 | -1.71e-01 | 0.1563 |
| 401466 | C8orf59 | GSM4909320 | Human | Breast | IDC | 1.23e-06 | -1.22e-01 | 0.1575 |
| 401466 | C8orf59 | GSM4909321 | Human | Breast | IDC | 3.18e-14 | -8.63e-02 | 0.1559 |
| 401466 | C8orf59 | brca2 | Human | Breast | Precancer | 1.17e-08 | 2.87e-01 | -0.024 |
| 401466 | C8orf59 | M2 | Human | Breast | IDC | 2.83e-02 | 2.60e-01 | 0.21 |
| Page: 1 2 3 4 5 6 7 8 9 10 11 12 |
| Tissue | Expression Dynamics | Abbreviation |
| Breast |  | IDC: Invasive ductal carcinoma |
| DCIS: Ductal carcinoma in situ | ||
| Precancer(BRCA1-mut): Precancerous lesion from BRCA1 mutation carriers | ||
| Endometrium | 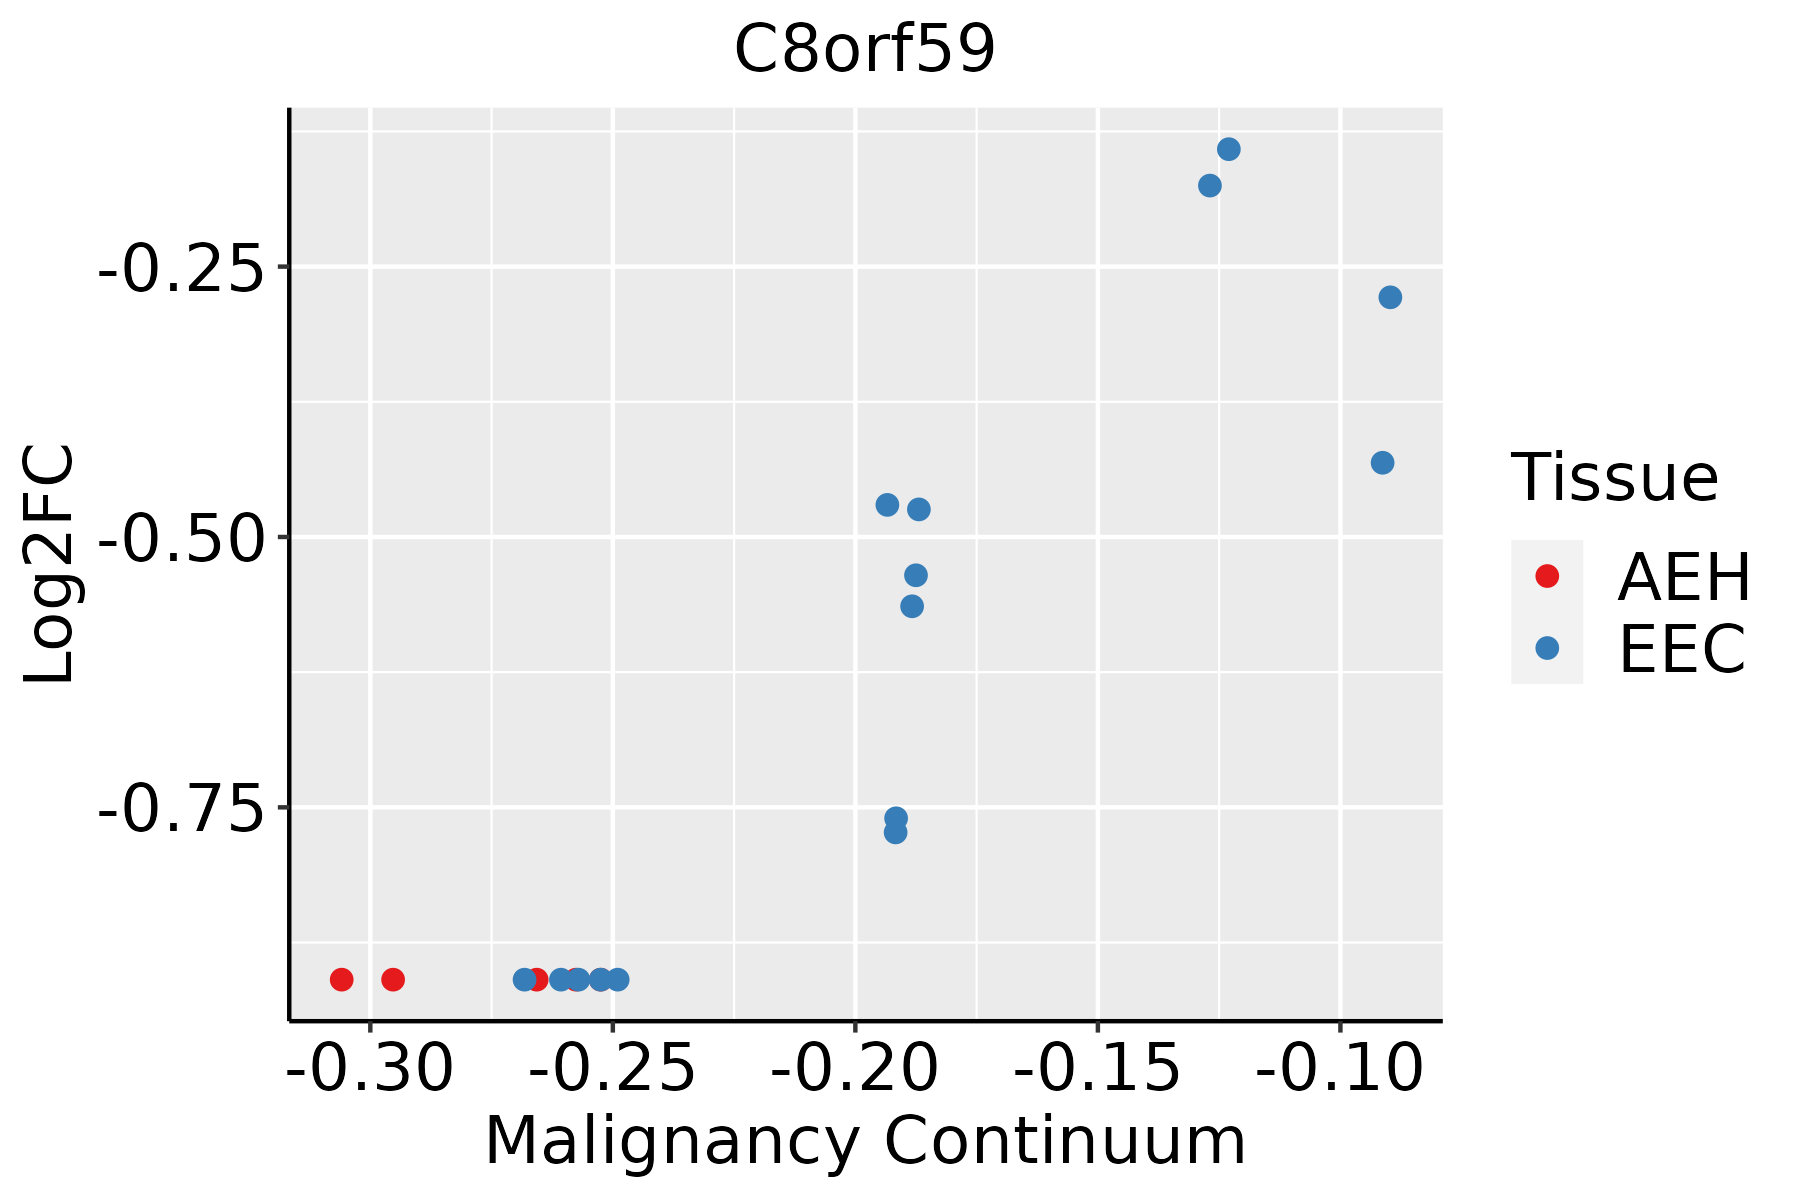 | AEH: Atypical endometrial hyperplasia |
| EEC: Endometrioid Cancer | ||
| Esophagus | 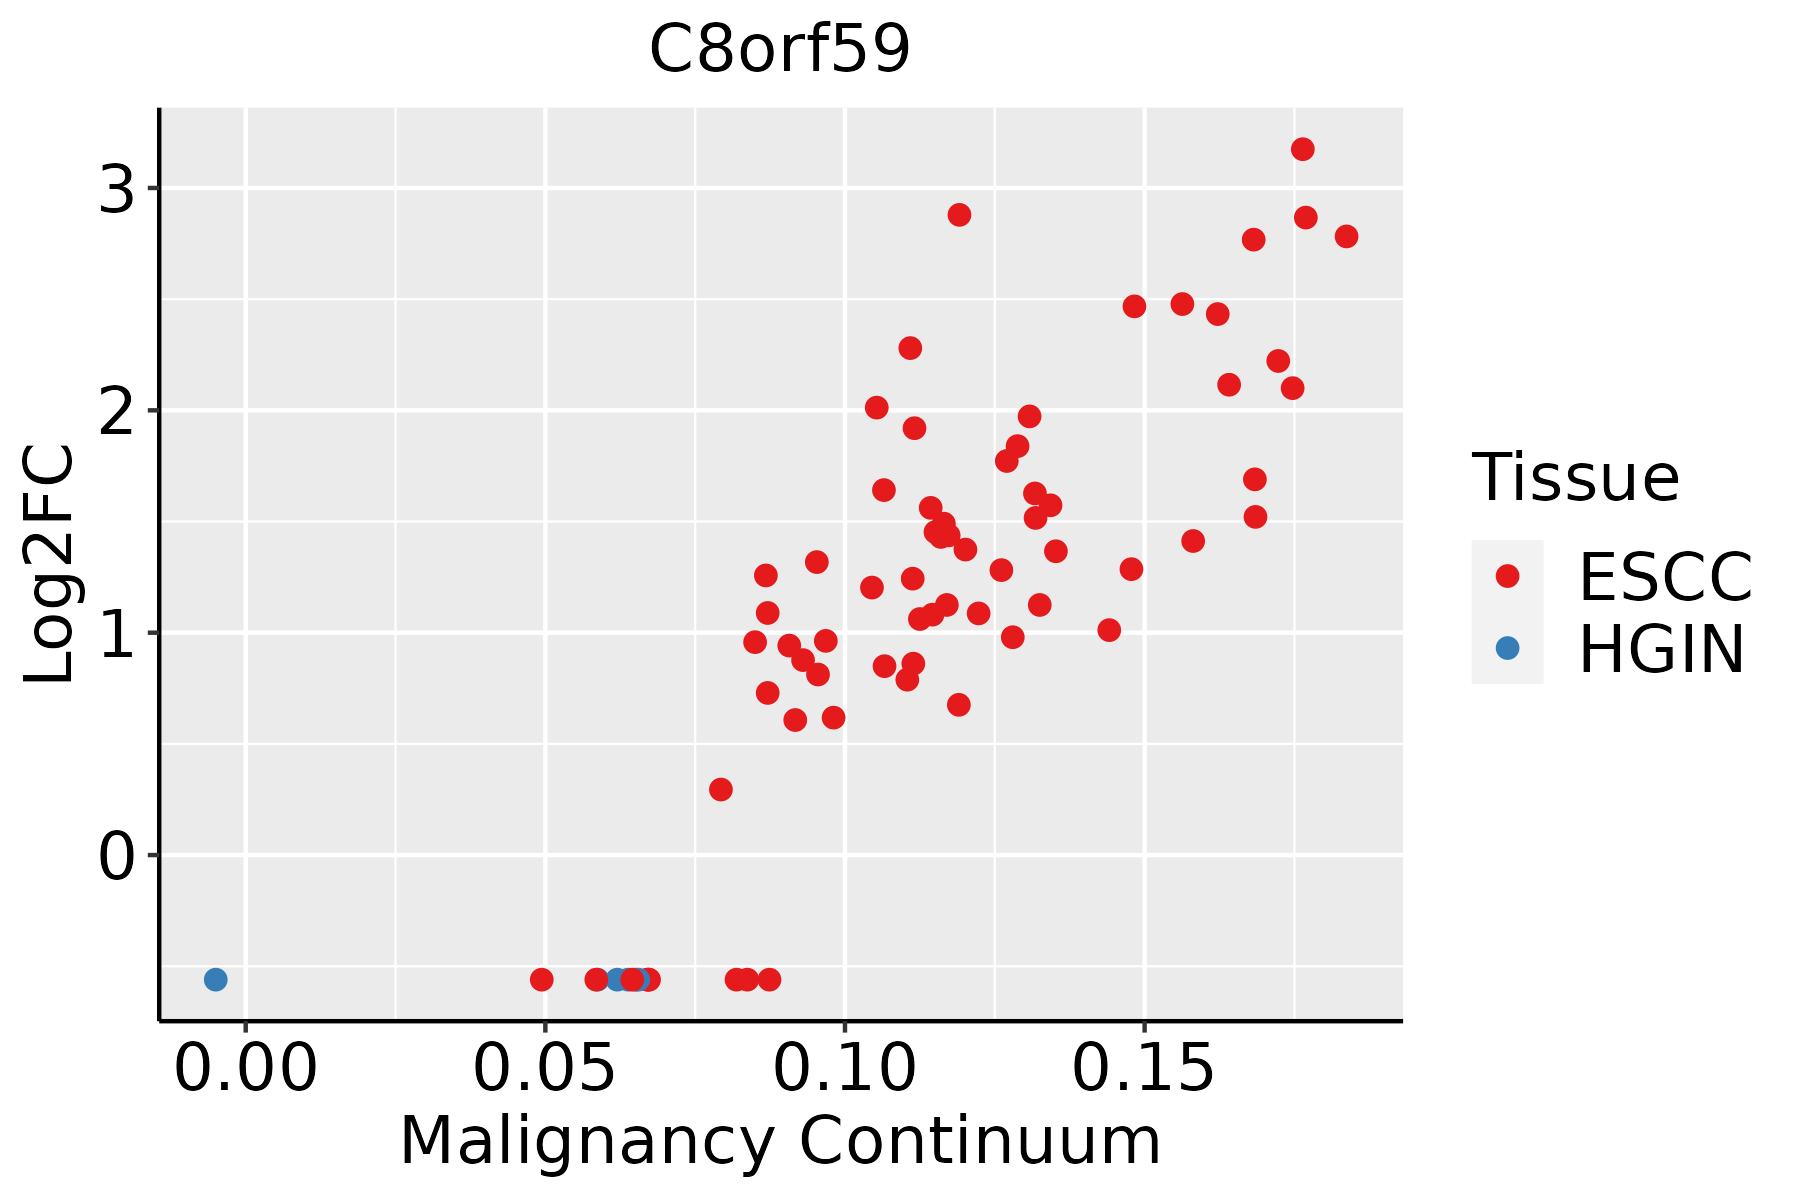 | ESCC: Esophageal squamous cell carcinoma |
| HGIN: High-grade intraepithelial neoplasias | ||
| LGIN: Low-grade intraepithelial neoplasias | ||
| GC |  | CAG: Chronic atrophic gastritis |
| CAG with IM: Chronic atrophic gastritis with intestinal metaplasia | ||
| CSG: Chronic superficial gastritis | ||
| GC: Gastric cancer | ||
| SIM: Severe intestinal metaplasia | ||
| WIM: Wild intestinal metaplasia | ||
| Liver |  | HCC: Hepatocellular carcinoma |
| NAFLD: Non-alcoholic fatty liver disease | ||
| Oral Cavity | 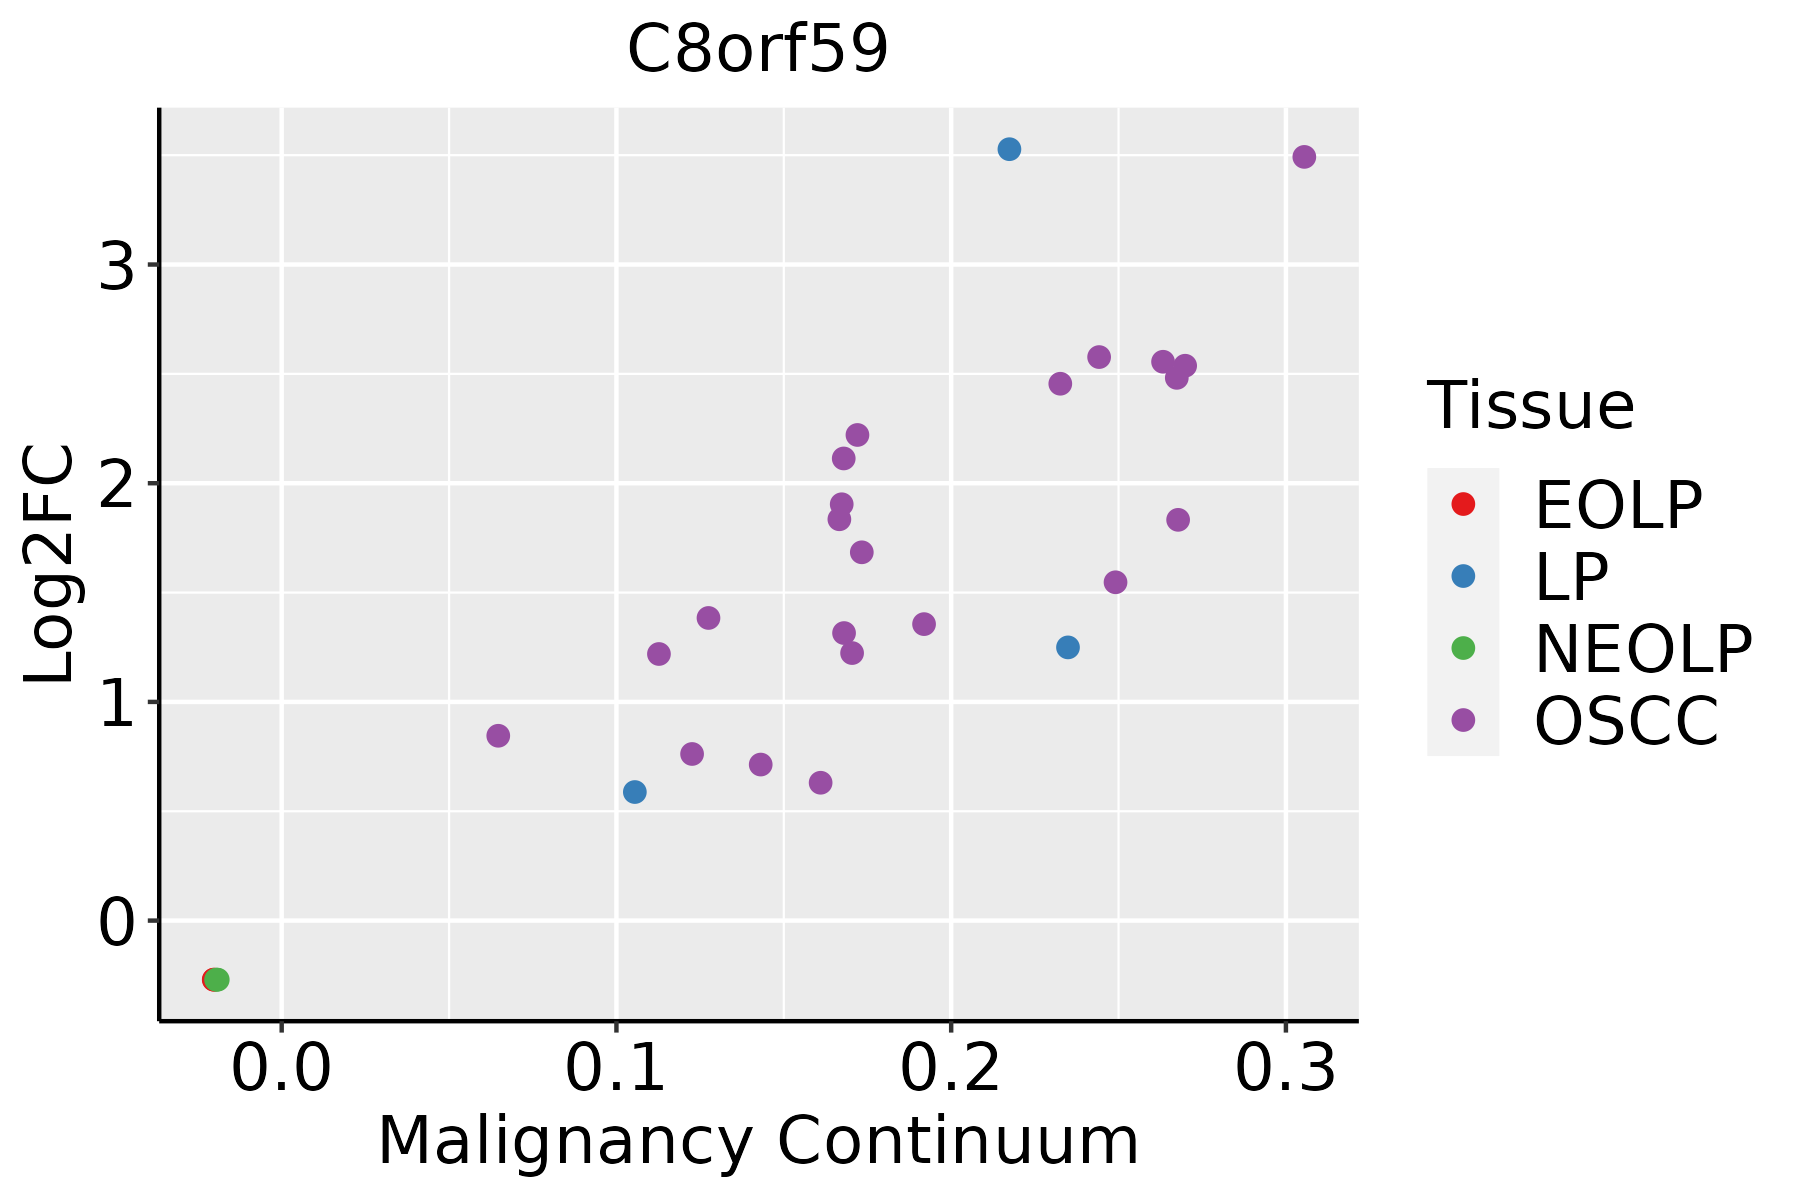 | EOLP: Erosive Oral lichen planus |
| LP: leukoplakia | ||
| NEOLP: Non-erosive oral lichen planus | ||
| OSCC: Oral squamous cell carcinoma | ||
| Prostate | 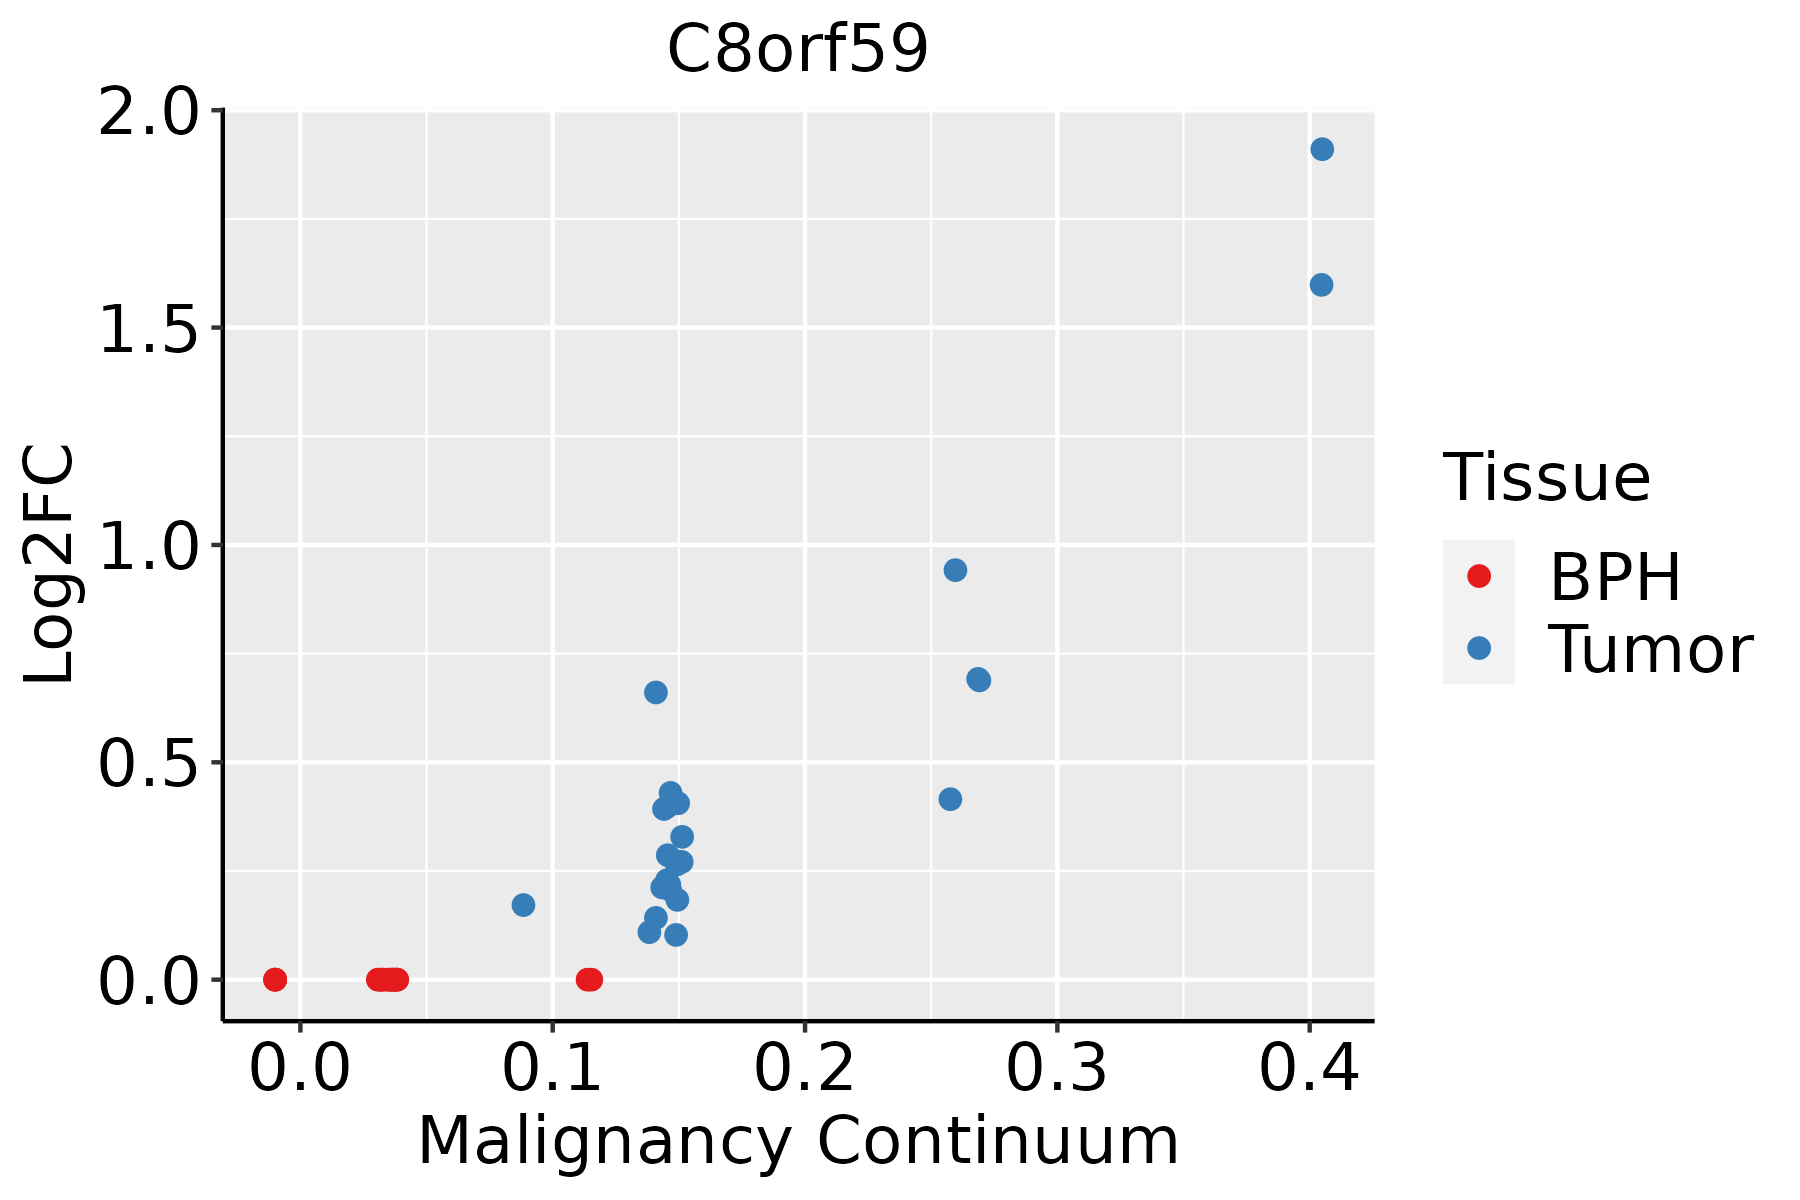 | BPH: Benign Prostatic Hyperplasia |
| Skin | 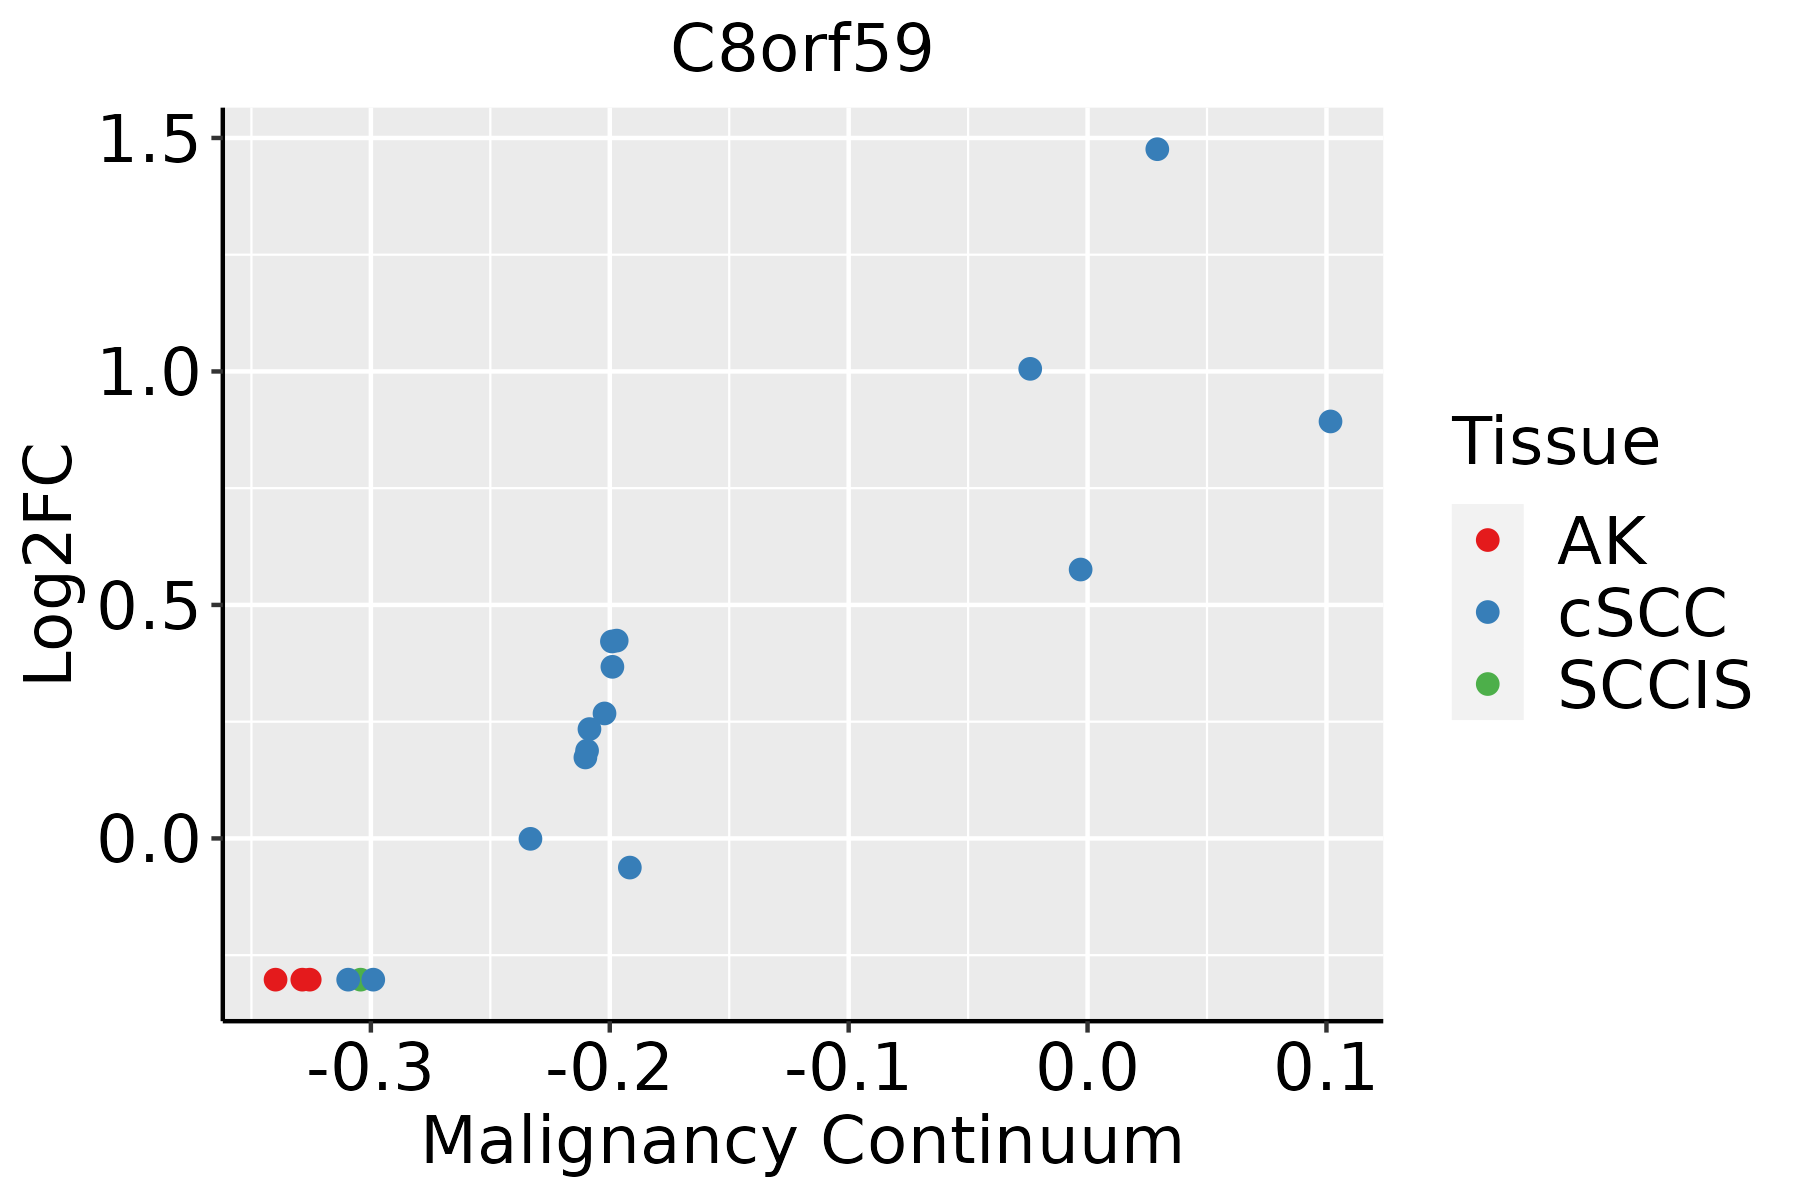 | AK: Actinic keratosis |
| cSCC: Cutaneous squamous cell carcinoma | ||
| SCCIS:squamous cell carcinoma in situ | ||
| Thyroid |  | ATC: Anaplastic thyroid cancer |
| HT: Hashimoto's thyroiditis | ||
| PTC: Papillary thyroid cancer |
| ∗log2FC in expression of this searched gene in stem-like cells from each diseased tissue sample relative to stem-like cells in normal samples in each tissue plotted against the malignancy continuum. Samples are colored based on if they are from different disease stage. |
Top |
Malignant transformation related pathway analysis |
| Find out the enriched GO biological processes and KEGG pathways involved in transition from healthy to precancer to cancer |
| Tissue | Disease Stage | Enriched GO biological Processes |
| Colorectum | AD |  |
| Colorectum | SER |  |
| Colorectum | MSS |  |
| Colorectum | MSI-H |  |
| Colorectum | FAP |  |
| ∗Top 15 enriched GO BP terms are showed in the bar plot of each disease state in each tissue. Each row represents a significant GO biological process which is colored according to the -log10(p.adjust). |
| Page: 1 2 3 4 5 6 7 8 9 |
| GO ID | Tissue | Disease Stage | Description | Gene Ratio | Bg Ratio | pvalue | p.adjust | Count |
| Page: 1 |
| Pathway ID | Tissue | Disease Stage | Description | Gene Ratio | Bg Ratio | pvalue | p.adjust | qvalue | Count |
| Page: 1 |
Top |
Cell-cell communication analysis |
| Identification of potential cell-cell interactions between two cell types and their ligand-receptor pairs for different disease states |
| Ligand | Receptor | LRpair | Pathway | Tissue | Disease Stage |
| Page: 1 |
Top |
Single-cell gene regulatory network inference analysis |
| Find out the significant the regulons (TFs) and the target genes of each regulon across cell types for different disease states |
| TF | Cell Type | Tissue | Disease Stage | Target Gene | RSS | Regulon Activity |
| ∗The dot plots of a searched regulon are shown for all cell subpopulations in each disease state of each tissue based on the regulon specific score inferred using pySCENIC and by calculating the average expression. |
| Page: 1 |
Top |
Somatic mutation of malignant transformation related genes |
| Annotation of somatic variants for genes involved in malignant transformation |
| Hugo Symbol | Variant Class | Variant Classification | dbSNP RS | HGVSc | HGVSp | HGVSp Short | SWISSPROT | BIOTYPE | SIFT | PolyPhen | Tumor Sample Barcode | Tissue | Histology | Sex | Age | Stage | Therapy Types | Drugs | Outcome |
| C8orf59 | SNV | Missense_Mutation | c.114N>T | p.Lys38Asn | p.K38N | Q8N0T1 | protein_coding | deleterious(0.01) | probably_damaging(0.964) | TCGA-A6-5665-01 | Colorectum | colon adenocarcinoma | Female | >=65 | I/II | Unknown | Unknown | PD | |
| C8orf59 | SNV | Missense_Mutation | novel | c.67N>G | p.Phe23Val | p.F23V | Q8N0T1 | protein_coding | tolerated(0.15) | benign(0.031) | TCGA-CA-6717-01 | Colorectum | colon adenocarcinoma | Male | <65 | I/II | Chemotherapy | oxaliplatin | CR |
| C8orf59 | deletion | Frame_Shift_Del | rs752886571 | c.65delN | p.Asn22ThrfsTer18 | p.N22Tfs*18 | Q8N0T1 | protein_coding | TCGA-AD-A5EJ-01 | Colorectum | colon adenocarcinoma | Female | >=65 | I/II | Unknown | Unknown | SD | ||
| C8orf59 | SNV | Missense_Mutation | c.68N>G | p.Phe23Cys | p.F23C | Q8N0T1 | protein_coding | deleterious(0.03) | possibly_damaging(0.794) | TCGA-D1-A103-01 | Endometrium | uterine corpus endometrioid carcinoma | Female | >=65 | I/II | Unknown | Unknown | SD | |
| C8orf59 | SNV | Missense_Mutation | novel | c.235N>T | p.Pro79Ser | p.P79S | Q8N0T1 | protein_coding | tolerated(0.45) | benign(0.027) | TCGA-E6-A1LX-01 | Endometrium | uterine corpus endometrioid carcinoma | Female | <65 | I/II | Unknown | Unknown | SD |
| C8orf59 | SNV | Missense_Mutation | novel | c.116N>C | p.Ile39Thr | p.I39T | Q8N0T1 | protein_coding | deleterious(0.02) | probably_damaging(0.999) | TCGA-E6-A1LX-01 | Endometrium | uterine corpus endometrioid carcinoma | Female | <65 | I/II | Unknown | Unknown | SD |
| C8orf59 | SNV | Missense_Mutation | novel | c.41T>C | p.Val14Ala | p.V14A | Q8N0T1 | protein_coding | deleterious(0.03) | probably_damaging(0.996) | TCGA-FI-A2D5-01 | Endometrium | uterine corpus endometrioid carcinoma | Female | <65 | III/IV | Chemotherapy | carboplatinum | PD |
| C8orf59 | SNV | Missense_Mutation | novel | c.168N>A | p.Asn56Lys | p.N56K | Q8N0T1 | protein_coding | deleterious(0.05) | benign(0.053) | TCGA-PG-A917-01 | Endometrium | uterine corpus endometrioid carcinoma | Female | >=65 | I/II | Unknown | Unknown | SD |
| C8orf59 | SNV | Missense_Mutation | novel | c.197A>T | p.Lys66Ile | p.K66I | Q8N0T1 | protein_coding | deleterious(0) | possibly_damaging(0.509) | TCGA-BA-4075-01 | Oral cavity | head & neck squamous cell carcinoma | Male | <65 | III/IV | Chemotherapy | carboplatin | PD |
| C8orf59 | SNV | Missense_Mutation | novel | c.275N>G | p.Glu92Gly | p.E92G | Q8N0T1 | protein_coding | tolerated(0.14) | possibly_damaging(0.523) | TCGA-CV-6948-01 | Oral cavity | head & neck squamous cell carcinoma | Female | >=65 | I/II | Unknown | Unknown | SD |
| Page: 1 2 |
Top |
Related drugs of malignant transformation related genes |
| Identification of chemicals and drugs interact with genes involved in malignant transfromation |
| (DGIdb 4.0) |
| Entrez ID | Symbol | Category | Interaction Types | Drug Claim Name | Drug Name | PMIDs |
| Page: 1 |

Copyright 2023-Present -The University of Texas Health Science Center at Houston |