
|
|||||
|
 | |
| |
| |
| |
| |
| |
|
Gene: C8orf4 |
Gene summary for C8ORF4 |
| Gene information | Species | Human | Gene symbol | C8orf4 | Gene ID | 56892 |
| Gene name | transcriptional and immune response regulator | |
| Gene Alias | C8orf4 | |
| Cytomap | 8p11.21 | |
| Gene Type | protein-coding | GO ID | GO:0001775 | UniProtAcc | Q9NR00 |
Top |
Malignant transformation analysis |
| Identification of the aberrant gene expression in precancerous and cancerous lesions by comparing the gene expression of stem-like cells in diseased tissues with normal stem cells |
| Entrez ID | Symbol | Replicates | Species | Organ | Tissue | Adj P-value | Log2FC | Malignancy |
| 56892 | C8orf4 | GSM4909281 | Human | Breast | IDC | 7.27e-12 | -4.36e-01 | 0.21 |
| 56892 | C8orf4 | GSM4909282 | Human | Breast | IDC | 6.74e-13 | -4.36e-01 | -0.0288 |
| 56892 | C8orf4 | GSM4909285 | Human | Breast | IDC | 3.30e-12 | -4.36e-01 | 0.21 |
| 56892 | C8orf4 | GSM4909286 | Human | Breast | IDC | 7.27e-12 | -4.36e-01 | 0.1081 |
| 56892 | C8orf4 | GSM4909287 | Human | Breast | IDC | 5.13e-15 | -4.36e-01 | 0.2057 |
| 56892 | C8orf4 | GSM4909288 | Human | Breast | IDC | 9.46e-03 | -4.36e-01 | 0.0988 |
| 56892 | C8orf4 | GSM4909290 | Human | Breast | IDC | 1.80e-10 | -4.36e-01 | 0.2096 |
| 56892 | C8orf4 | GSM4909291 | Human | Breast | IDC | 2.68e-08 | -4.36e-01 | 0.1753 |
| 56892 | C8orf4 | GSM4909293 | Human | Breast | IDC | 3.04e-13 | -4.36e-01 | 0.1581 |
| 56892 | C8orf4 | GSM4909294 | Human | Breast | IDC | 1.60e-11 | -4.36e-01 | 0.2022 |
| 56892 | C8orf4 | GSM4909295 | Human | Breast | IDC | 2.63e-06 | -4.36e-01 | 0.0898 |
| 56892 | C8orf4 | GSM4909296 | Human | Breast | IDC | 3.30e-12 | -4.36e-01 | 0.1524 |
| 56892 | C8orf4 | GSM4909297 | Human | Breast | IDC | 7.27e-12 | -4.36e-01 | 0.1517 |
| 56892 | C8orf4 | GSM4909298 | Human | Breast | IDC | 7.27e-12 | -4.36e-01 | 0.1551 |
| 56892 | C8orf4 | GSM4909299 | Human | Breast | IDC | 1.49e-12 | -4.36e-01 | 0.035 |
| 56892 | C8orf4 | GSM4909300 | Human | Breast | IDC | 1.90e-05 | -4.36e-01 | 0.0334 |
| 56892 | C8orf4 | GSM4909301 | Human | Breast | IDC | 3.30e-12 | -4.36e-01 | 0.1577 |
| 56892 | C8orf4 | GSM4909302 | Human | Breast | IDC | 8.70e-15 | -4.36e-01 | 0.1545 |
| 56892 | C8orf4 | GSM4909303 | Human | Breast | IDC | 2.85e-03 | -4.36e-01 | 0.0438 |
| 56892 | C8orf4 | GSM4909304 | Human | Breast | IDC | 1.60e-11 | -4.36e-01 | 0.1636 |
| Page: 1 2 3 4 5 6 7 8 |
| Tissue | Expression Dynamics | Abbreviation |
| Breast | 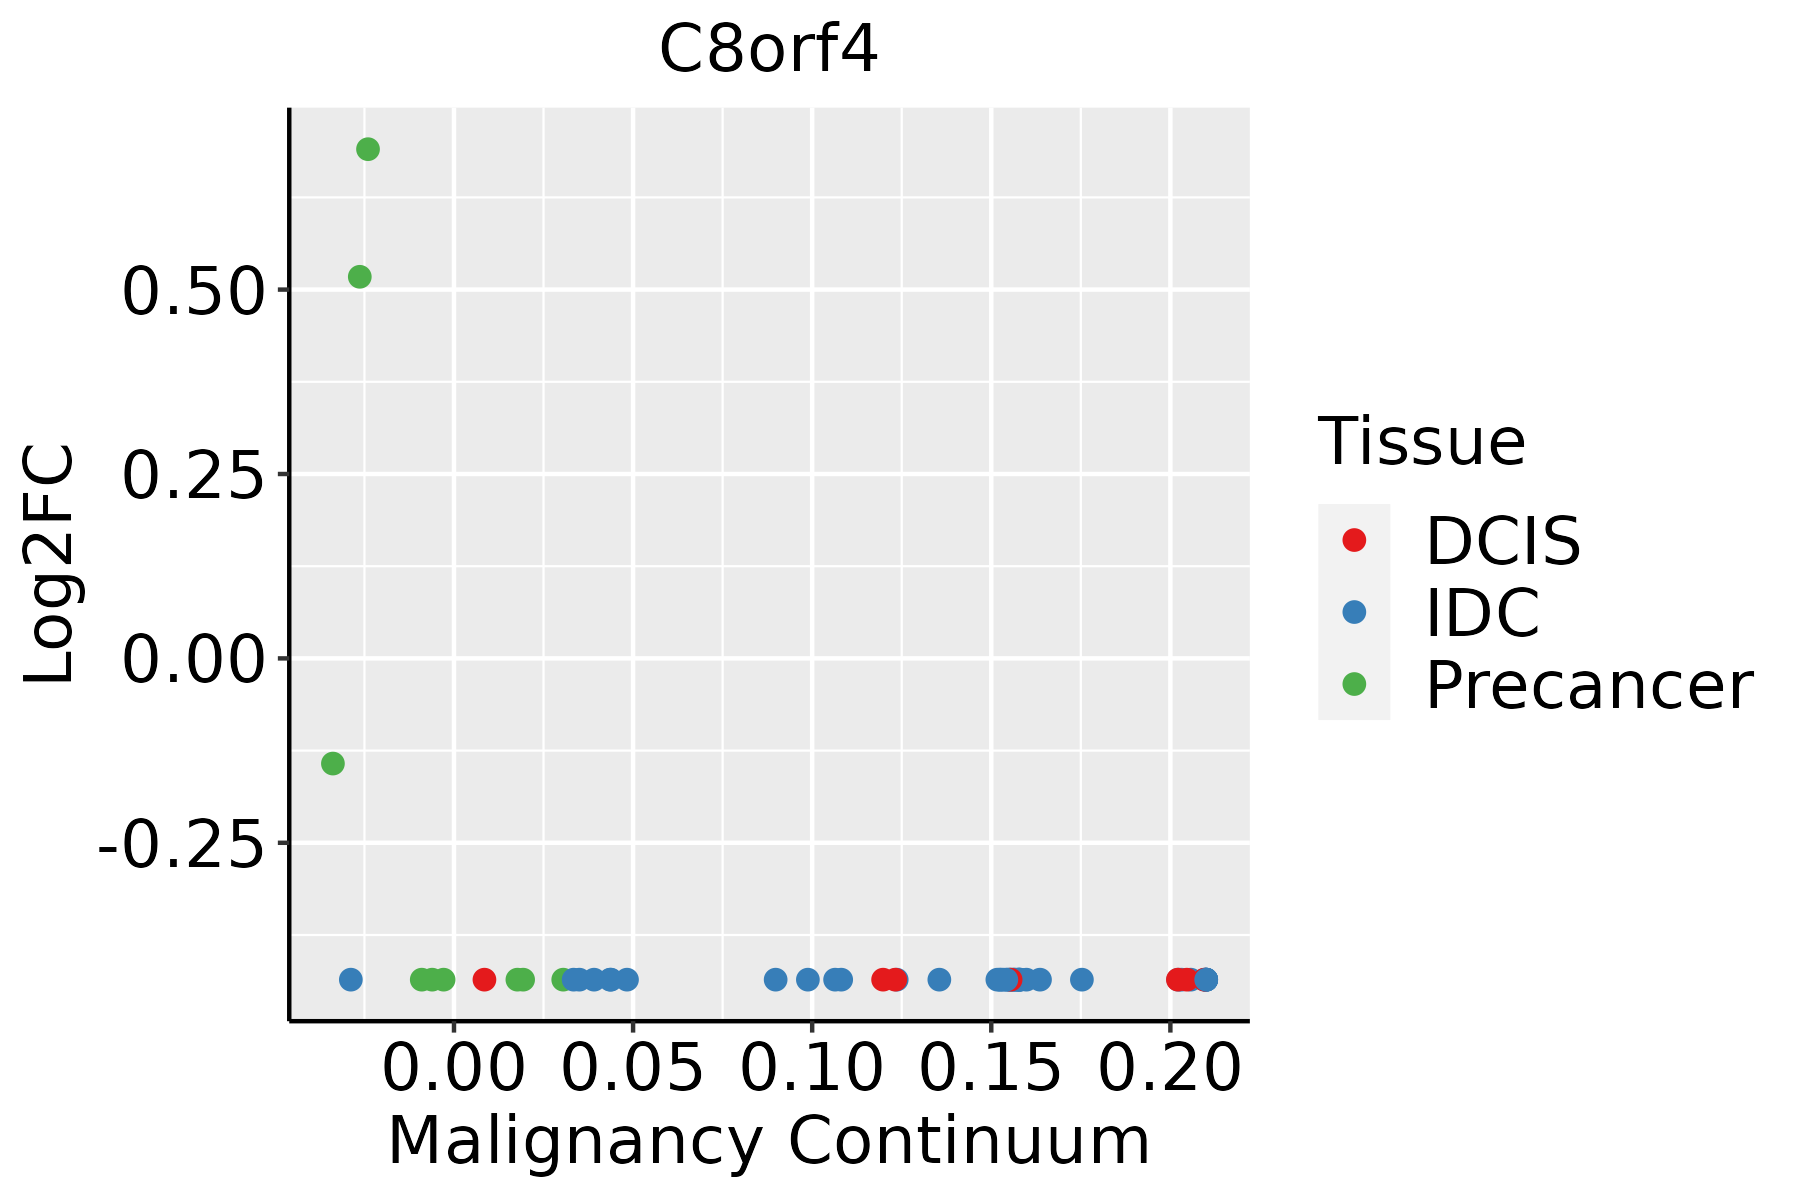 | IDC: Invasive ductal carcinoma |
| DCIS: Ductal carcinoma in situ | ||
| Precancer(BRCA1-mut): Precancerous lesion from BRCA1 mutation carriers | ||
| Esophagus | 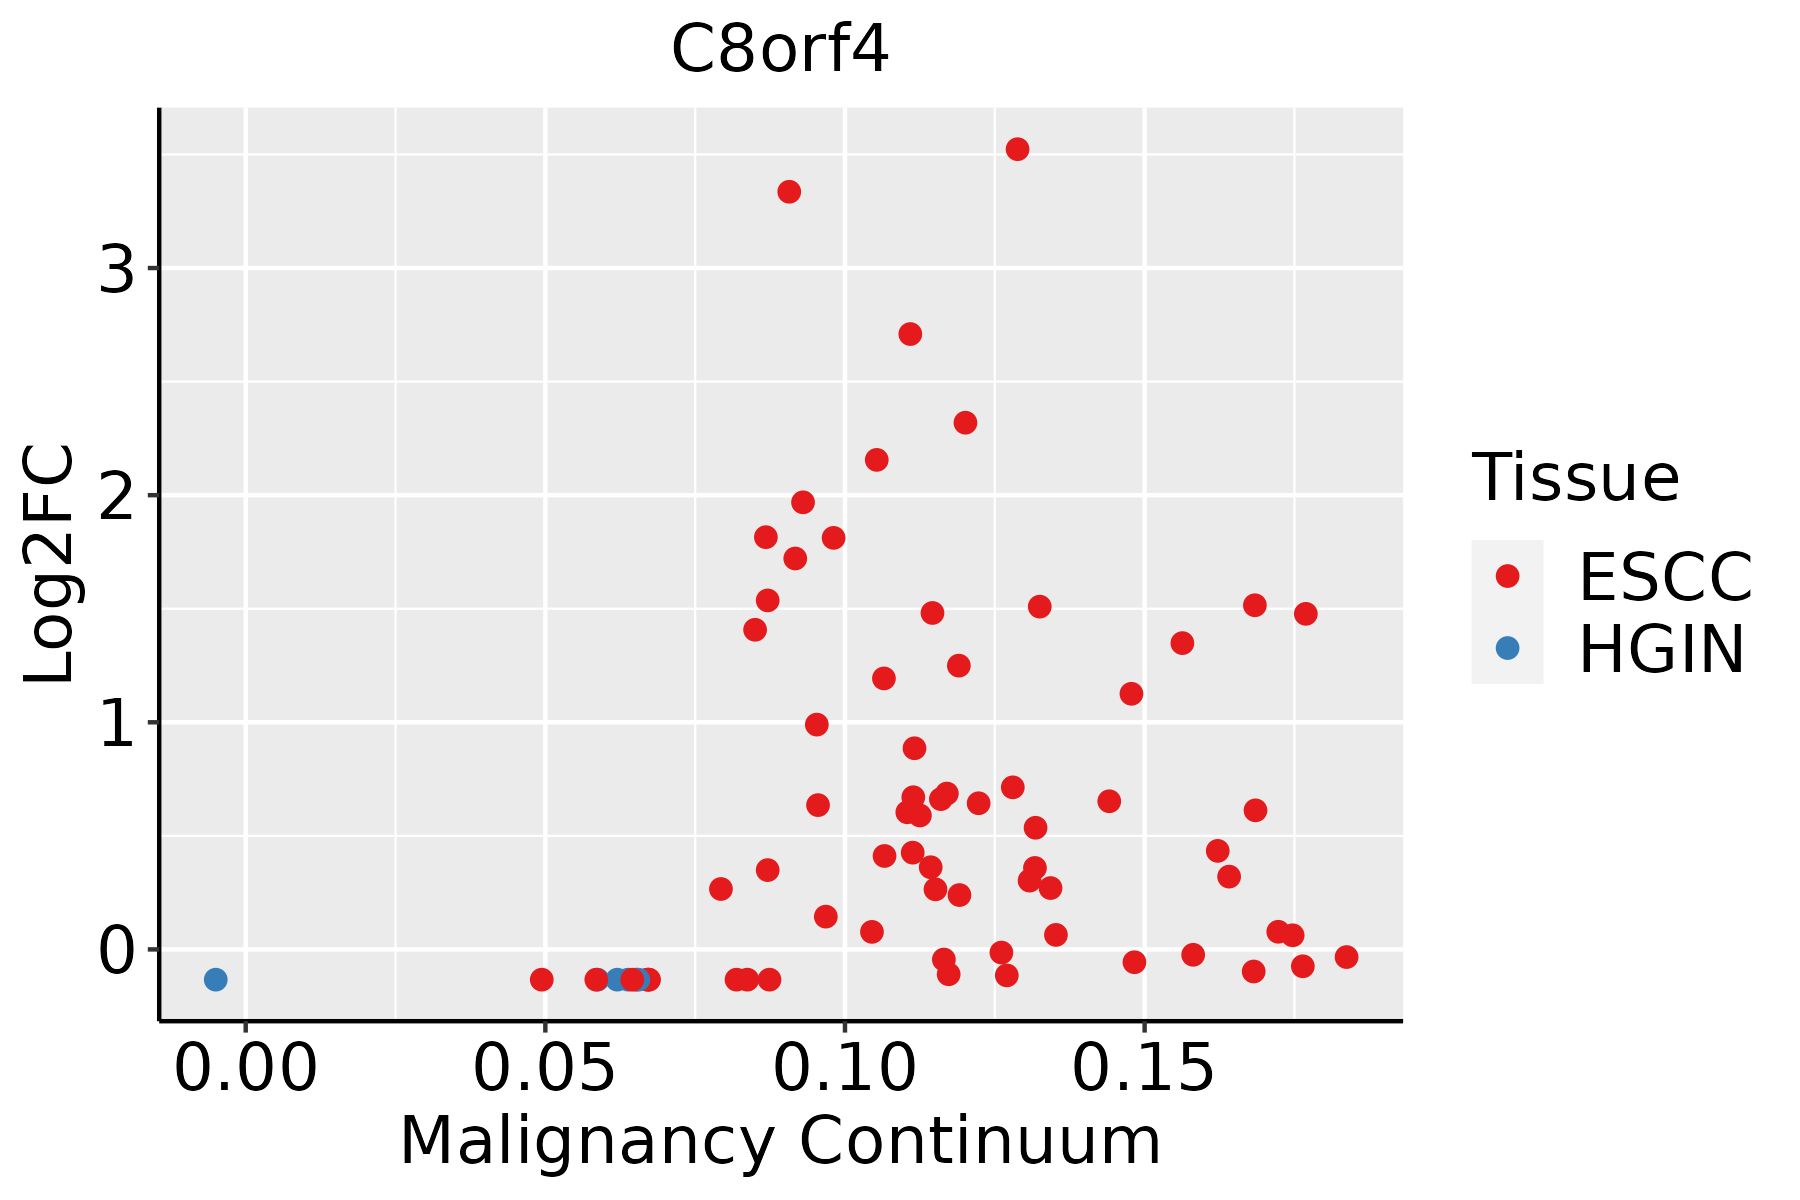 | ESCC: Esophageal squamous cell carcinoma |
| HGIN: High-grade intraepithelial neoplasias | ||
| LGIN: Low-grade intraepithelial neoplasias | ||
| GC |  | CAG: Chronic atrophic gastritis |
| CAG with IM: Chronic atrophic gastritis with intestinal metaplasia | ||
| CSG: Chronic superficial gastritis | ||
| GC: Gastric cancer | ||
| SIM: Severe intestinal metaplasia | ||
| WIM: Wild intestinal metaplasia | ||
| Liver |  | HCC: Hepatocellular carcinoma |
| NAFLD: Non-alcoholic fatty liver disease | ||
| Lung |  | AAH: Atypical adenomatous hyperplasia |
| AIS: Adenocarcinoma in situ | ||
| IAC: Invasive lung adenocarcinoma | ||
| MIA: Minimally invasive adenocarcinoma | ||
| Oral Cavity | 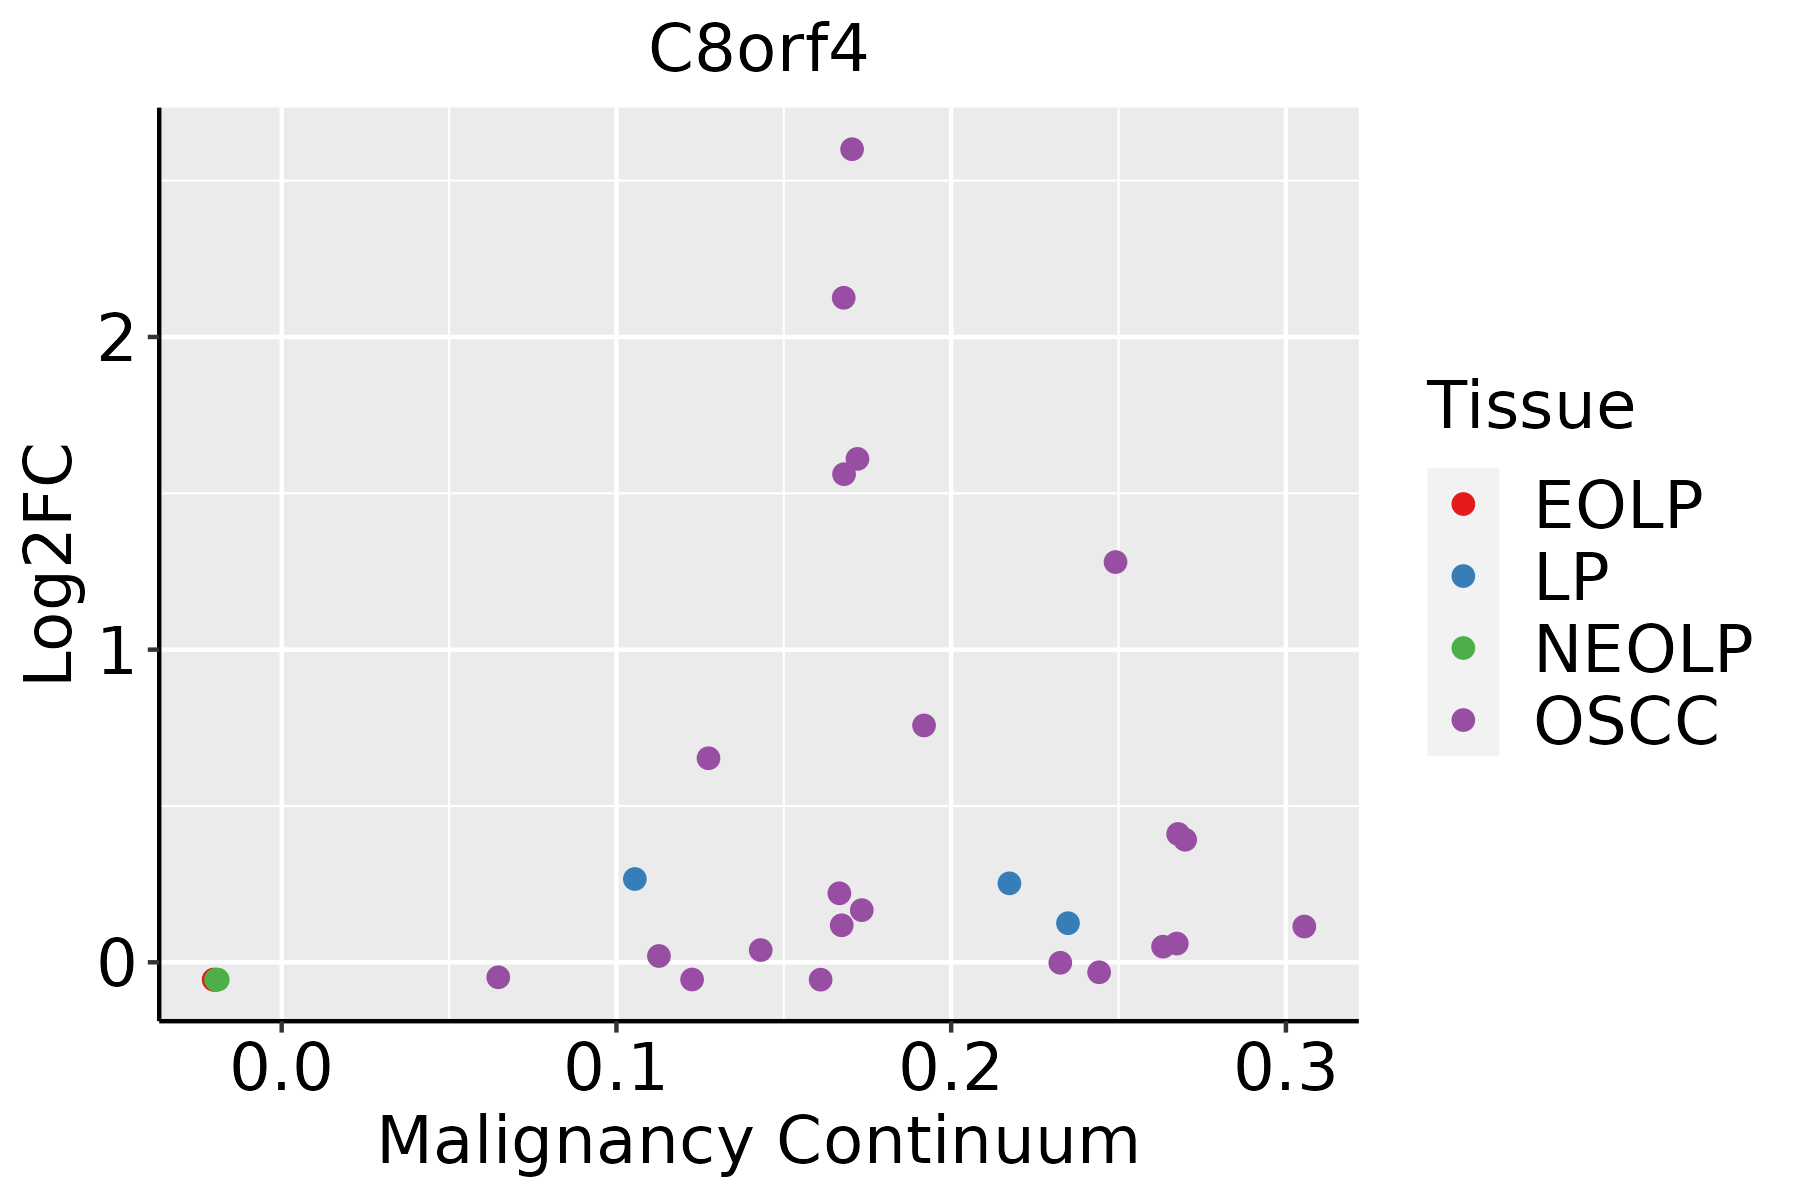 | EOLP: Erosive Oral lichen planus |
| LP: leukoplakia | ||
| NEOLP: Non-erosive oral lichen planus | ||
| OSCC: Oral squamous cell carcinoma | ||
| Prostate | 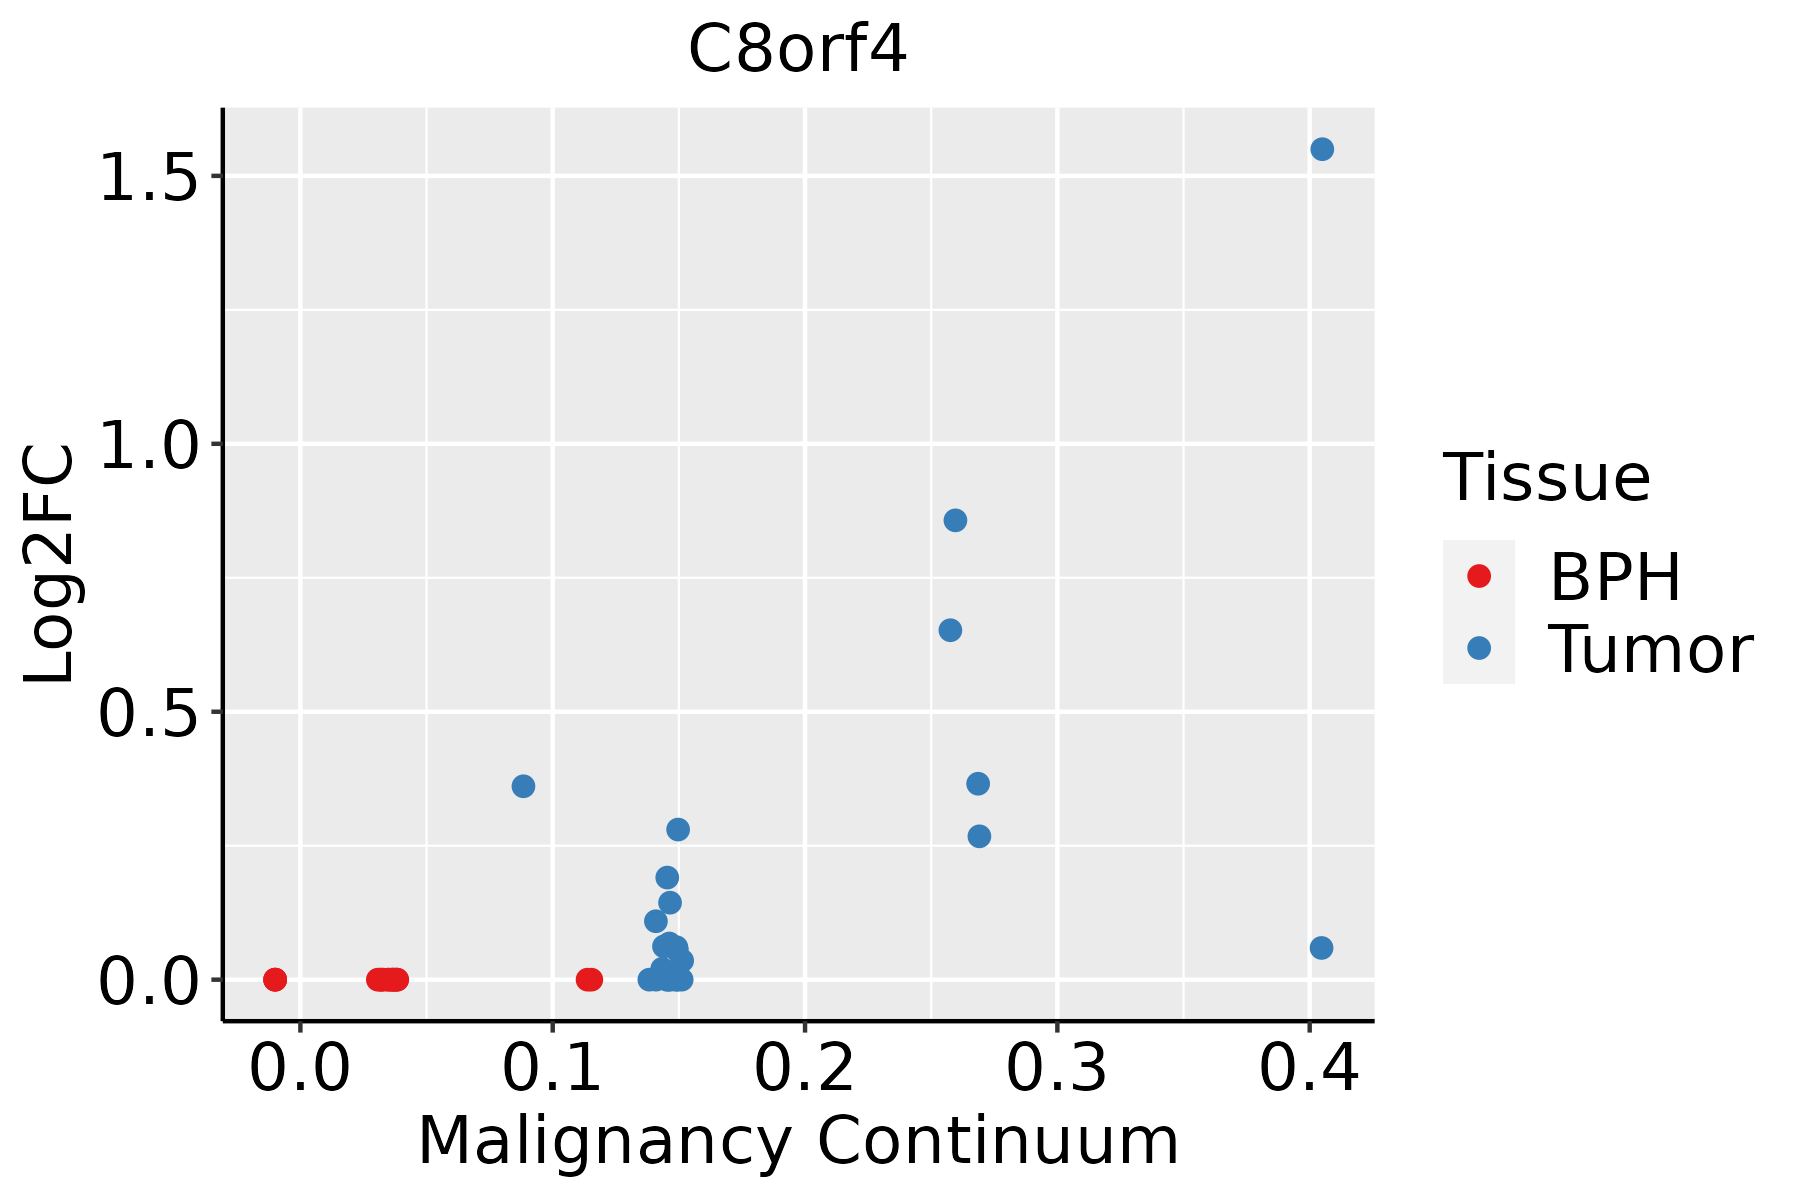 | BPH: Benign Prostatic Hyperplasia |
| ∗log2FC in expression of this searched gene in stem-like cells from each diseased tissue sample relative to stem-like cells in normal samples in each tissue plotted against the malignancy continuum. Samples are colored based on if they are from different disease stage. |
Top |
Malignant transformation related pathway analysis |
| Find out the enriched GO biological processes and KEGG pathways involved in transition from healthy to precancer to cancer |
| Tissue | Disease Stage | Enriched GO biological Processes |
| Colorectum | AD |  |
| Colorectum | SER |  |
| Colorectum | MSS |  |
| Colorectum | MSI-H |  |
| Colorectum | FAP |  |
| ∗Top 15 enriched GO BP terms are showed in the bar plot of each disease state in each tissue. Each row represents a significant GO biological process which is colored according to the -log10(p.adjust). |
| Page: 1 2 3 4 5 6 7 8 9 |
| GO ID | Tissue | Disease Stage | Description | Gene Ratio | Bg Ratio | pvalue | p.adjust | Count |
| Page: 1 |
| Pathway ID | Tissue | Disease Stage | Description | Gene Ratio | Bg Ratio | pvalue | p.adjust | qvalue | Count |
| Page: 1 |
Top |
Cell-cell communication analysis |
| Identification of potential cell-cell interactions between two cell types and their ligand-receptor pairs for different disease states |
| Ligand | Receptor | LRpair | Pathway | Tissue | Disease Stage |
| Page: 1 |
Top |
Single-cell gene regulatory network inference analysis |
| Find out the significant the regulons (TFs) and the target genes of each regulon across cell types for different disease states |
| TF | Cell Type | Tissue | Disease Stage | Target Gene | RSS | Regulon Activity |
| ∗The dot plots of a searched regulon are shown for all cell subpopulations in each disease state of each tissue based on the regulon specific score inferred using pySCENIC and by calculating the average expression. |
| Page: 1 |
Top |
Somatic mutation of malignant transformation related genes |
| Annotation of somatic variants for genes involved in malignant transformation |
| Hugo Symbol | Variant Class | Variant Classification | dbSNP RS | HGVSc | HGVSp | HGVSp Short | SWISSPROT | BIOTYPE | SIFT | PolyPhen | Tumor Sample Barcode | Tissue | Histology | Sex | Age | Stage | Therapy Types | Drugs | Outcome |
| C8orf4 | deletion | Frame_Shift_Del | novel | c.280delC | p.Gln94SerfsTer3 | p.Q94Sfs*3 | Q9NR00 | protein_coding | TCGA-EW-A2FV-01 | Breast | breast invasive carcinoma | Female | <65 | III/IV | Chemotherapy | docetaxel | SD | ||
| C8orf4 | SNV | Missense_Mutation | novel | c.110N>A | p.Gly37Asp | p.G37D | Q9NR00 | protein_coding | deleterious(0.02) | benign(0.262) | TCGA-A5-A0G1-01 | Endometrium | uterine corpus endometrioid carcinoma | Female | >=65 | I/II | Unknown | Unknown | SD |
| C8orf4 | SNV | Missense_Mutation | novel | c.136N>A | p.Glu46Lys | p.E46K | Q9NR00 | protein_coding | tolerated(0.2) | benign(0.073) | TCGA-AJ-A3EL-01 | Endometrium | uterine corpus endometrioid carcinoma | Female | <65 | I/II | Unknown | Unknown | SD |
| C8orf4 | SNV | Missense_Mutation | c.167N>A | p.Gly56Glu | p.G56E | Q9NR00 | protein_coding | deleterious(0) | probably_damaging(1) | TCGA-AP-A059-01 | Endometrium | uterine corpus endometrioid carcinoma | Female | >=65 | I/II | Unknown | Unknown | SD | |
| C8orf4 | SNV | Missense_Mutation | c.137N>G | p.Glu46Gly | p.E46G | Q9NR00 | protein_coding | tolerated(0.09) | benign(0.049) | TCGA-AP-A0LM-01 | Endometrium | uterine corpus endometrioid carcinoma | Female | <65 | III/IV | Chemotherapy | cisplatin | SD | |
| C8orf4 | SNV | Missense_Mutation | novel | c.195G>T | p.Lys65Asn | p.K65N | Q9NR00 | protein_coding | tolerated(0.14) | benign(0.177) | TCGA-AP-A1DV-01 | Endometrium | uterine corpus endometrioid carcinoma | Female | <65 | I/II | Unknown | Unknown | SD |
| C8orf4 | SNV | Missense_Mutation | novel | c.271N>G | p.Lys91Glu | p.K91E | Q9NR00 | protein_coding | deleterious(0.01) | probably_damaging(0.994) | TCGA-SL-A6JA-01 | Endometrium | uterine corpus endometrioid carcinoma | Female | >=65 | I/II | Unknown | Unknown | SD |
| C8orf4 | SNV | Missense_Mutation | c.134N>C | p.Gln45Pro | p.Q45P | Q9NR00 | protein_coding | tolerated(0.13) | possibly_damaging(0.448) | TCGA-UB-A7MB-01 | Liver | liver hepatocellular carcinoma | Male | <65 | I/II | Targeted Molecular therapy | sorafenib | PD | |
| C8orf4 | SNV | Missense_Mutation | rs570222497 | c.106N>T | p.Val36Leu | p.V36L | Q9NR00 | protein_coding | tolerated(0.14) | benign(0.218) | TCGA-78-8640-01 | Lung | lung adenocarcinoma | Male | <65 | I/II | Unknown | Unknown | SD |
| C8orf4 | SNV | Missense_Mutation | novel | c.136G>A | p.Glu46Lys | p.E46K | Q9NR00 | protein_coding | tolerated(0.2) | benign(0.073) | TCGA-CR-6472-01 | Oral cavity | head & neck squamous cell carcinoma | Male | <65 | I/II | Chemotherapy | paclitaxel | SD |
| Page: 1 2 |
Top |
Related drugs of malignant transformation related genes |
| Identification of chemicals and drugs interact with genes involved in malignant transfromation |
| (DGIdb 4.0) |
| Entrez ID | Symbol | Category | Interaction Types | Drug Claim Name | Drug Name | PMIDs |
| Page: 1 |

Copyright 2023-Present -The University of Texas Health Science Center at Houston |