
|
|||||
|
 | |
| |
| |
| |
| |
| |
|
Gene: C8G |
Gene summary for C8G |
| Gene information | Species | Human | Gene symbol | C8G | Gene ID | 733 |
| Gene name | complement C8 gamma chain | |
| Gene Alias | C8C | |
| Cytomap | 9q34.3 | |
| Gene Type | protein-coding | GO ID | GO:0002250 | UniProtAcc | P07360 |
Top |
Malignant transformation analysis |
| Identification of the aberrant gene expression in precancerous and cancerous lesions by comparing the gene expression of stem-like cells in diseased tissues with normal stem cells |
| Entrez ID | Symbol | Replicates | Species | Organ | Tissue | Adj P-value | Log2FC | Malignancy |
| 733 | C8G | HCC1_Meng | Human | Liver | HCC | 4.64e-63 | 3.64e-01 | 0.0246 |
| 733 | C8G | HCC1 | Human | Liver | HCC | 6.23e-11 | 4.04e+00 | 0.5336 |
| 733 | C8G | HCC2 | Human | Liver | HCC | 1.84e-14 | 3.96e+00 | 0.5341 |
| 733 | C8G | Pt13.a | Human | Liver | HCC | 1.81e-25 | 6.18e-01 | 0.021 |
| 733 | C8G | Pt13.b | Human | Liver | HCC | 1.14e-33 | 6.01e-01 | 0.0251 |
| 733 | C8G | Pt14.a | Human | Liver | HCC | 5.56e-08 | 5.88e-01 | 0.0169 |
| 733 | C8G | Pt14.b | Human | Liver | HCC | 2.35e-06 | 4.86e-01 | 0.018 |
| 733 | C8G | Pt14.d | Human | Liver | HCC | 1.63e-07 | 3.59e-01 | 0.0143 |
| 733 | C8G | S015 | Human | Liver | HCC | 4.10e-03 | 7.25e-01 | 0.2375 |
| 733 | C8G | S027 | Human | Liver | HCC | 2.56e-34 | 3.28e+00 | 0.2446 |
| 733 | C8G | S028 | Human | Liver | HCC | 6.57e-54 | 3.07e+00 | 0.2503 |
| 733 | C8G | S029 | Human | Liver | HCC | 1.91e-64 | 3.75e+00 | 0.2581 |
| Page: 1 |
| Tissue | Expression Dynamics | Abbreviation |
| Liver | 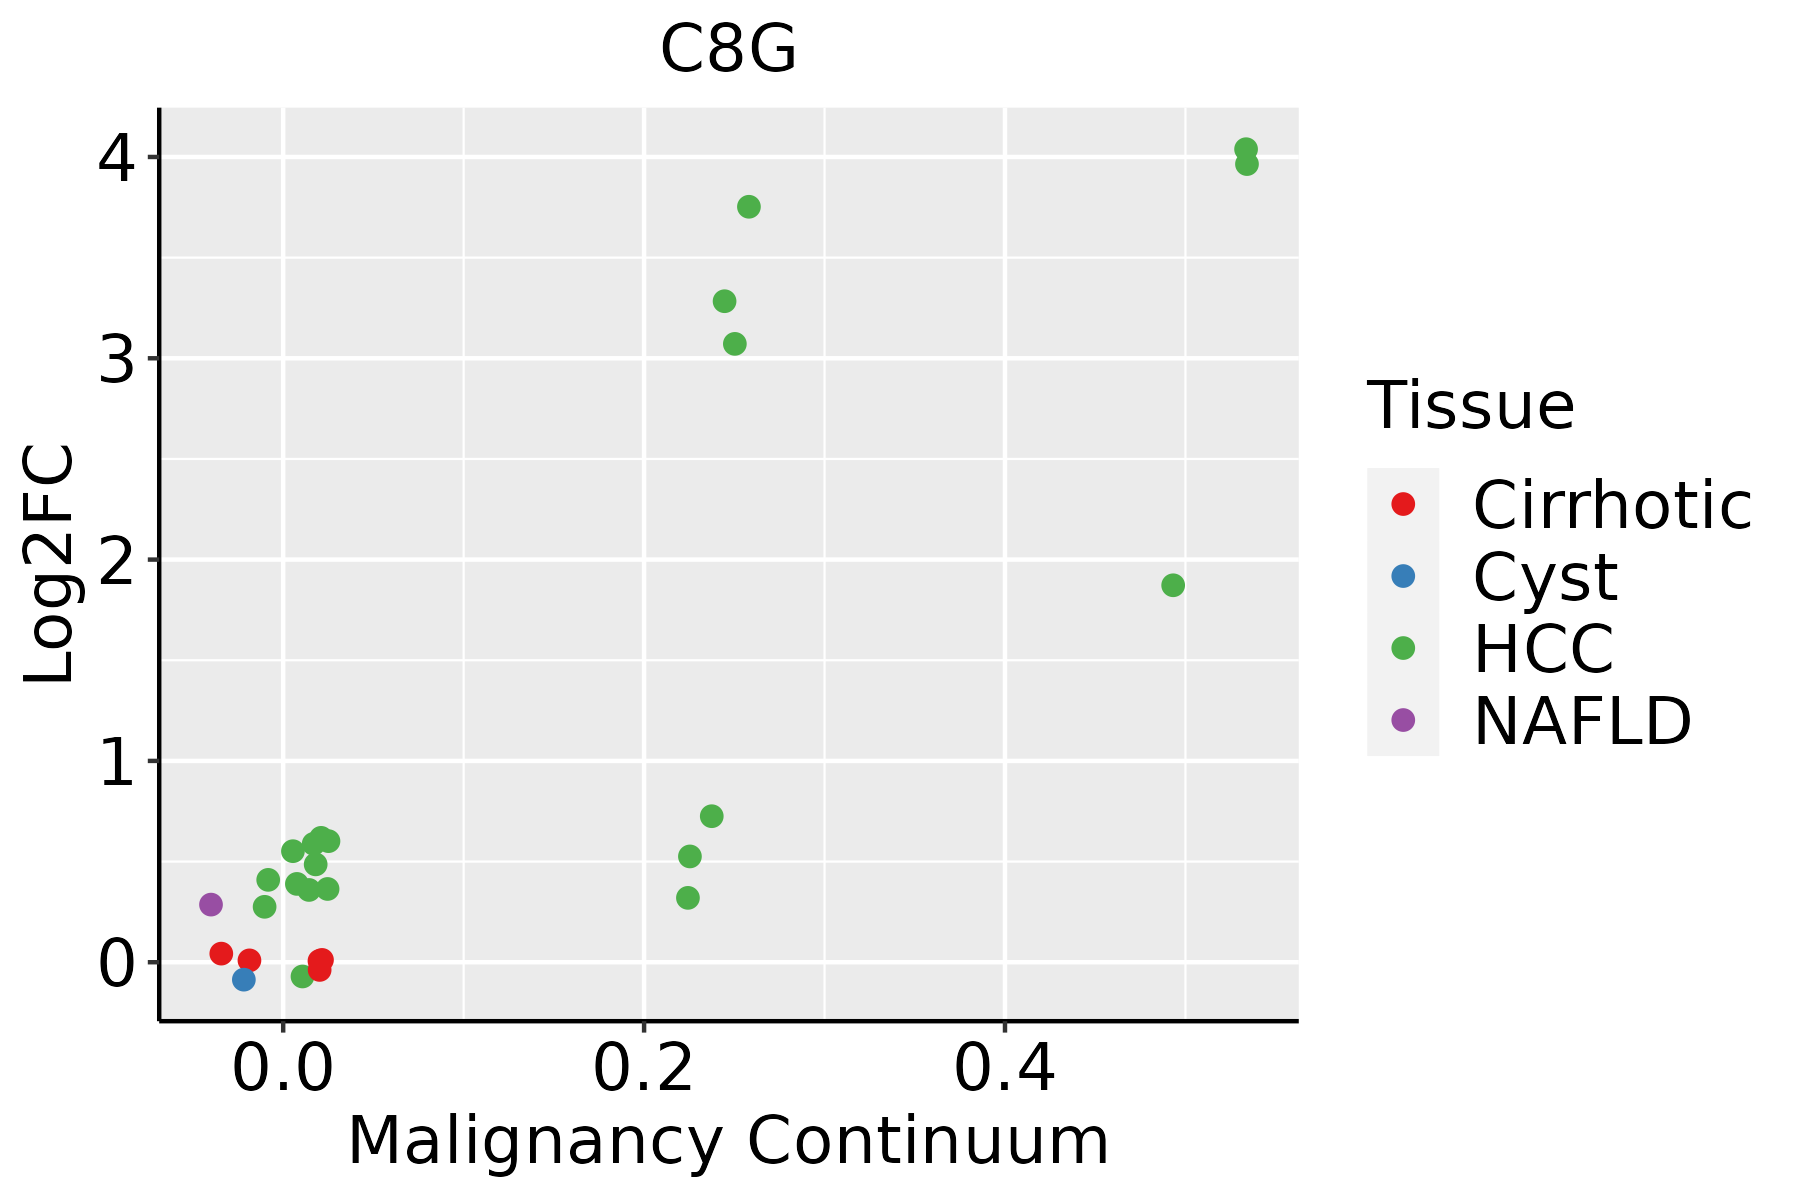 | HCC: Hepatocellular carcinoma |
| NAFLD: Non-alcoholic fatty liver disease |
| ∗log2FC in expression of this searched gene in stem-like cells from each diseased tissue sample relative to stem-like cells in normal samples in each tissue plotted against the malignancy continuum. Samples are colored based on if they are from different disease stage. |
Top |
Malignant transformation related pathway analysis |
| Find out the enriched GO biological processes and KEGG pathways involved in transition from healthy to precancer to cancer |
| Tissue | Disease Stage | Enriched GO biological Processes |
| Colorectum | AD |  |
| Colorectum | SER |  |
| Colorectum | MSS |  |
| Colorectum | MSI-H |  |
| Colorectum | FAP |  |
| ∗Top 15 enriched GO BP terms are showed in the bar plot of each disease state in each tissue. Each row represents a significant GO biological process which is colored according to the -log10(p.adjust). |
| Page: 1 2 3 4 5 6 7 8 9 |
| GO ID | Tissue | Disease Stage | Description | Gene Ratio | Bg Ratio | pvalue | p.adjust | Count |
| Page: 1 |
| Pathway ID | Tissue | Disease Stage | Description | Gene Ratio | Bg Ratio | pvalue | p.adjust | qvalue | Count |
| hsa0502022 | Liver | HCC | Prion disease | 195/4020 | 273/8465 | 3.26e-16 | 1.56e-14 | 8.67e-15 | 195 |
| hsa0517142 | Liver | HCC | Coronavirus disease - COVID-19 | 167/4020 | 232/8465 | 1.50e-14 | 4.19e-13 | 2.33e-13 | 167 |
| hsa046104 | Liver | HCC | Complement and coagulation cascades | 57/4020 | 86/8465 | 3.19e-04 | 1.45e-03 | 8.04e-04 | 57 |
| hsa0481041 | Liver | HCC | Regulation of actin cytoskeleton | 134/4020 | 229/8465 | 4.48e-04 | 1.94e-03 | 1.08e-03 | 134 |
| hsa0502032 | Liver | HCC | Prion disease | 195/4020 | 273/8465 | 3.26e-16 | 1.56e-14 | 8.67e-15 | 195 |
| hsa0517152 | Liver | HCC | Coronavirus disease - COVID-19 | 167/4020 | 232/8465 | 1.50e-14 | 4.19e-13 | 2.33e-13 | 167 |
| hsa046105 | Liver | HCC | Complement and coagulation cascades | 57/4020 | 86/8465 | 3.19e-04 | 1.45e-03 | 8.04e-04 | 57 |
| hsa0481051 | Liver | HCC | Regulation of actin cytoskeleton | 134/4020 | 229/8465 | 4.48e-04 | 1.94e-03 | 1.08e-03 | 134 |
| Page: 1 |
Top |
Cell-cell communication analysis |
| Identification of potential cell-cell interactions between two cell types and their ligand-receptor pairs for different disease states |
| Ligand | Receptor | LRpair | Pathway | Tissue | Disease Stage |
| Page: 1 |
Top |
Single-cell gene regulatory network inference analysis |
| Find out the significant the regulons (TFs) and the target genes of each regulon across cell types for different disease states |
| TF | Cell Type | Tissue | Disease Stage | Target Gene | RSS | Regulon Activity |
| ∗The dot plots of a searched regulon are shown for all cell subpopulations in each disease state of each tissue based on the regulon specific score inferred using pySCENIC and by calculating the average expression. |
| Page: 1 |
Top |
Somatic mutation of malignant transformation related genes |
| Annotation of somatic variants for genes involved in malignant transformation |
| Hugo Symbol | Variant Class | Variant Classification | dbSNP RS | HGVSc | HGVSp | HGVSp Short | SWISSPROT | BIOTYPE | SIFT | PolyPhen | Tumor Sample Barcode | Tissue | Histology | Sex | Age | Stage | Therapy Types | Drugs | Outcome |
| C8G | SNV | Missense_Mutation | rs753450750 | c.359N>A | p.Arg120Gln | p.R120Q | P07360 | protein_coding | tolerated(0.13) | possibly_damaging(0.665) | TCGA-EK-A2RJ-01 | Cervix | cervical & endocervical cancer | Female | <65 | I/II | Unknown | Unknown | SD |
| C8G | SNV | Missense_Mutation | novel | c.350G>T | p.Arg117Leu | p.R117L | P07360 | protein_coding | deleterious(0) | benign(0.427) | TCGA-JW-A5VL-01 | Cervix | cervical & endocervical cancer | Female | <65 | I/II | Unknown | Unknown | SD |
| C8G | SNV | Missense_Mutation | novel | c.211N>A | p.Glu71Lys | p.E71K | P07360 | protein_coding | deleterious(0.04) | probably_damaging(0.991) | TCGA-5M-AAT6-01 | Colorectum | colon adenocarcinoma | Female | <65 | III/IV | Unknown | Unknown | PD |
| C8G | SNV | Missense_Mutation | rs374701186 | c.299G>A | p.Arg100His | p.R100H | P07360 | protein_coding | deleterious(0) | possibly_damaging(0.747) | TCGA-AD-6889-01 | Colorectum | colon adenocarcinoma | Male | >=65 | I/II | Chemotherapy | xeloda | PD |
| C8G | SNV | Missense_Mutation | rs747699740 | c.182N>A | p.Arg61His | p.R61H | P07360 | protein_coding | tolerated(0.31) | benign(0.005) | TCGA-A5-A0VP-01 | Endometrium | uterine corpus endometrioid carcinoma | Female | >=65 | I/II | Unknown | Unknown | SD |
| C8G | SNV | Missense_Mutation | c.223N>A | p.Leu75Met | p.L75M | P07360 | protein_coding | tolerated(0.41) | benign(0.269) | TCGA-AP-A059-01 | Endometrium | uterine corpus endometrioid carcinoma | Female | >=65 | I/II | Unknown | Unknown | SD | |
| C8G | SNV | Missense_Mutation | novel | c.461N>T | p.Ser154Leu | p.S154L | P07360 | protein_coding | deleterious(0.04) | benign(0.149) | TCGA-AP-A1DV-01 | Endometrium | uterine corpus endometrioid carcinoma | Female | <65 | I/II | Unknown | Unknown | SD |
| C8G | SNV | Missense_Mutation | rs553764725 | c.457N>T | p.Arg153Cys | p.R153C | P07360 | protein_coding | deleterious(0) | probably_damaging(0.999) | TCGA-DF-A2KU-01 | Endometrium | uterine corpus endometrioid carcinoma | Female | Unknown | I/II | Unknown | Unknown | SD |
| C8G | SNV | Missense_Mutation | novel | c.544N>G | p.Phe182Val | p.F182V | P07360 | protein_coding | deleterious(0) | probably_damaging(1) | TCGA-EO-A3B0-01 | Endometrium | uterine corpus endometrioid carcinoma | Female | <65 | III/IV | Unknown | Unknown | SD |
| C8G | SNV | Missense_Mutation | rs753450750 | c.359N>A | p.Arg120Gln | p.R120Q | P07360 | protein_coding | tolerated(0.13) | possibly_damaging(0.665) | TCGA-BA-5152-01 | Oral cavity | head & neck squamous cell carcinoma | Male | <65 | I/II | Unknown | Unknown | SD |
| Page: 1 |
Top |
Related drugs of malignant transformation related genes |
| Identification of chemicals and drugs interact with genes involved in malignant transfromation |
| (DGIdb 4.0) |
| Entrez ID | Symbol | Category | Interaction Types | Drug Claim Name | Drug Name | PMIDs |
| Page: 1 |

Copyright 2023-Present -The University of Texas Health Science Center at Houston |