
|
|||||
|
 | |
| |
| |
| |
| |
| |
|
Gene: C8A |
Gene summary for C8A |
| Gene information | Species | Human | Gene symbol | C8A | Gene ID | 731 |
| Gene name | complement C8 alpha chain | |
| Gene Alias | C8A | |
| Cytomap | 1p32.2 | |
| Gene Type | protein-coding | GO ID | GO:0002250 | UniProtAcc | P07357 |
Top |
Malignant transformation analysis |
| Identification of the aberrant gene expression in precancerous and cancerous lesions by comparing the gene expression of stem-like cells in diseased tissues with normal stem cells |
| Entrez ID | Symbol | Replicates | Species | Organ | Tissue | Adj P-value | Log2FC | Malignancy |
| 731 | C8A | NAFLD1 | Human | Liver | NAFLD | 6.58e-14 | 1.25e+00 | -0.04 |
| 731 | C8A | S41 | Human | Liver | Cirrhotic | 3.82e-02 | 4.49e-01 | -0.0343 |
| 731 | C8A | S43 | Human | Liver | Cirrhotic | 1.26e-06 | -2.58e-01 | -0.0187 |
| 731 | C8A | HCC1_Meng | Human | Liver | HCC | 3.82e-88 | -9.69e-02 | 0.0246 |
| 731 | C8A | HCC2_Meng | Human | Liver | HCC | 9.13e-08 | -3.28e-01 | 0.0107 |
| 731 | C8A | cirrhotic1 | Human | Liver | Cirrhotic | 3.17e-07 | -3.17e-01 | 0.0202 |
| 731 | C8A | cirrhotic2 | Human | Liver | Cirrhotic | 1.83e-07 | -3.15e-01 | 0.0201 |
| 731 | C8A | cirrhotic3 | Human | Liver | Cirrhotic | 6.73e-03 | -3.23e-01 | 0.0215 |
| 731 | C8A | Pt13.a | Human | Liver | HCC | 2.91e-05 | -3.03e-01 | 0.021 |
| 731 | C8A | Pt13.b | Human | Liver | HCC | 2.20e-03 | -2.86e-01 | 0.0251 |
| 731 | C8A | Pt14.d | Human | Liver | HCC | 3.45e-02 | -2.26e-01 | 0.0143 |
| 731 | C8A | S015 | Human | Liver | HCC | 1.45e-03 | 4.05e-01 | 0.2375 |
| 731 | C8A | S027 | Human | Liver | HCC | 4.12e-09 | 1.10e+00 | 0.2446 |
| 731 | C8A | S028 | Human | Liver | HCC | 7.54e-16 | 7.56e-01 | 0.2503 |
| 731 | C8A | S029 | Human | Liver | HCC | 7.57e-27 | 1.43e+00 | 0.2581 |
| Page: 1 |
| Tissue | Expression Dynamics | Abbreviation |
| Liver | 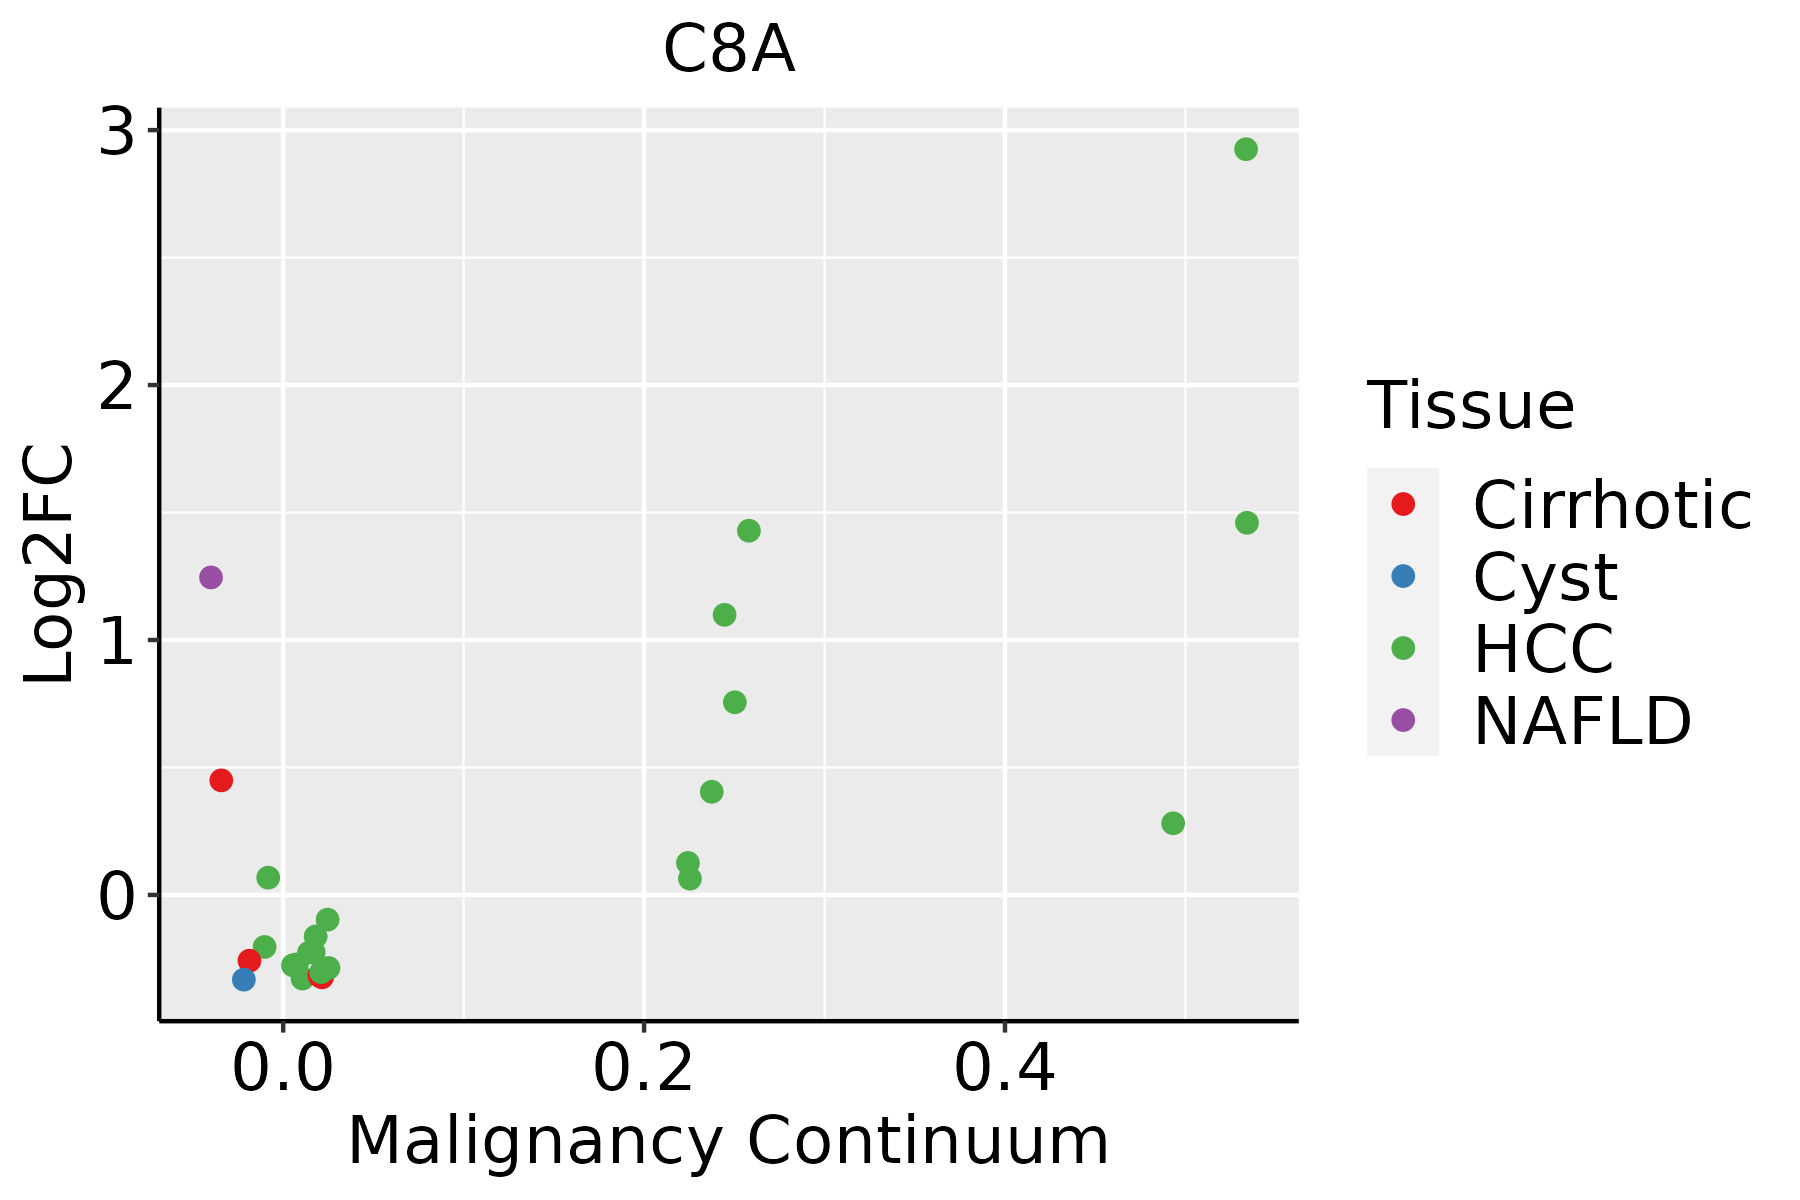 | HCC: Hepatocellular carcinoma |
| NAFLD: Non-alcoholic fatty liver disease |
| ∗log2FC in expression of this searched gene in stem-like cells from each diseased tissue sample relative to stem-like cells in normal samples in each tissue plotted against the malignancy continuum. Samples are colored based on if they are from different disease stage. |
Top |
Malignant transformation related pathway analysis |
| Find out the enriched GO biological processes and KEGG pathways involved in transition from healthy to precancer to cancer |
| Tissue | Disease Stage | Enriched GO biological Processes |
| Colorectum | AD |  |
| Colorectum | SER |  |
| Colorectum | MSS |  |
| Colorectum | MSI-H |  |
| Colorectum | FAP |  |
| ∗Top 15 enriched GO BP terms are showed in the bar plot of each disease state in each tissue. Each row represents a significant GO biological process which is colored according to the -log10(p.adjust). |
| Page: 1 2 3 4 5 6 7 8 9 |
| GO ID | Tissue | Disease Stage | Description | Gene Ratio | Bg Ratio | pvalue | p.adjust | Count |
| GO:001593116 | Esophagus | HGIN | nucleobase-containing compound transport | 57/2587 | 222/18723 | 1.76e-06 | 6.52e-05 | 57 |
| GO:190495120 | Esophagus | HGIN | positive regulation of establishment of protein localization | 73/2587 | 319/18723 | 6.99e-06 | 2.14e-04 | 73 |
| GO:005122220 | Esophagus | HGIN | positive regulation of protein transport | 67/2587 | 303/18723 | 5.13e-05 | 1.22e-03 | 67 |
| GO:001593117 | Esophagus | ESCC | nucleobase-containing compound transport | 162/8552 | 222/18723 | 9.87e-17 | 7.93e-15 | 162 |
| GO:000170119 | Esophagus | ESCC | in utero embryonic development | 243/8552 | 367/18723 | 1.00e-15 | 6.86e-14 | 243 |
| GO:1904951111 | Esophagus | ESCC | positive regulation of establishment of protein localization | 216/8552 | 319/18723 | 1.01e-15 | 6.86e-14 | 216 |
| GO:0051222111 | Esophagus | ESCC | positive regulation of protein transport | 204/8552 | 303/18723 | 1.56e-14 | 8.38e-13 | 204 |
| GO:000931419 | Esophagus | ESCC | response to radiation | 277/8552 | 456/18723 | 4.42e-11 | 1.43e-09 | 277 |
| GO:003253520 | Esophagus | ESCC | regulation of cellular component size | 227/8552 | 383/18723 | 4.77e-08 | 8.60e-07 | 227 |
| GO:00073698 | Esophagus | ESCC | gastrulation | 115/8552 | 185/18723 | 4.35e-06 | 4.64e-05 | 115 |
| GO:000941611 | Esophagus | ESCC | response to light stimulus | 183/8552 | 320/18723 | 2.03e-05 | 1.76e-04 | 183 |
| GO:00069707 | Esophagus | ESCC | response to osmotic stress | 57/8552 | 84/18723 | 3.26e-05 | 2.70e-04 | 57 |
| GO:00301984 | Esophagus | ESCC | extracellular matrix organization | 171/8552 | 301/18723 | 6.08e-05 | 4.67e-04 | 171 |
| GO:00430624 | Esophagus | ESCC | extracellular structure organization | 171/8552 | 302/18723 | 7.73e-05 | 5.76e-04 | 171 |
| GO:00452294 | Esophagus | ESCC | external encapsulating structure organization | 172/8552 | 304/18723 | 7.80e-05 | 5.80e-04 | 172 |
| GO:00083619 | Esophagus | ESCC | regulation of cell size | 107/8552 | 181/18723 | 1.81e-04 | 1.16e-03 | 107 |
| GO:19031317 | Esophagus | ESCC | mononuclear cell differentiation | 226/8552 | 426/18723 | 1.20e-03 | 5.88e-03 | 226 |
| GO:000166720 | Esophagus | ESCC | ameboidal-type cell migration | 250/8552 | 475/18723 | 1.22e-03 | 5.97e-03 | 250 |
| GO:00454454 | Esophagus | ESCC | myoblast differentiation | 52/8552 | 84/18723 | 1.98e-03 | 8.90e-03 | 52 |
| GO:000930617 | Esophagus | ESCC | protein secretion | 190/8552 | 359/18723 | 3.22e-03 | 1.34e-02 | 190 |
| Page: 1 2 3 4 5 6 7 8 9 10 |
| Pathway ID | Tissue | Disease Stage | Description | Gene Ratio | Bg Ratio | pvalue | p.adjust | qvalue | Count |
| hsa0517114 | Liver | NAFLD | Coronavirus disease - COVID-19 | 111/1043 | 232/8465 | 1.01e-41 | 3.32e-39 | 2.67e-39 | 111 |
| hsa04610 | Liver | NAFLD | Complement and coagulation cascades | 35/1043 | 86/8465 | 2.48e-11 | 2.04e-09 | 1.64e-09 | 35 |
| hsa0481010 | Liver | NAFLD | Regulation of actin cytoskeleton | 50/1043 | 229/8465 | 3.01e-05 | 7.59e-04 | 6.11e-04 | 50 |
| hsa0517115 | Liver | NAFLD | Coronavirus disease - COVID-19 | 111/1043 | 232/8465 | 1.01e-41 | 3.32e-39 | 2.67e-39 | 111 |
| hsa046101 | Liver | NAFLD | Complement and coagulation cascades | 35/1043 | 86/8465 | 2.48e-11 | 2.04e-09 | 1.64e-09 | 35 |
| hsa0481011 | Liver | NAFLD | Regulation of actin cytoskeleton | 50/1043 | 229/8465 | 3.01e-05 | 7.59e-04 | 6.11e-04 | 50 |
| hsa0517122 | Liver | Cirrhotic | Coronavirus disease - COVID-19 | 136/2530 | 232/8465 | 3.28e-20 | 1.82e-18 | 1.12e-18 | 136 |
| hsa0502014 | Liver | Cirrhotic | Prion disease | 152/2530 | 273/8465 | 1.84e-19 | 8.78e-18 | 5.41e-18 | 152 |
| hsa046102 | Liver | Cirrhotic | Complement and coagulation cascades | 48/2530 | 86/8465 | 4.41e-07 | 5.44e-06 | 3.35e-06 | 48 |
| hsa0481021 | Liver | Cirrhotic | Regulation of actin cytoskeleton | 100/2530 | 229/8465 | 5.28e-06 | 5.50e-05 | 3.39e-05 | 100 |
| hsa0517132 | Liver | Cirrhotic | Coronavirus disease - COVID-19 | 136/2530 | 232/8465 | 3.28e-20 | 1.82e-18 | 1.12e-18 | 136 |
| hsa0502015 | Liver | Cirrhotic | Prion disease | 152/2530 | 273/8465 | 1.84e-19 | 8.78e-18 | 5.41e-18 | 152 |
| hsa046103 | Liver | Cirrhotic | Complement and coagulation cascades | 48/2530 | 86/8465 | 4.41e-07 | 5.44e-06 | 3.35e-06 | 48 |
| hsa0481031 | Liver | Cirrhotic | Regulation of actin cytoskeleton | 100/2530 | 229/8465 | 5.28e-06 | 5.50e-05 | 3.39e-05 | 100 |
| hsa0502022 | Liver | HCC | Prion disease | 195/4020 | 273/8465 | 3.26e-16 | 1.56e-14 | 8.67e-15 | 195 |
| hsa0517142 | Liver | HCC | Coronavirus disease - COVID-19 | 167/4020 | 232/8465 | 1.50e-14 | 4.19e-13 | 2.33e-13 | 167 |
| hsa046104 | Liver | HCC | Complement and coagulation cascades | 57/4020 | 86/8465 | 3.19e-04 | 1.45e-03 | 8.04e-04 | 57 |
| hsa0481041 | Liver | HCC | Regulation of actin cytoskeleton | 134/4020 | 229/8465 | 4.48e-04 | 1.94e-03 | 1.08e-03 | 134 |
| hsa0502032 | Liver | HCC | Prion disease | 195/4020 | 273/8465 | 3.26e-16 | 1.56e-14 | 8.67e-15 | 195 |
| hsa0517152 | Liver | HCC | Coronavirus disease - COVID-19 | 167/4020 | 232/8465 | 1.50e-14 | 4.19e-13 | 2.33e-13 | 167 |
| Page: 1 2 |
Top |
Cell-cell communication analysis |
| Identification of potential cell-cell interactions between two cell types and their ligand-receptor pairs for different disease states |
| Ligand | Receptor | LRpair | Pathway | Tissue | Disease Stage |
| Page: 1 |
Top |
Single-cell gene regulatory network inference analysis |
| Find out the significant the regulons (TFs) and the target genes of each regulon across cell types for different disease states |
| TF | Cell Type | Tissue | Disease Stage | Target Gene | RSS | Regulon Activity |
| ∗The dot plots of a searched regulon are shown for all cell subpopulations in each disease state of each tissue based on the regulon specific score inferred using pySCENIC and by calculating the average expression. |
| Page: 1 |
Top |
Somatic mutation of malignant transformation related genes |
| Annotation of somatic variants for genes involved in malignant transformation |
| Hugo Symbol | Variant Class | Variant Classification | dbSNP RS | HGVSc | HGVSp | HGVSp Short | SWISSPROT | BIOTYPE | SIFT | PolyPhen | Tumor Sample Barcode | Tissue | Histology | Sex | Age | Stage | Therapy Types | Drugs | Outcome |
| C8A | SNV | Missense_Mutation | rs749738757 | c.281C>T | p.Ala94Val | p.A94V | P07357 | protein_coding | tolerated(0.29) | benign(0.119) | TCGA-AN-A046-01 | Breast | breast invasive carcinoma | Female | >=65 | I/II | Unknown | Unknown | SD |
| C8A | SNV | Missense_Mutation | novel | c.979T>C | p.Tyr327His | p.Y327H | P07357 | protein_coding | deleterious(0) | probably_damaging(0.995) | TCGA-AN-A046-01 | Breast | breast invasive carcinoma | Female | >=65 | I/II | Unknown | Unknown | SD |
| C8A | SNV | Missense_Mutation | c.555G>C | p.Trp185Cys | p.W185C | P07357 | protein_coding | deleterious(0) | probably_damaging(1) | TCGA-AR-A2LH-01 | Breast | breast invasive carcinoma | Female | <65 | III/IV | Chemotherapy | adriamycin | PD | |
| C8A | SNV | Missense_Mutation | rs753968787 | c.332N>A | p.Arg111His | p.R111H | P07357 | protein_coding | deleterious(0.01) | probably_damaging(0.995) | TCGA-BH-A0E9-01 | Breast | breast invasive carcinoma | Female | <65 | I/II | Chemotherapy | taxotere | CR |
| C8A | insertion | Frame_Shift_Ins | novel | c.1083_1084insGAACAAAGAGAGC | p.Met362GlufsTer28 | p.M362Efs*28 | P07357 | protein_coding | TCGA-AR-A0U0-01 | Breast | breast invasive carcinoma | Female | >=65 | I/II | Unknown | Unknown | SD | ||
| C8A | deletion | Frame_Shift_Del | novel | c.1446_1456delNNNNNNNNNNN | p.Arg484GlyfsTer36 | p.R484Gfs*36 | P07357 | protein_coding | TCGA-S3-AA10-01 | Breast | breast invasive carcinoma | Female | >=65 | I/II | Chemotherapy | cytoxan | CR | ||
| C8A | SNV | Missense_Mutation | c.403N>A | p.Ala135Thr | p.A135T | P07357 | protein_coding | tolerated(0.57) | benign(0.001) | TCGA-A6-6141-01 | Colorectum | colon adenocarcinoma | Male | <65 | I/II | Chemotherapy | 5-fu | SD | |
| C8A | SNV | Missense_Mutation | rs143726641 | c.1742N>T | p.Thr581Met | p.T581M | P07357 | protein_coding | deleterious(0) | probably_damaging(0.987) | TCGA-AA-3856-01 | Colorectum | colon adenocarcinoma | Male | <65 | I/II | Unknown | Unknown | SD |
| C8A | SNV | Missense_Mutation | c.1111N>T | p.Asp371Tyr | p.D371Y | P07357 | protein_coding | tolerated(0.06) | possibly_damaging(0.663) | TCGA-AA-A010-01 | Colorectum | colon adenocarcinoma | Female | <65 | I/II | Chemotherapy | folinic | CR | |
| C8A | SNV | Missense_Mutation | c.370N>A | p.Gly124Ser | p.G124S | P07357 | protein_coding | tolerated(0.18) | possibly_damaging(0.723) | TCGA-AD-6889-01 | Colorectum | colon adenocarcinoma | Male | >=65 | I/II | Chemotherapy | xeloda | PD |
| Page: 1 2 3 4 5 6 7 8 9 10 |
Top |
Related drugs of malignant transformation related genes |
| Identification of chemicals and drugs interact with genes involved in malignant transfromation |
| (DGIdb 4.0) |
| Entrez ID | Symbol | Category | Interaction Types | Drug Claim Name | Drug Name | PMIDs |
| Page: 1 |

Copyright 2023-Present -The University of Texas Health Science Center at Houston |