
|
|||||
|
 | |
| |
| |
| |
| |
| |
|
Gene: C7orf50 |
Gene summary for C7ORF50 |
| Gene information | Species | Human | Gene symbol | C7orf50 | Gene ID | 84310 |
| Gene name | chromosome 7 open reading frame 50 | |
| Gene Alias | YCR016W | |
| Cytomap | 7p22.3 | |
| Gene Type | protein-coding | GO ID | GO:0003674 | UniProtAcc | Q9BRJ6 |
Top |
Malignant transformation analysis |
| Identification of the aberrant gene expression in precancerous and cancerous lesions by comparing the gene expression of stem-like cells in diseased tissues with normal stem cells |
| Entrez ID | Symbol | Replicates | Species | Organ | Tissue | Adj P-value | Log2FC | Malignancy |
| 84310 | C7orf50 | LZE2T | Human | Esophagus | ESCC | 6.08e-04 | 7.03e-01 | 0.082 |
| 84310 | C7orf50 | LZE4T | Human | Esophagus | ESCC | 1.47e-14 | 6.64e-01 | 0.0811 |
| 84310 | C7orf50 | LZE5T | Human | Esophagus | ESCC | 1.75e-03 | 1.94e-01 | 0.0514 |
| 84310 | C7orf50 | LZE7T | Human | Esophagus | ESCC | 1.64e-09 | 5.72e-01 | 0.0667 |
| 84310 | C7orf50 | LZE8T | Human | Esophagus | ESCC | 1.37e-02 | 2.23e-01 | 0.067 |
| 84310 | C7orf50 | LZE20T | Human | Esophagus | ESCC | 1.98e-15 | 6.79e-01 | 0.0662 |
| 84310 | C7orf50 | LZE22D1 | Human | Esophagus | HGIN | 3.37e-06 | 2.12e-01 | 0.0595 |
| 84310 | C7orf50 | LZE22T | Human | Esophagus | ESCC | 8.11e-07 | 8.34e-01 | 0.068 |
| 84310 | C7orf50 | LZE24T | Human | Esophagus | ESCC | 4.48e-15 | 4.53e-01 | 0.0596 |
| 84310 | C7orf50 | LZE6T | Human | Esophagus | ESCC | 1.34e-09 | 4.40e-01 | 0.0845 |
| 84310 | C7orf50 | P1T-E | Human | Esophagus | ESCC | 8.33e-12 | 6.62e-01 | 0.0875 |
| 84310 | C7orf50 | P2T-E | Human | Esophagus | ESCC | 3.81e-40 | 7.59e-01 | 0.1177 |
| 84310 | C7orf50 | P4T-E | Human | Esophagus | ESCC | 5.90e-55 | 1.64e+00 | 0.1323 |
| 84310 | C7orf50 | P5T-E | Human | Esophagus | ESCC | 1.82e-52 | 1.03e+00 | 0.1327 |
| 84310 | C7orf50 | P8T-E | Human | Esophagus | ESCC | 3.59e-25 | 5.73e-01 | 0.0889 |
| 84310 | C7orf50 | P9T-E | Human | Esophagus | ESCC | 1.87e-30 | 8.21e-01 | 0.1131 |
| 84310 | C7orf50 | P10T-E | Human | Esophagus | ESCC | 3.38e-35 | 6.40e-01 | 0.116 |
| 84310 | C7orf50 | P11T-E | Human | Esophagus | ESCC | 1.23e-34 | 1.46e+00 | 0.1426 |
| 84310 | C7orf50 | P12T-E | Human | Esophagus | ESCC | 5.03e-52 | 1.01e+00 | 0.1122 |
| 84310 | C7orf50 | P15T-E | Human | Esophagus | ESCC | 6.19e-38 | 1.03e+00 | 0.1149 |
| Page: 1 2 3 4 5 6 7 |
| Tissue | Expression Dynamics | Abbreviation |
| Esophagus | 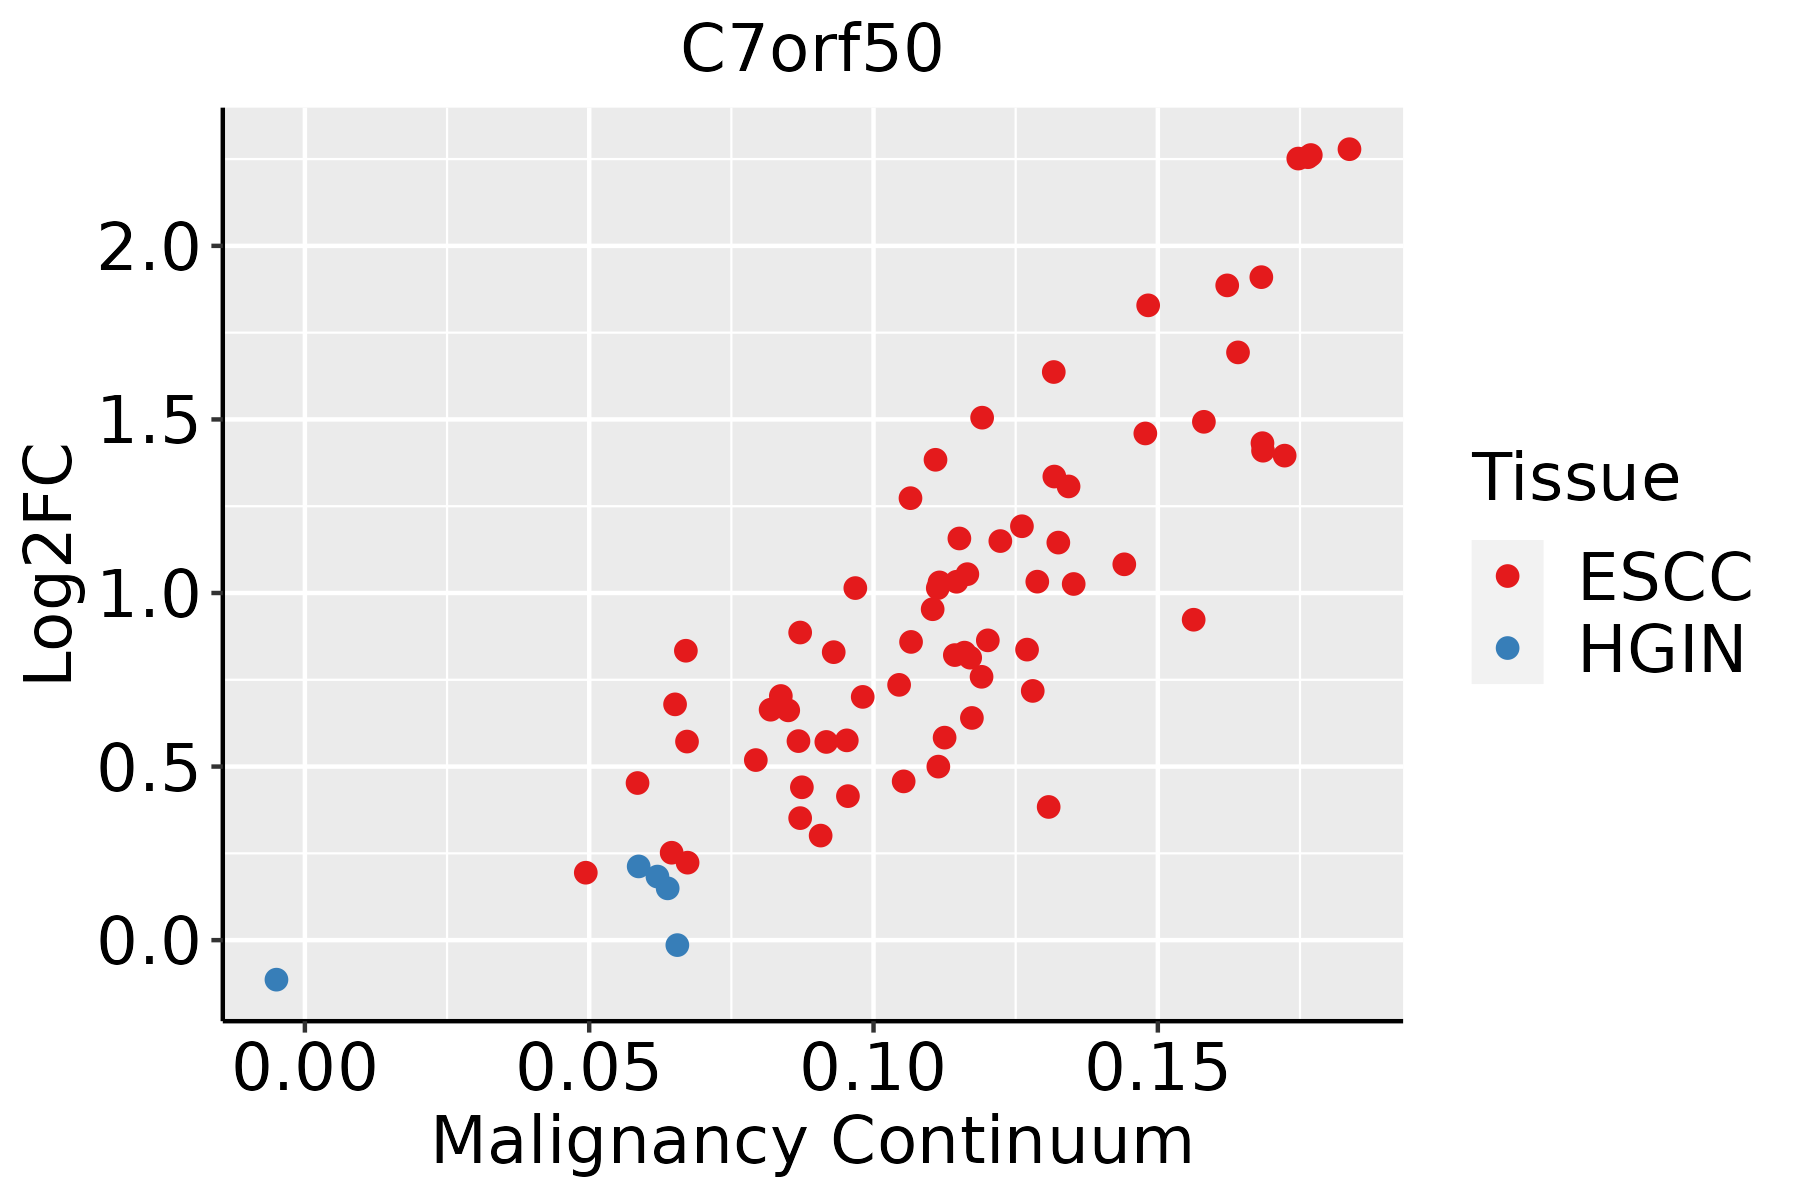 | ESCC: Esophageal squamous cell carcinoma |
| HGIN: High-grade intraepithelial neoplasias | ||
| LGIN: Low-grade intraepithelial neoplasias | ||
| Liver | 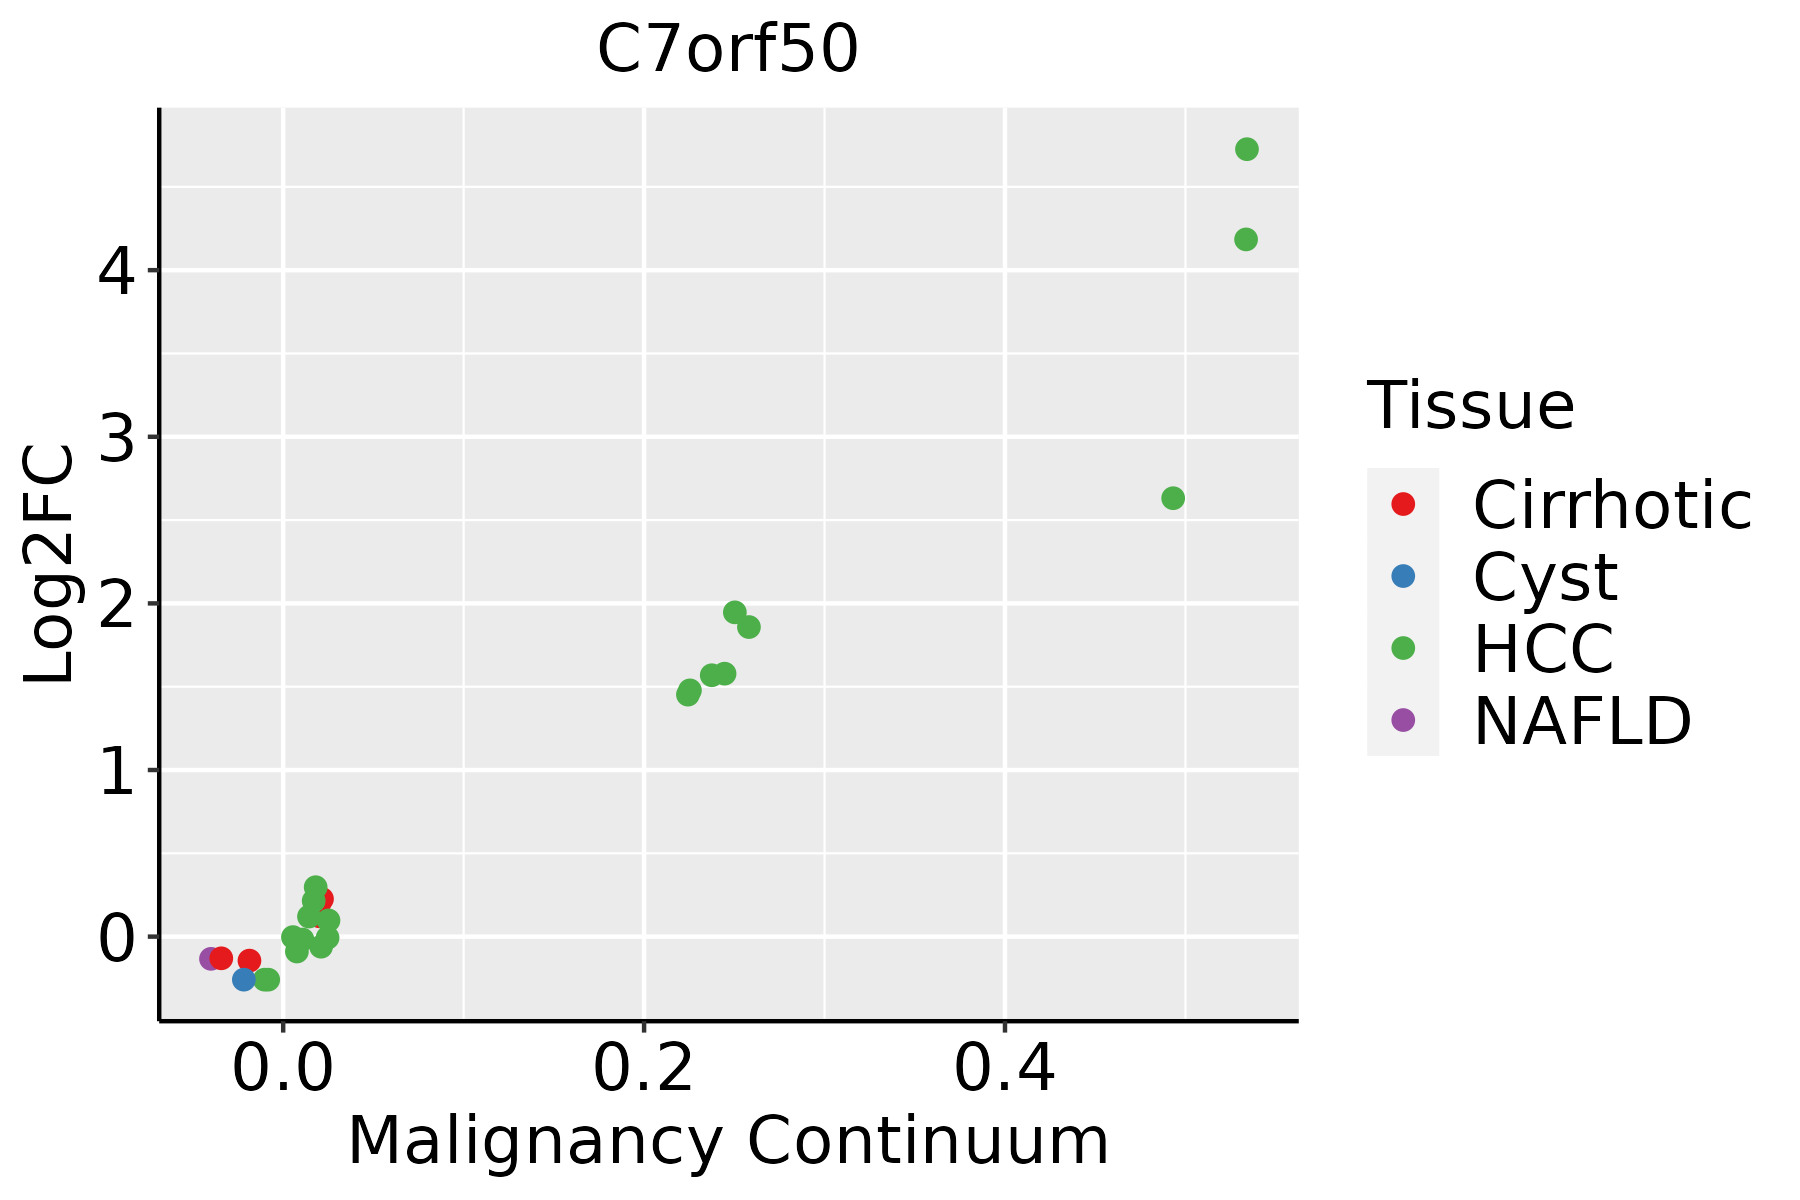 | HCC: Hepatocellular carcinoma |
| NAFLD: Non-alcoholic fatty liver disease | ||
| Oral Cavity | 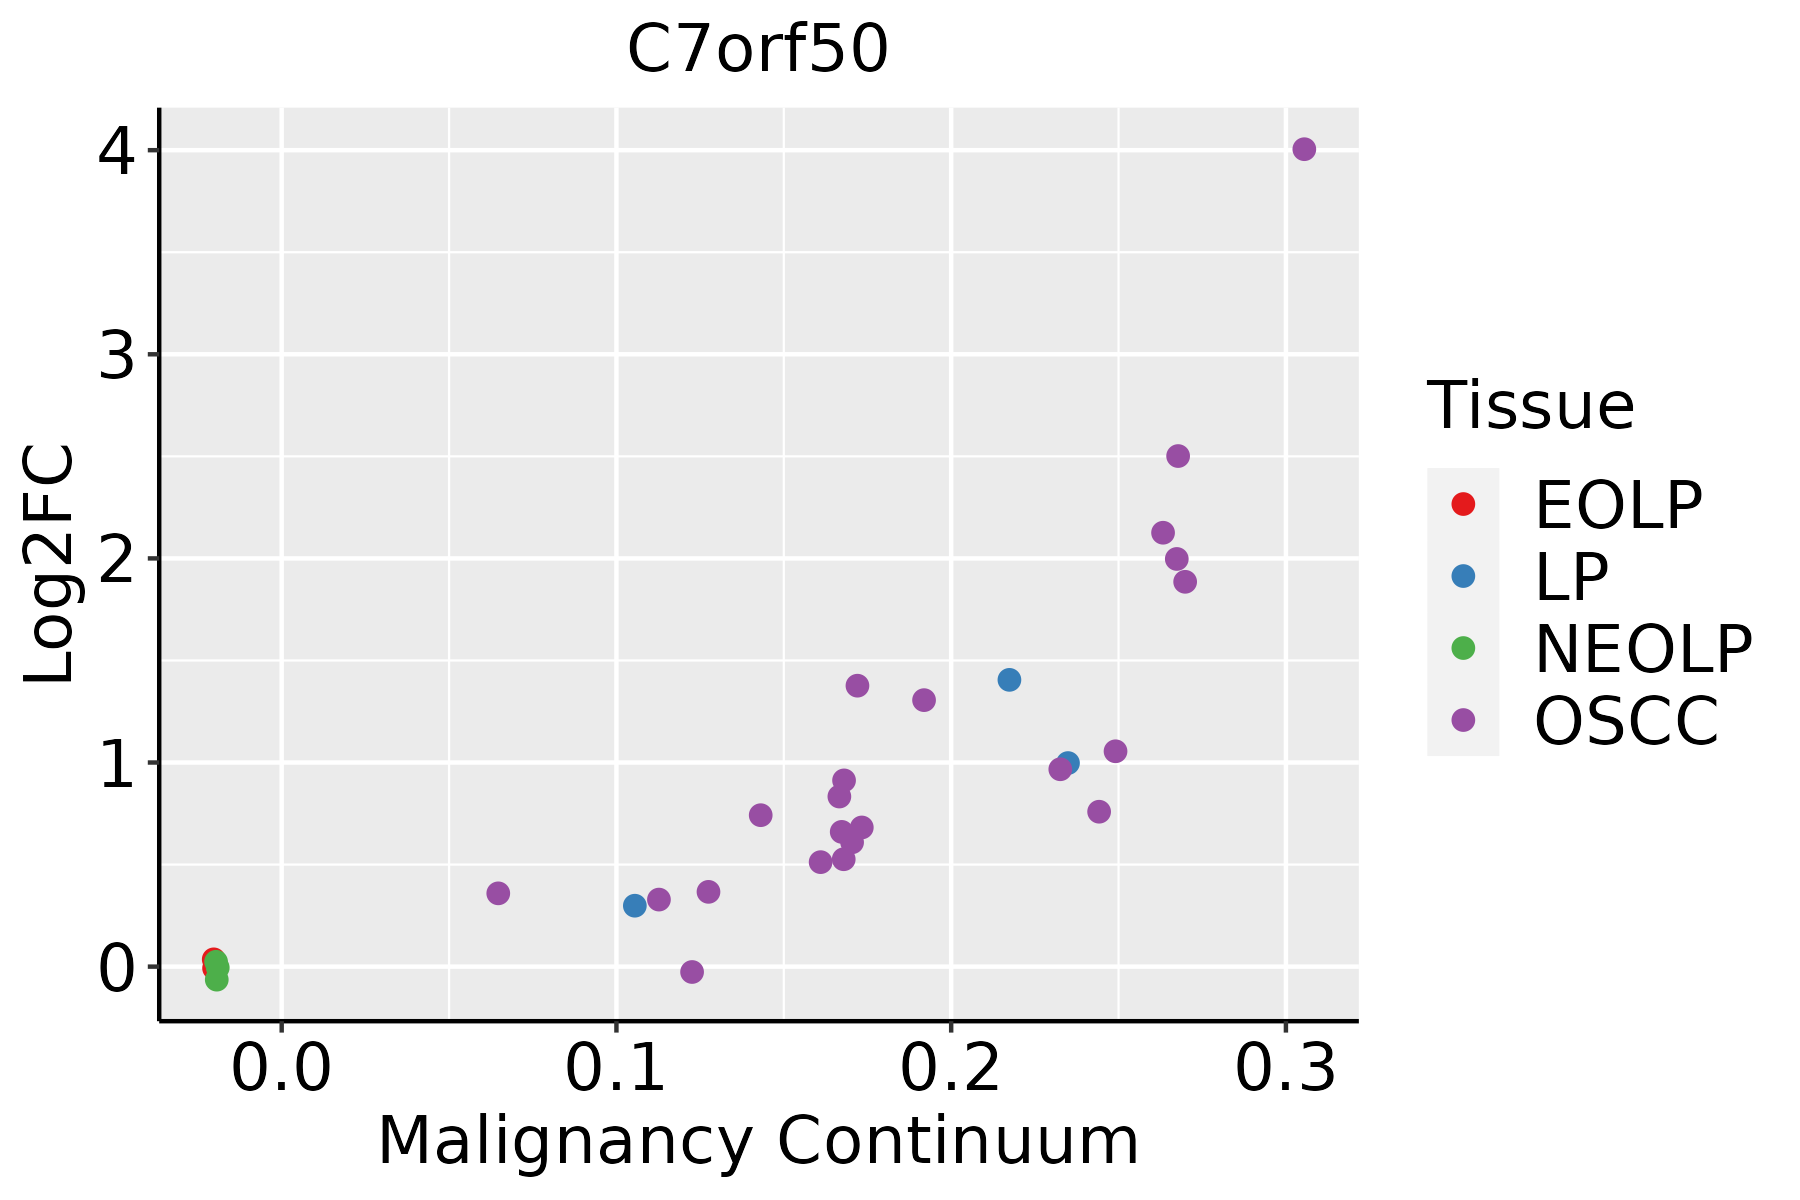 | EOLP: Erosive Oral lichen planus |
| LP: leukoplakia | ||
| NEOLP: Non-erosive oral lichen planus | ||
| OSCC: Oral squamous cell carcinoma | ||
| Skin | 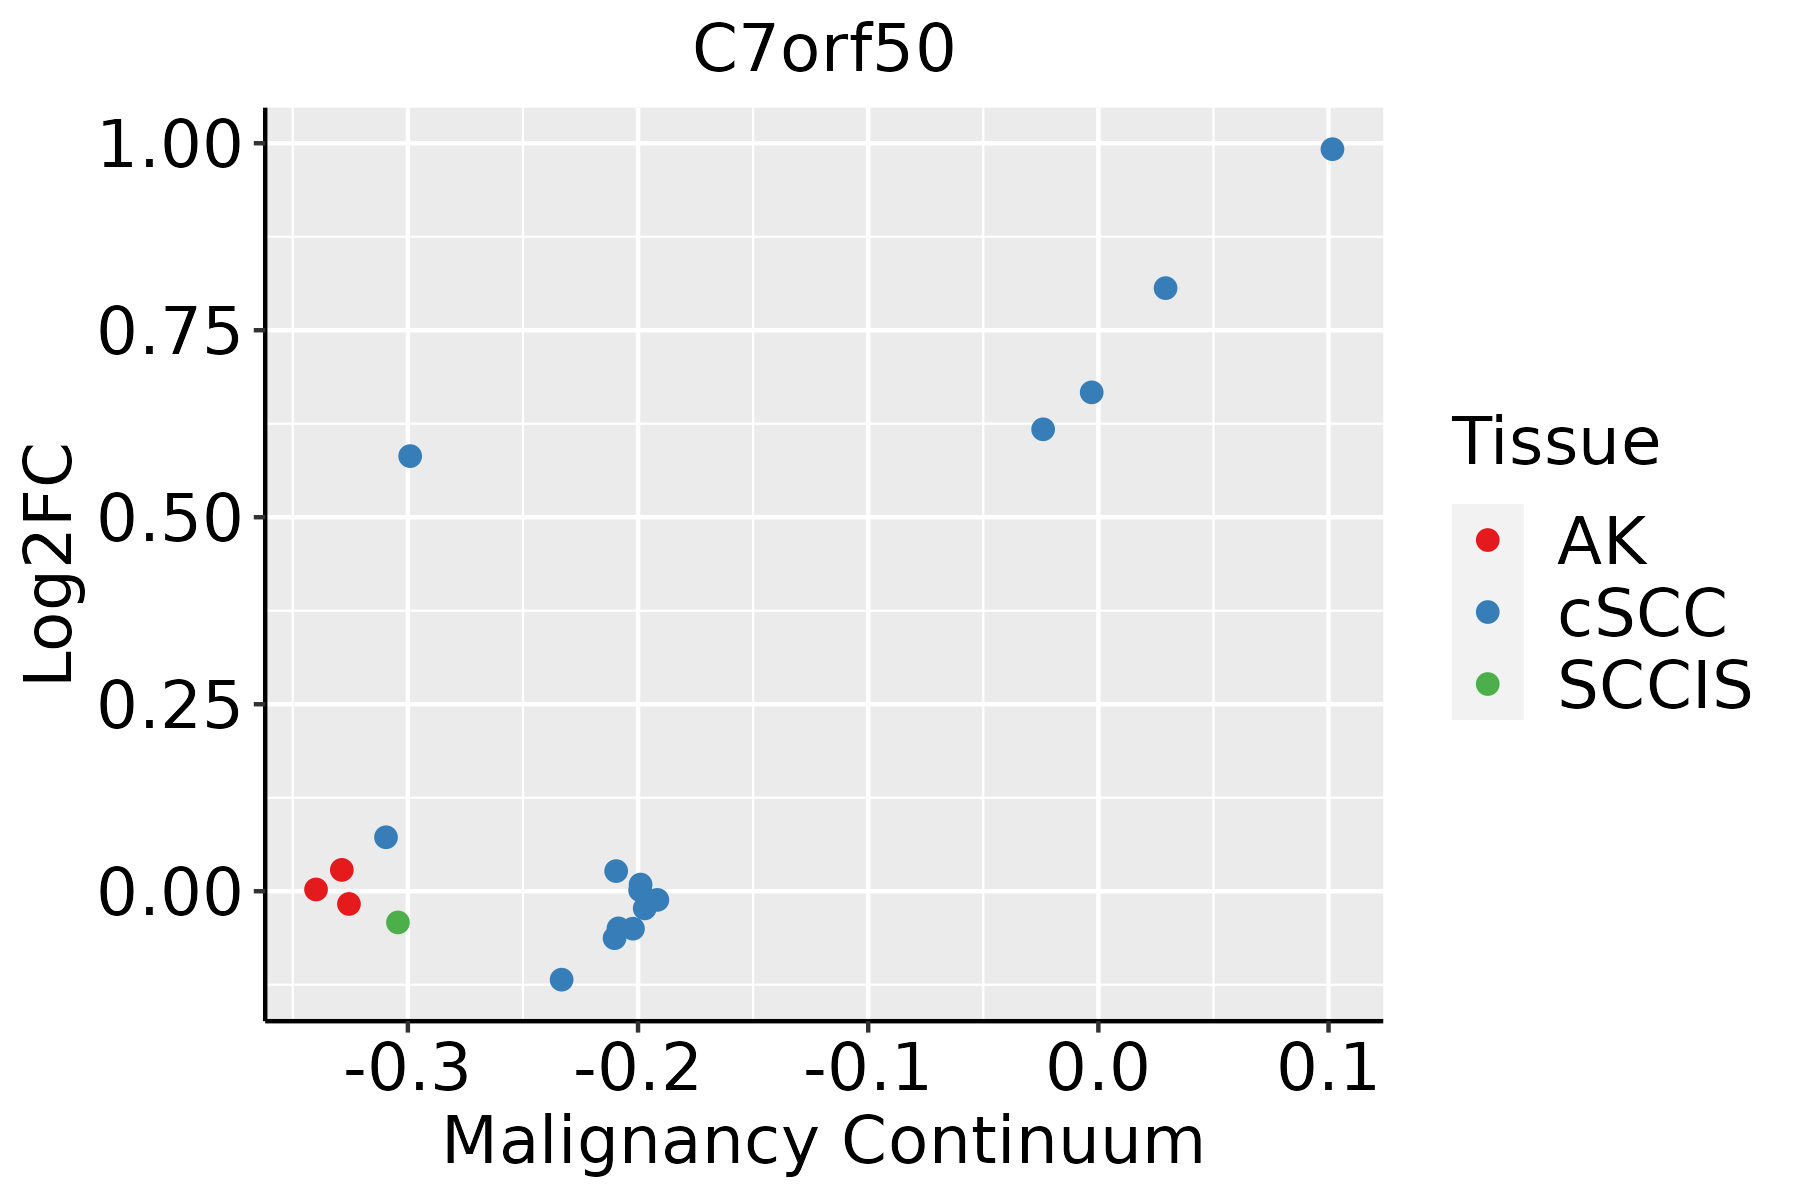 | AK: Actinic keratosis |
| cSCC: Cutaneous squamous cell carcinoma | ||
| SCCIS:squamous cell carcinoma in situ | ||
| Thyroid | 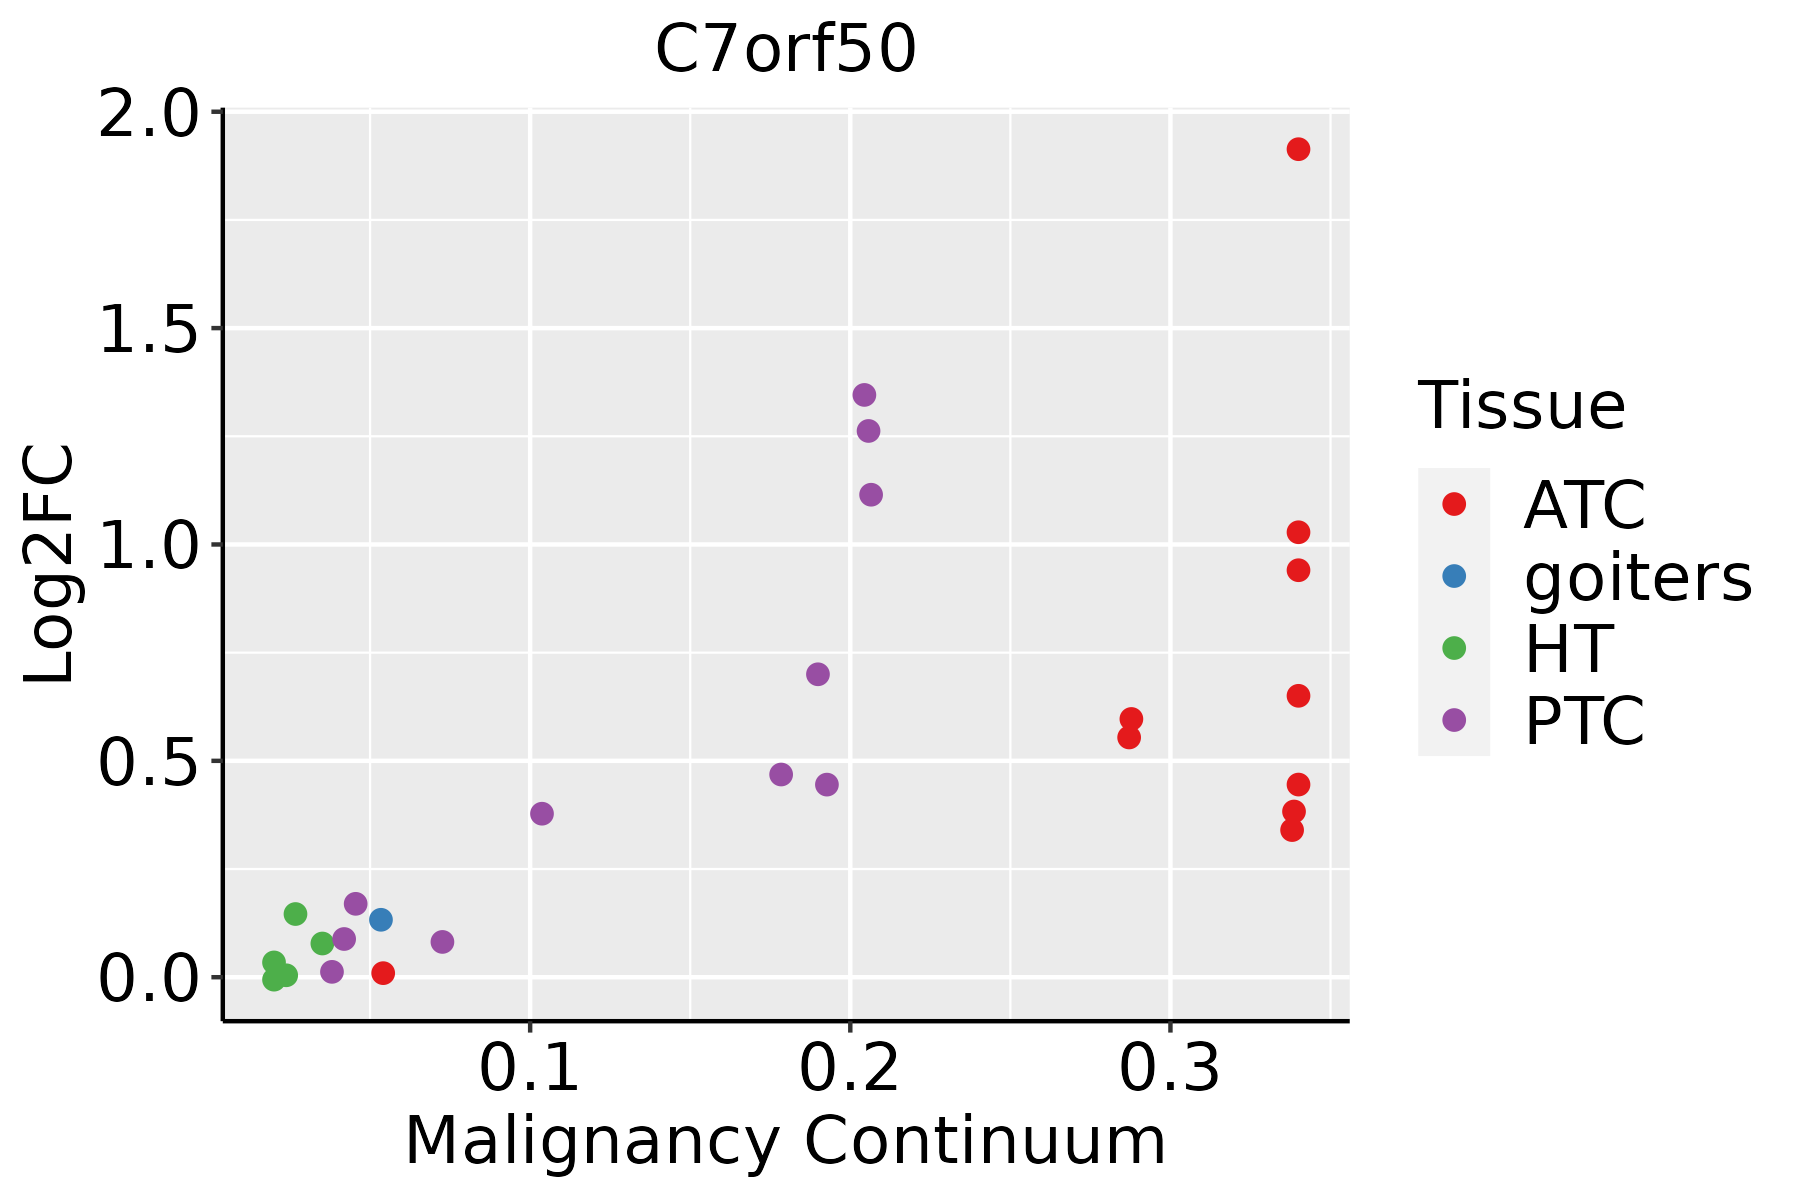 | ATC: Anaplastic thyroid cancer |
| HT: Hashimoto's thyroiditis | ||
| PTC: Papillary thyroid cancer |
| ∗log2FC in expression of this searched gene in stem-like cells from each diseased tissue sample relative to stem-like cells in normal samples in each tissue plotted against the malignancy continuum. Samples are colored based on if they are from different disease stage. |
Top |
Malignant transformation related pathway analysis |
| Find out the enriched GO biological processes and KEGG pathways involved in transition from healthy to precancer to cancer |
| Tissue | Disease Stage | Enriched GO biological Processes |
| Colorectum | AD |  |
| Colorectum | SER |  |
| Colorectum | MSS |  |
| Colorectum | MSI-H |  |
| Colorectum | FAP |  |
| ∗Top 15 enriched GO BP terms are showed in the bar plot of each disease state in each tissue. Each row represents a significant GO biological process which is colored according to the -log10(p.adjust). |
| Page: 1 2 3 4 5 6 7 8 9 |
| GO ID | Tissue | Disease Stage | Description | Gene Ratio | Bg Ratio | pvalue | p.adjust | Count |
| Page: 1 |
| Pathway ID | Tissue | Disease Stage | Description | Gene Ratio | Bg Ratio | pvalue | p.adjust | qvalue | Count |
| Page: 1 |
Top |
Cell-cell communication analysis |
| Identification of potential cell-cell interactions between two cell types and their ligand-receptor pairs for different disease states |
| Ligand | Receptor | LRpair | Pathway | Tissue | Disease Stage |
| Page: 1 |
Top |
Single-cell gene regulatory network inference analysis |
| Find out the significant the regulons (TFs) and the target genes of each regulon across cell types for different disease states |
| TF | Cell Type | Tissue | Disease Stage | Target Gene | RSS | Regulon Activity |
| ∗The dot plots of a searched regulon are shown for all cell subpopulations in each disease state of each tissue based on the regulon specific score inferred using pySCENIC and by calculating the average expression. |
| Page: 1 |
Top |
Somatic mutation of malignant transformation related genes |
| Annotation of somatic variants for genes involved in malignant transformation |
| Hugo Symbol | Variant Class | Variant Classification | dbSNP RS | HGVSc | HGVSp | HGVSp Short | SWISSPROT | BIOTYPE | SIFT | PolyPhen | Tumor Sample Barcode | Tissue | Histology | Sex | Age | Stage | Therapy Types | Drugs | Outcome |
| C7orf50 | SNV | Missense_Mutation | c.125N>G | p.Ser42Cys | p.S42C | Q9BRJ6 | protein_coding | tolerated(0.06) | benign(0.133) | TCGA-A7-A26H-01 | Breast | breast invasive carcinoma | Female | >=65 | I/II | Hormone Therapy | anastrozole | PD | |
| C7orf50 | SNV | Missense_Mutation | c.463N>T | p.Ala155Ser | p.A155S | Q9BRJ6 | protein_coding | tolerated(0.07) | possibly_damaging(0.56) | TCGA-E2-A10A-01 | Breast | breast invasive carcinoma | Female | <65 | I/II | Hormone Therapy | zoladex | SD | |
| C7orf50 | SNV | Missense_Mutation | novel | c.137N>A | p.Ala46Asp | p.A46D | Q9BRJ6 | protein_coding | deleterious_low_confidence(0.04) | probably_damaging(0.946) | TCGA-EW-A1P5-01 | Breast | breast invasive carcinoma | Female | >=65 | I/II | Hormone Therapy | anastrozole | SD |
| C7orf50 | SNV | Missense_Mutation | rs190705576 | c.65C>T | p.Ala22Val | p.A22V | Q9BRJ6 | protein_coding | tolerated(1) | benign(0) | TCGA-2W-A8YY-01 | Cervix | cervical & endocervical cancer | Female | <65 | I/II | Chemotherapy | cisplatin | CR |
| C7orf50 | SNV | Missense_Mutation | rs142388850 | c.560G>A | p.Arg187Gln | p.R187Q | Q9BRJ6 | protein_coding | deleterious(0) | possibly_damaging(0.805) | TCGA-ZX-AA5X-01 | Cervix | cervical & endocervical cancer | Female | <65 | III/IV | Unknown | Unknown | SD |
| C7orf50 | deletion | Frame_Shift_Del | rs767376979 | c.535delN | p.Leu179CysfsTer136 | p.L179Cfs*136 | Q9BRJ6 | protein_coding | TCGA-5M-AAT6-01 | Colorectum | colon adenocarcinoma | Female | <65 | III/IV | Unknown | Unknown | PD | ||
| C7orf50 | deletion | Frame_Shift_Del | rs767376979 | c.535delN | p.Leu179CysfsTer136 | p.L179Cfs*136 | Q9BRJ6 | protein_coding | TCGA-AZ-4313-01 | Colorectum | colon adenocarcinoma | Female | <65 | I/II | Unknown | Unknown | SD | ||
| C7orf50 | deletion | Frame_Shift_Del | rs767376979 | c.535delN | p.Leu179CysfsTer136 | p.L179Cfs*136 | Q9BRJ6 | protein_coding | TCGA-AZ-6598-01 | Colorectum | colon adenocarcinoma | Female | >=65 | I/II | Unknown | Unknown | SD | ||
| C7orf50 | deletion | Frame_Shift_Del | rs767376979 | c.535delN | p.Leu179CysfsTer136 | p.L179Cfs*136 | Q9BRJ6 | protein_coding | TCGA-CK-5916-01 | Colorectum | colon adenocarcinoma | Female | >=65 | I/II | Unknown | Unknown | PD | ||
| C7orf50 | deletion | Frame_Shift_Del | rs767376979 | c.535delN | p.Leu179CysfsTer136 | p.L179Cfs*136 | Q9BRJ6 | protein_coding | TCGA-CM-6171-01 | Colorectum | colon adenocarcinoma | Female | >=65 | I/II | Unknown | Unknown | SD |
| Page: 1 2 3 4 |
Top |
Related drugs of malignant transformation related genes |
| Identification of chemicals and drugs interact with genes involved in malignant transfromation |
| (DGIdb 4.0) |
| Entrez ID | Symbol | Category | Interaction Types | Drug Claim Name | Drug Name | PMIDs |
| Page: 1 |

Copyright 2023-Present -The University of Texas Health Science Center at Houston |