
|
|||||
|
 | |
| |
| |
| |
| |
| |
|
Gene: C6orf203 |
Gene summary for C6ORF203 |
| Gene information | Species | Human | Gene symbol | C6orf203 | Gene ID | 51250 |
| Gene name | mitochondrial transcription rescue factor 1 | |
| Gene Alias | C6orf203 | |
| Cytomap | 6q21 | |
| Gene Type | protein-coding | GO ID | GO:0000959 | UniProtAcc | Q9P0P8 |
Top |
Malignant transformation analysis |
| Identification of the aberrant gene expression in precancerous and cancerous lesions by comparing the gene expression of stem-like cells in diseased tissues with normal stem cells |
| Entrez ID | Symbol | Replicates | Species | Organ | Tissue | Adj P-value | Log2FC | Malignancy |
| 51250 | C6orf203 | GSM4909315 | Human | Breast | IDC | 5.85e-16 | 5.23e-01 | 0.21 |
| 51250 | C6orf203 | GSM4909316 | Human | Breast | IDC | 1.57e-07 | 5.84e-01 | 0.21 |
| 51250 | C6orf203 | DCIS2 | Human | Breast | DCIS | 1.12e-19 | 2.82e-02 | 0.0085 |
| 51250 | C6orf203 | P1T-E | Human | Esophagus | ESCC | 9.49e-04 | 1.79e-01 | 0.0875 |
| 51250 | C6orf203 | P2T-E | Human | Esophagus | ESCC | 4.36e-18 | 2.87e-01 | 0.1177 |
| 51250 | C6orf203 | P4T-E | Human | Esophagus | ESCC | 8.42e-26 | 4.75e-01 | 0.1323 |
| 51250 | C6orf203 | P5T-E | Human | Esophagus | ESCC | 1.32e-16 | 2.45e-01 | 0.1327 |
| 51250 | C6orf203 | P8T-E | Human | Esophagus | ESCC | 3.87e-13 | 2.14e-01 | 0.0889 |
| 51250 | C6orf203 | P9T-E | Human | Esophagus | ESCC | 1.14e-11 | 1.91e-01 | 0.1131 |
| 51250 | C6orf203 | P10T-E | Human | Esophagus | ESCC | 5.01e-22 | 3.11e-01 | 0.116 |
| 51250 | C6orf203 | P11T-E | Human | Esophagus | ESCC | 2.23e-07 | 2.08e-01 | 0.1426 |
| 51250 | C6orf203 | P12T-E | Human | Esophagus | ESCC | 5.68e-25 | 4.17e-01 | 0.1122 |
| 51250 | C6orf203 | P15T-E | Human | Esophagus | ESCC | 4.57e-16 | 3.38e-01 | 0.1149 |
| 51250 | C6orf203 | P16T-E | Human | Esophagus | ESCC | 1.46e-26 | 4.14e-01 | 0.1153 |
| 51250 | C6orf203 | P17T-E | Human | Esophagus | ESCC | 4.29e-06 | 3.01e-01 | 0.1278 |
| 51250 | C6orf203 | P19T-E | Human | Esophagus | ESCC | 6.81e-05 | 3.02e-01 | 0.1662 |
| 51250 | C6orf203 | P20T-E | Human | Esophagus | ESCC | 4.20e-14 | 2.07e-01 | 0.1124 |
| 51250 | C6orf203 | P21T-E | Human | Esophagus | ESCC | 2.87e-25 | 4.58e-01 | 0.1617 |
| 51250 | C6orf203 | P22T-E | Human | Esophagus | ESCC | 4.10e-14 | 2.33e-01 | 0.1236 |
| 51250 | C6orf203 | P23T-E | Human | Esophagus | ESCC | 2.10e-18 | 4.12e-01 | 0.108 |
| Page: 1 2 3 4 5 |
| Tissue | Expression Dynamics | Abbreviation |
| Breast | 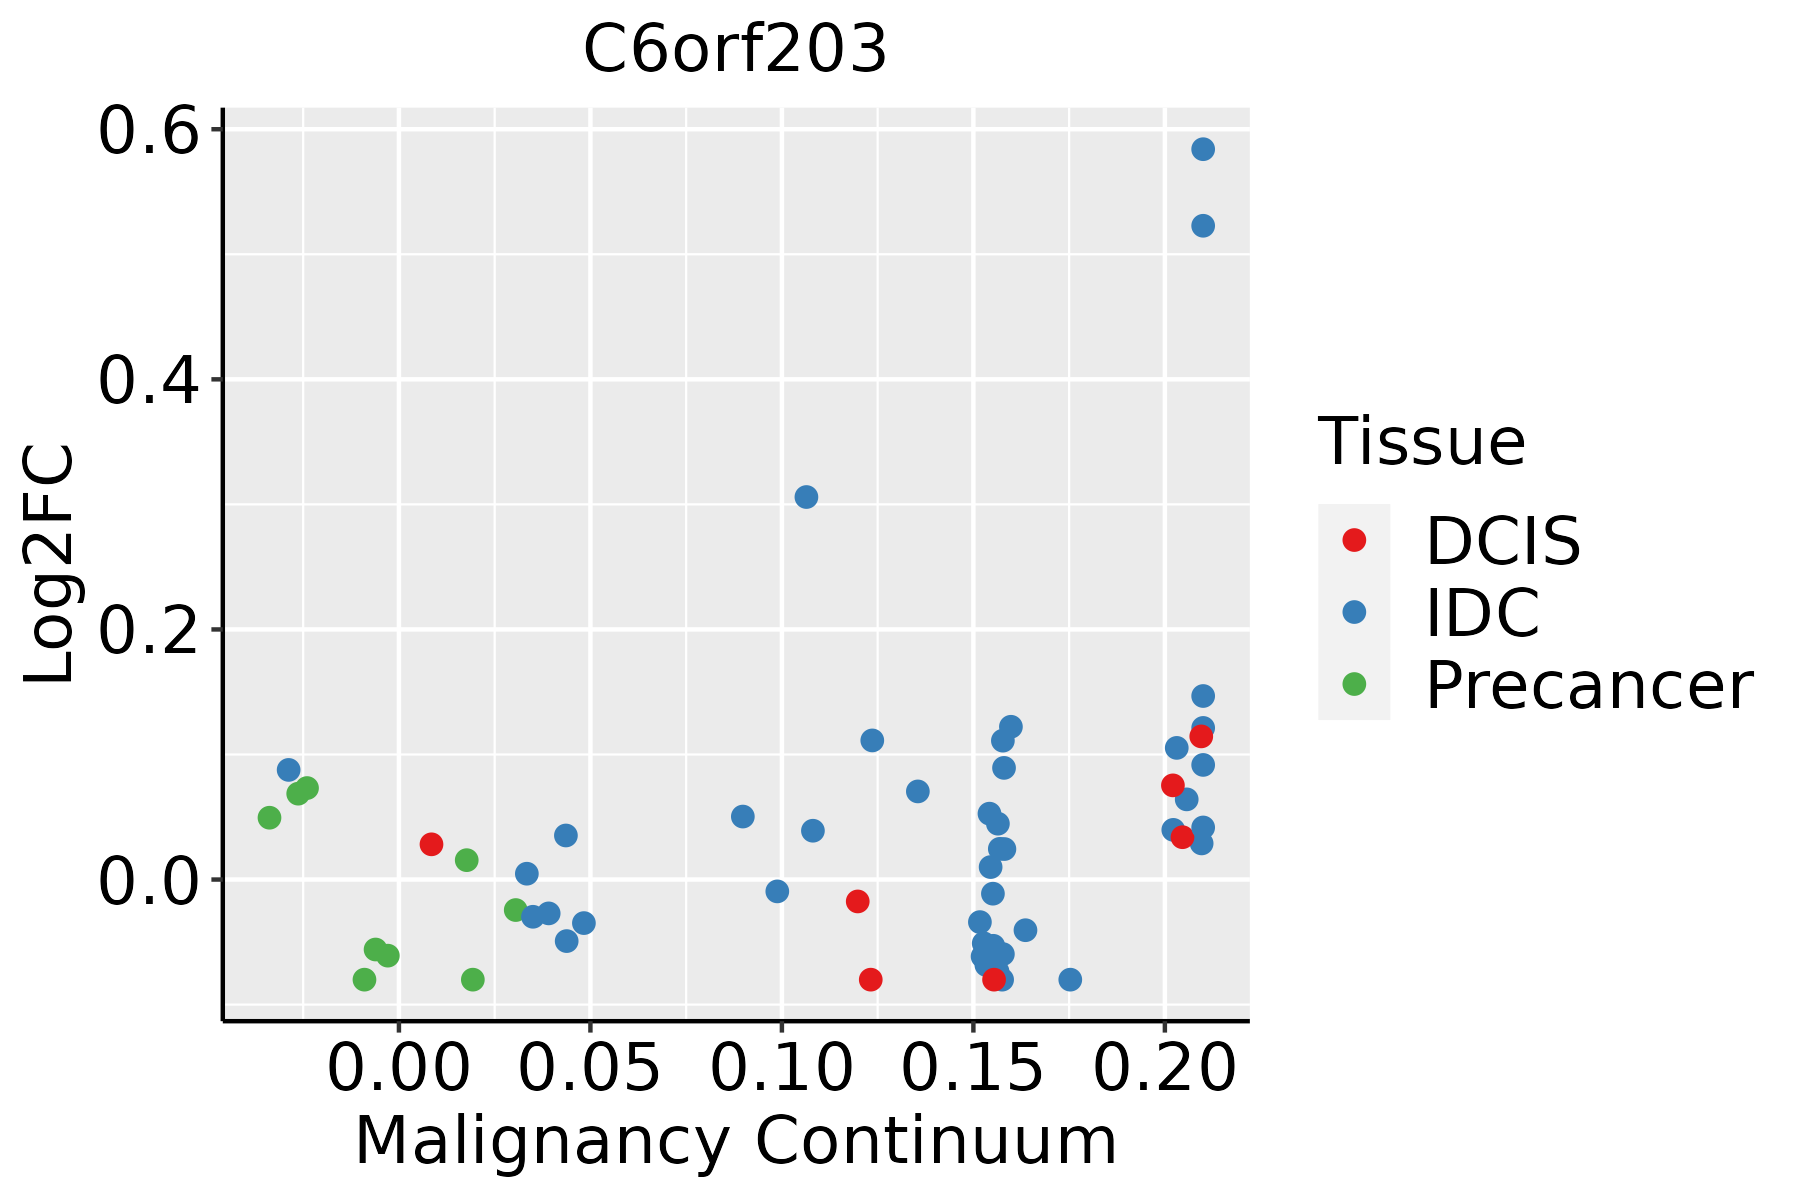 | IDC: Invasive ductal carcinoma |
| DCIS: Ductal carcinoma in situ | ||
| Precancer(BRCA1-mut): Precancerous lesion from BRCA1 mutation carriers | ||
| Esophagus | 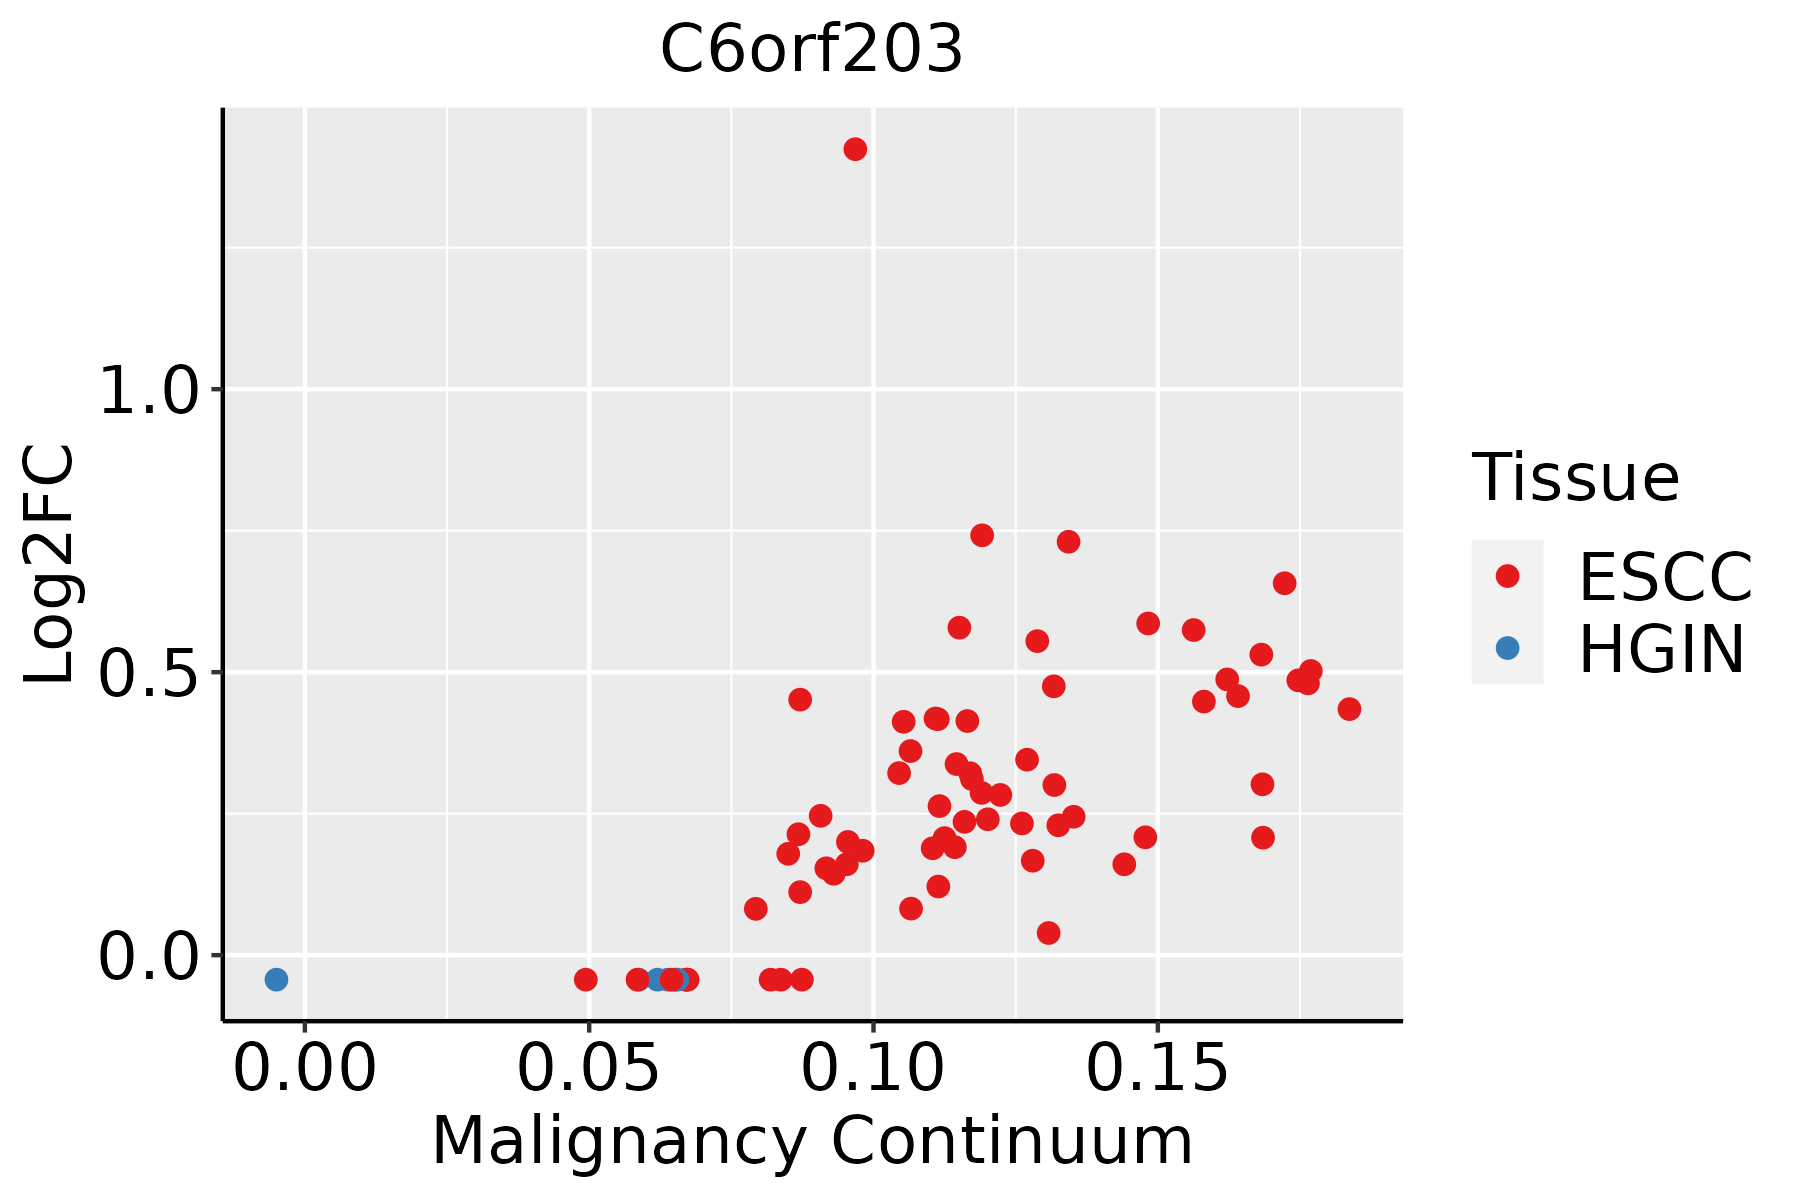 | ESCC: Esophageal squamous cell carcinoma |
| HGIN: High-grade intraepithelial neoplasias | ||
| LGIN: Low-grade intraepithelial neoplasias | ||
| Liver | 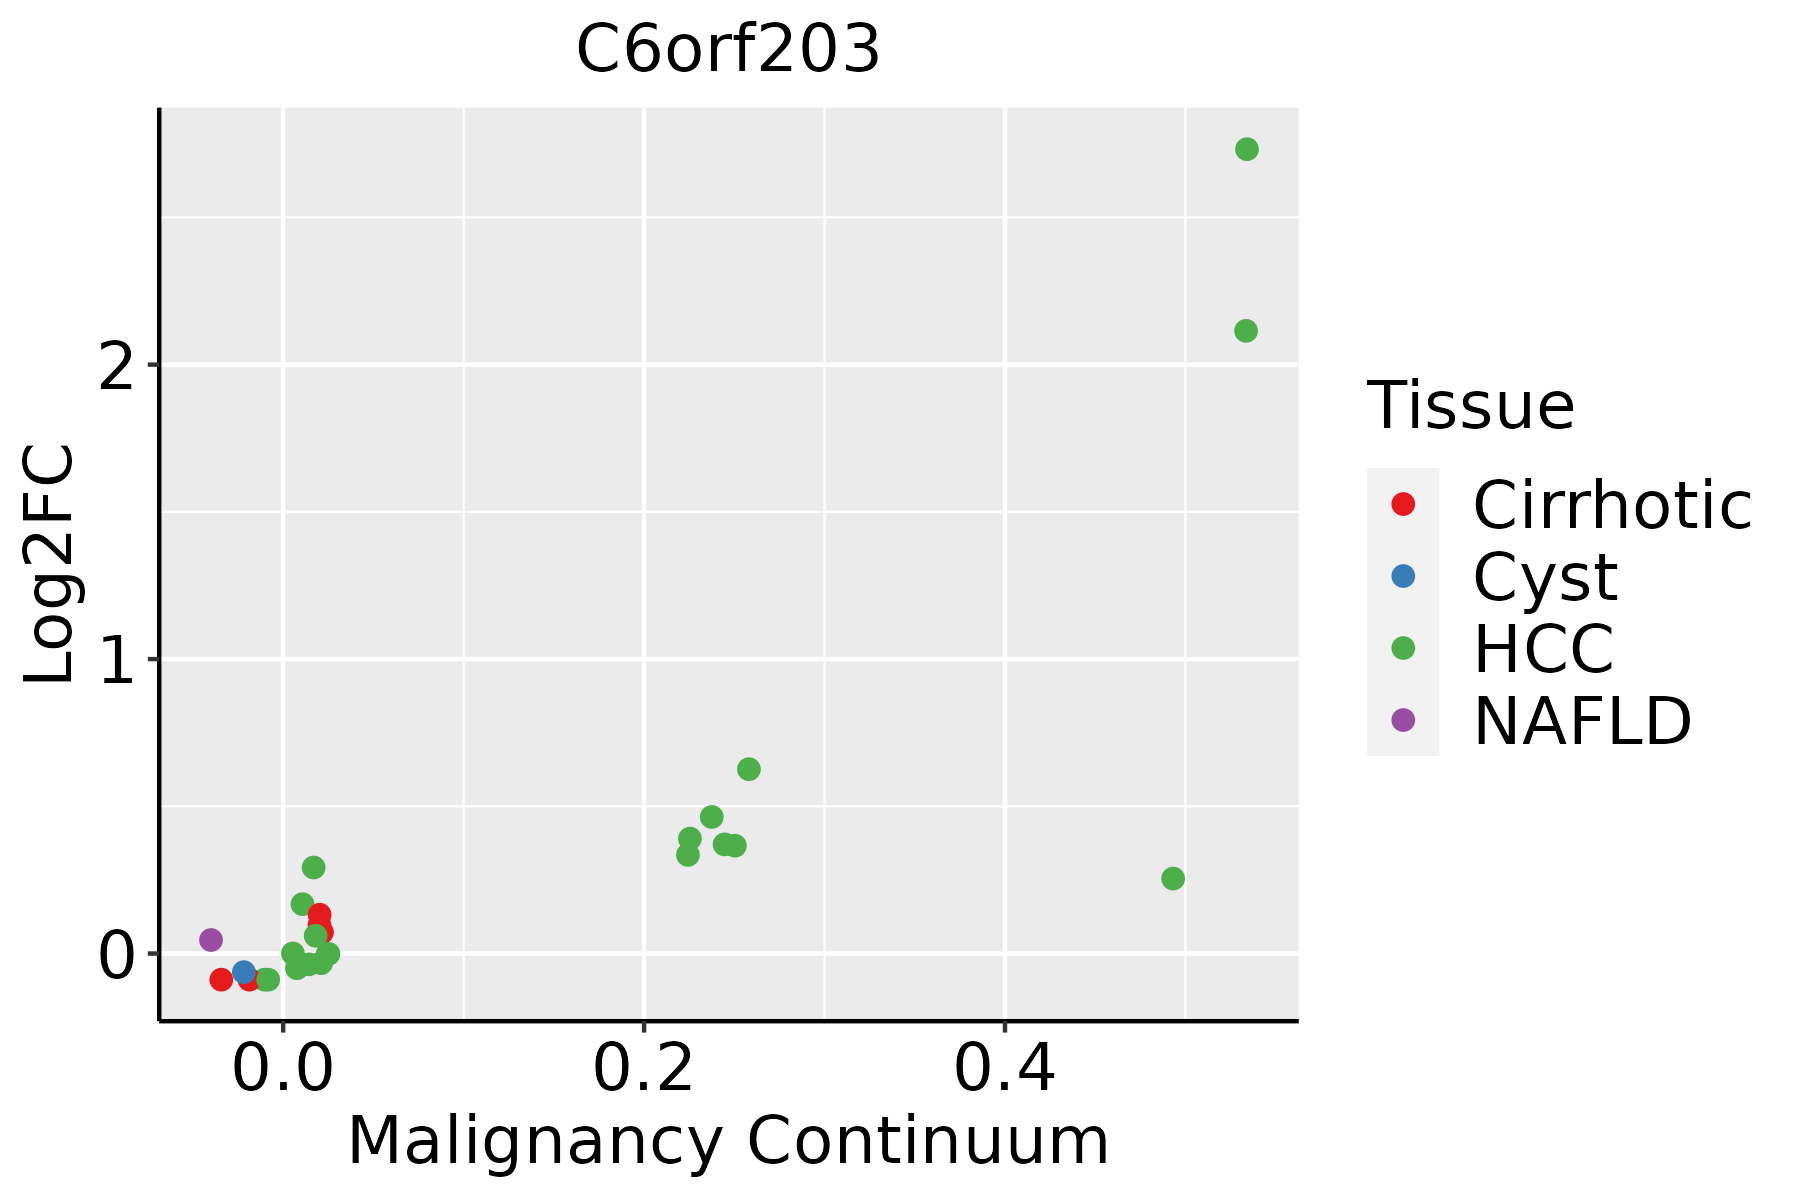 | HCC: Hepatocellular carcinoma |
| NAFLD: Non-alcoholic fatty liver disease | ||
| Oral Cavity | 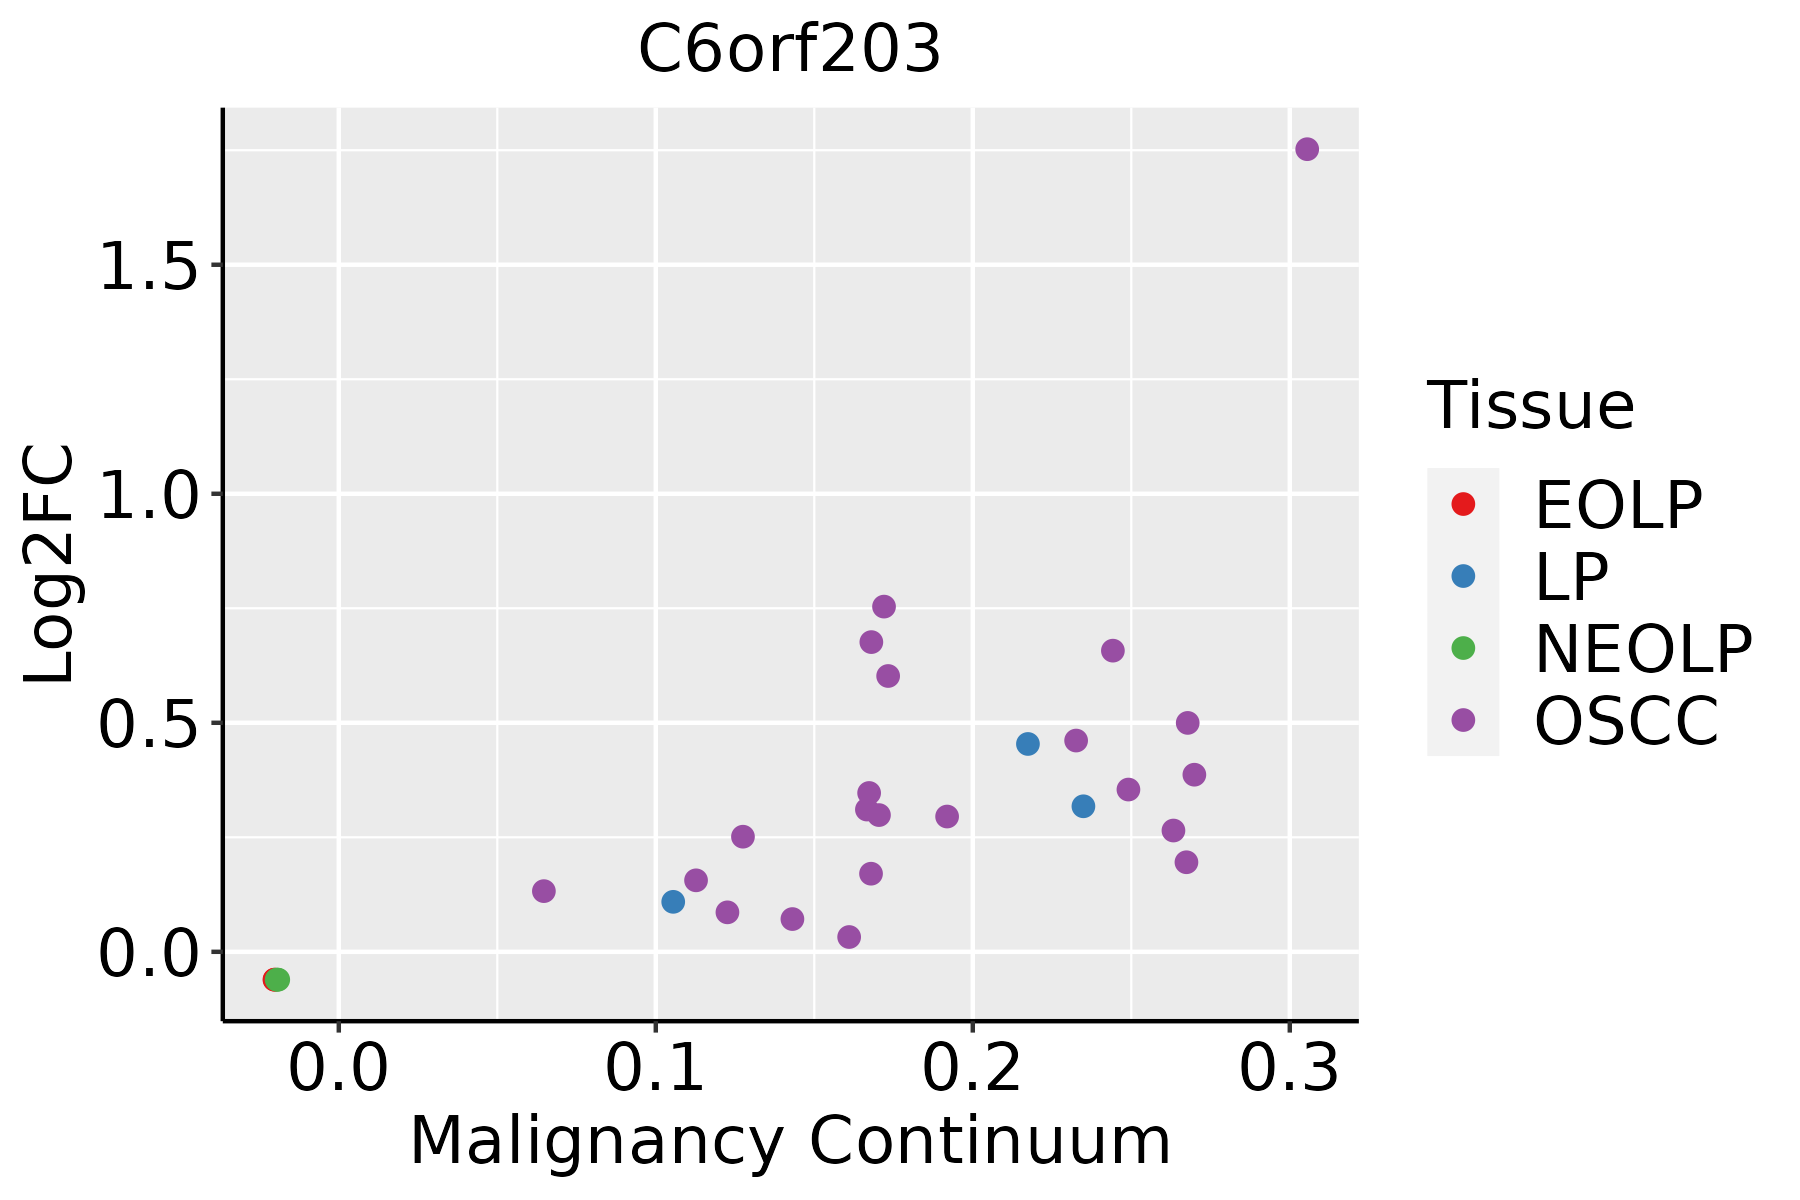 | EOLP: Erosive Oral lichen planus |
| LP: leukoplakia | ||
| NEOLP: Non-erosive oral lichen planus | ||
| OSCC: Oral squamous cell carcinoma | ||
| Thyroid | 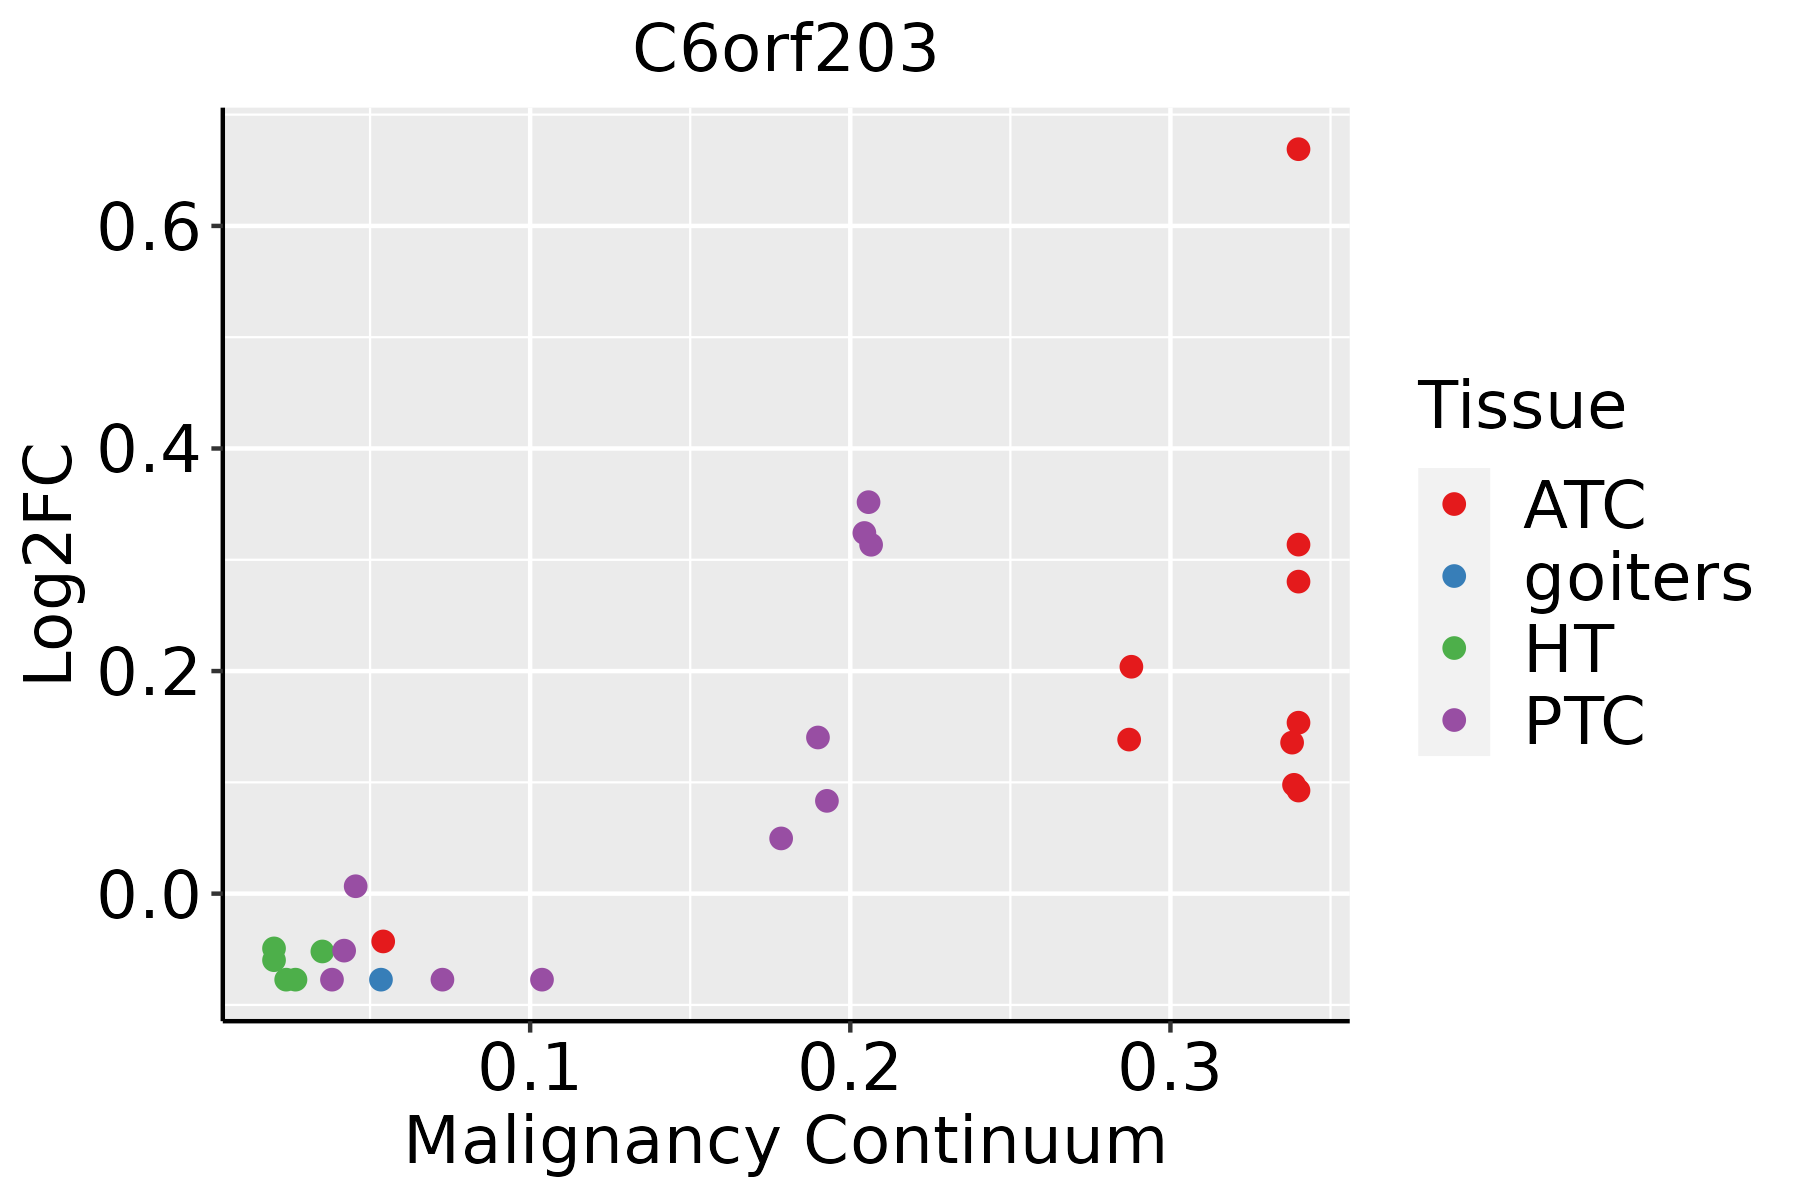 | ATC: Anaplastic thyroid cancer |
| HT: Hashimoto's thyroiditis | ||
| PTC: Papillary thyroid cancer |
| ∗log2FC in expression of this searched gene in stem-like cells from each diseased tissue sample relative to stem-like cells in normal samples in each tissue plotted against the malignancy continuum. Samples are colored based on if they are from different disease stage. |
Top |
Malignant transformation related pathway analysis |
| Find out the enriched GO biological processes and KEGG pathways involved in transition from healthy to precancer to cancer |
| Tissue | Disease Stage | Enriched GO biological Processes |
| Colorectum | AD |  |
| Colorectum | SER |  |
| Colorectum | MSS |  |
| Colorectum | MSI-H |  |
| Colorectum | FAP |  |
| ∗Top 15 enriched GO BP terms are showed in the bar plot of each disease state in each tissue. Each row represents a significant GO biological process which is colored according to the -log10(p.adjust). |
| Page: 1 2 3 4 5 6 7 8 9 |
| GO ID | Tissue | Disease Stage | Description | Gene Ratio | Bg Ratio | pvalue | p.adjust | Count |
| Page: 1 |
| Pathway ID | Tissue | Disease Stage | Description | Gene Ratio | Bg Ratio | pvalue | p.adjust | qvalue | Count |
| Page: 1 |
Top |
Cell-cell communication analysis |
| Identification of potential cell-cell interactions between two cell types and their ligand-receptor pairs for different disease states |
| Ligand | Receptor | LRpair | Pathway | Tissue | Disease Stage |
| Page: 1 |
Top |
Single-cell gene regulatory network inference analysis |
| Find out the significant the regulons (TFs) and the target genes of each regulon across cell types for different disease states |
| TF | Cell Type | Tissue | Disease Stage | Target Gene | RSS | Regulon Activity |
| ∗The dot plots of a searched regulon are shown for all cell subpopulations in each disease state of each tissue based on the regulon specific score inferred using pySCENIC and by calculating the average expression. |
| Page: 1 |
Top |
Somatic mutation of malignant transformation related genes |
| Annotation of somatic variants for genes involved in malignant transformation |
| Hugo Symbol | Variant Class | Variant Classification | dbSNP RS | HGVSc | HGVSp | HGVSp Short | SWISSPROT | BIOTYPE | SIFT | PolyPhen | Tumor Sample Barcode | Tissue | Histology | Sex | Age | Stage | Therapy Types | Drugs | Outcome |
| C6orf203 | SNV | Missense_Mutation | c.472N>A | p.Asp158Asn | p.D158N | protein_coding | tolerated(0.06) | benign(0.222) | TCGA-BH-A0HF-01 | Breast | breast invasive carcinoma | Female | >=65 | I/II | Hormone Therapy | arimidex | SD | ||
| C6orf203 | insertion | Nonsense_Mutation | novel | c.596_597insCAGTGACTAAGGTCAGGGCCTTTACTCACCTGCCCCTCCTCT | p.Glu199delinsAspSerAspTerGlyGlnGlyLeuTyrSerProAlaProProLeu | p.E199delinsDSD*GQGLYSPAPPL | protein_coding | TCGA-AO-A0JB-01 | Breast | breast invasive carcinoma | Female | <65 | III/IV | Chemotherapy | cyclophosphamide | SD | |||
| C6orf203 | SNV | Missense_Mutation | c.281N>T | p.Arg94Met | p.R94M | protein_coding | deleterious(0.01) | possibly_damaging(0.482) | TCGA-AA-3663-01 | Colorectum | colon adenocarcinoma | Male | <65 | I/II | Unknown | Unknown | SD | ||
| C6orf203 | SNV | Missense_Mutation | c.442N>T | p.Arg148Trp | p.R148W | protein_coding | deleterious(0.03) | benign(0.031) | TCGA-AA-3864-01 | Colorectum | colon adenocarcinoma | Male | >=65 | I/II | Unknown | Unknown | SD | ||
| C6orf203 | SNV | Missense_Mutation | c.437N>A | p.Ser146Tyr | p.S146Y | protein_coding | deleterious(0) | probably_damaging(0.999) | TCGA-AA-A010-01 | Colorectum | colon adenocarcinoma | Female | <65 | I/II | Chemotherapy | folinic | CR | ||
| C6orf203 | SNV | Missense_Mutation | c.442N>T | p.Arg148Trp | p.R148W | protein_coding | deleterious(0.03) | benign(0.031) | TCGA-CM-4743-01 | Colorectum | colon adenocarcinoma | Male | >=65 | I/II | Chemotherapy | capecitabine | SD | ||
| C6orf203 | SNV | Missense_Mutation | novel | c.65N>G | p.Asp22Gly | p.D22G | protein_coding | tolerated(0.19) | benign(0.024) | TCGA-A5-A0G2-01 | Endometrium | uterine corpus endometrioid carcinoma | Female | <65 | III/IV | Unknown | Unknown | SD | |
| C6orf203 | SNV | Missense_Mutation | c.384G>T | p.Glu128Asp | p.E128D | protein_coding | tolerated(0.1) | benign(0.05) | TCGA-AP-A059-01 | Endometrium | uterine corpus endometrioid carcinoma | Female | >=65 | I/II | Unknown | Unknown | SD | ||
| C6orf203 | SNV | Missense_Mutation | novel | c.428N>A | p.Ala143Glu | p.A143E | protein_coding | deleterious(0.05) | benign(0.326) | TCGA-AP-A1DK-01 | Endometrium | uterine corpus endometrioid carcinoma | Female | <65 | I/II | Unknown | Unknown | SD | |
| C6orf203 | SNV | Missense_Mutation | rs144394567 | c.166C>T | p.Arg56Cys | p.R56C | protein_coding | deleterious(0.03) | benign(0.003) | TCGA-AP-A1DV-01 | Endometrium | uterine corpus endometrioid carcinoma | Female | <65 | I/II | Unknown | Unknown | SD |
| Page: 1 2 3 4 |
Top |
Related drugs of malignant transformation related genes |
| Identification of chemicals and drugs interact with genes involved in malignant transfromation |
| (DGIdb 4.0) |
| Entrez ID | Symbol | Category | Interaction Types | Drug Claim Name | Drug Name | PMIDs |
| Page: 1 |

Copyright 2023-Present -The University of Texas Health Science Center at Houston |