
|
|||||
|
 | |
| |
| |
| |
| |
| |
|
Gene: C6orf136 |
Gene summary for C6ORF136 |
| Gene information | Species | Human | Gene symbol | C6orf136 | Gene ID | 221545 |
| Gene name | chromosome 6 open reading frame 136 | |
| Gene Alias | C6orf136 | |
| Cytomap | 6p21.33 | |
| Gene Type | protein-coding | GO ID | NA | UniProtAcc | A0A1U9X7F4 |
Top |
Malignant transformation analysis |
| Identification of the aberrant gene expression in precancerous and cancerous lesions by comparing the gene expression of stem-like cells in diseased tissues with normal stem cells |
| Entrez ID | Symbol | Replicates | Species | Organ | Tissue | Adj P-value | Log2FC | Malignancy |
| 221545 | C6orf136 | HTA11_2487_2000001011 | Human | Colorectum | SER | 8.44e-08 | 5.01e-01 | -0.1808 |
| 221545 | C6orf136 | HTA11_1938_2000001011 | Human | Colorectum | AD | 5.32e-06 | 5.23e-01 | -0.0811 |
| 221545 | C6orf136 | HTA11_78_2000001011 | Human | Colorectum | AD | 1.35e-03 | 3.46e-01 | -0.1088 |
| 221545 | C6orf136 | HTA11_347_2000001011 | Human | Colorectum | AD | 1.72e-23 | 6.73e-01 | -0.1954 |
| 221545 | C6orf136 | HTA11_3361_2000001011 | Human | Colorectum | AD | 1.80e-13 | 6.15e-01 | -0.1207 |
| 221545 | C6orf136 | HTA11_83_2000001011 | Human | Colorectum | SER | 1.69e-08 | 5.98e-01 | -0.1526 |
| 221545 | C6orf136 | HTA11_696_2000001011 | Human | Colorectum | AD | 6.26e-23 | 6.10e-01 | -0.1464 |
| 221545 | C6orf136 | HTA11_866_2000001011 | Human | Colorectum | AD | 6.20e-15 | 4.01e-01 | -0.1001 |
| 221545 | C6orf136 | HTA11_1391_2000001011 | Human | Colorectum | AD | 1.16e-19 | 7.81e-01 | -0.059 |
| 221545 | C6orf136 | HTA11_2992_2000001011 | Human | Colorectum | SER | 8.92e-04 | 5.33e-01 | -0.1706 |
| 221545 | C6orf136 | HTA11_5216_2000001011 | Human | Colorectum | SER | 3.68e-02 | 7.29e-01 | -0.1462 |
| 221545 | C6orf136 | HTA11_546_2000001011 | Human | Colorectum | AD | 2.02e-04 | 5.22e-01 | -0.0842 |
| 221545 | C6orf136 | HTA11_7663_2000001011 | Human | Colorectum | SER | 1.48e-02 | 4.58e-01 | 0.0131 |
| 221545 | C6orf136 | HTA11_7696_3000711011 | Human | Colorectum | AD | 3.03e-06 | 2.53e-01 | 0.0674 |
| 221545 | C6orf136 | HTA11_7469_2000001011 | Human | Colorectum | AD | 9.26e-03 | 5.45e-01 | -0.0124 |
| 221545 | C6orf136 | HTA11_99999970781_79442 | Human | Colorectum | MSS | 4.41e-03 | 2.30e-01 | 0.294 |
| 221545 | C6orf136 | HTA11_99999971662_82457 | Human | Colorectum | MSS | 7.13e-12 | 4.23e-01 | 0.3859 |
| 221545 | C6orf136 | LZE4T | Human | Esophagus | ESCC | 7.87e-06 | 1.60e-01 | 0.0811 |
| 221545 | C6orf136 | LZE7T | Human | Esophagus | ESCC | 1.27e-05 | 4.38e-01 | 0.0667 |
| 221545 | C6orf136 | LZE8T | Human | Esophagus | ESCC | 1.18e-04 | 1.55e-01 | 0.067 |
| Page: 1 2 3 4 5 6 |
| Tissue | Expression Dynamics | Abbreviation |
| Colorectum (GSE201348) |  | FAP: Familial adenomatous polyposis |
| CRC: Colorectal cancer | ||
| Colorectum (HTA11) |  | AD: Adenomas |
| SER: Sessile serrated lesions | ||
| MSI-H: Microsatellite-high colorectal cancer | ||
| MSS: Microsatellite stable colorectal cancer | ||
| Esophagus |  | ESCC: Esophageal squamous cell carcinoma |
| HGIN: High-grade intraepithelial neoplasias | ||
| LGIN: Low-grade intraepithelial neoplasias | ||
| Liver | 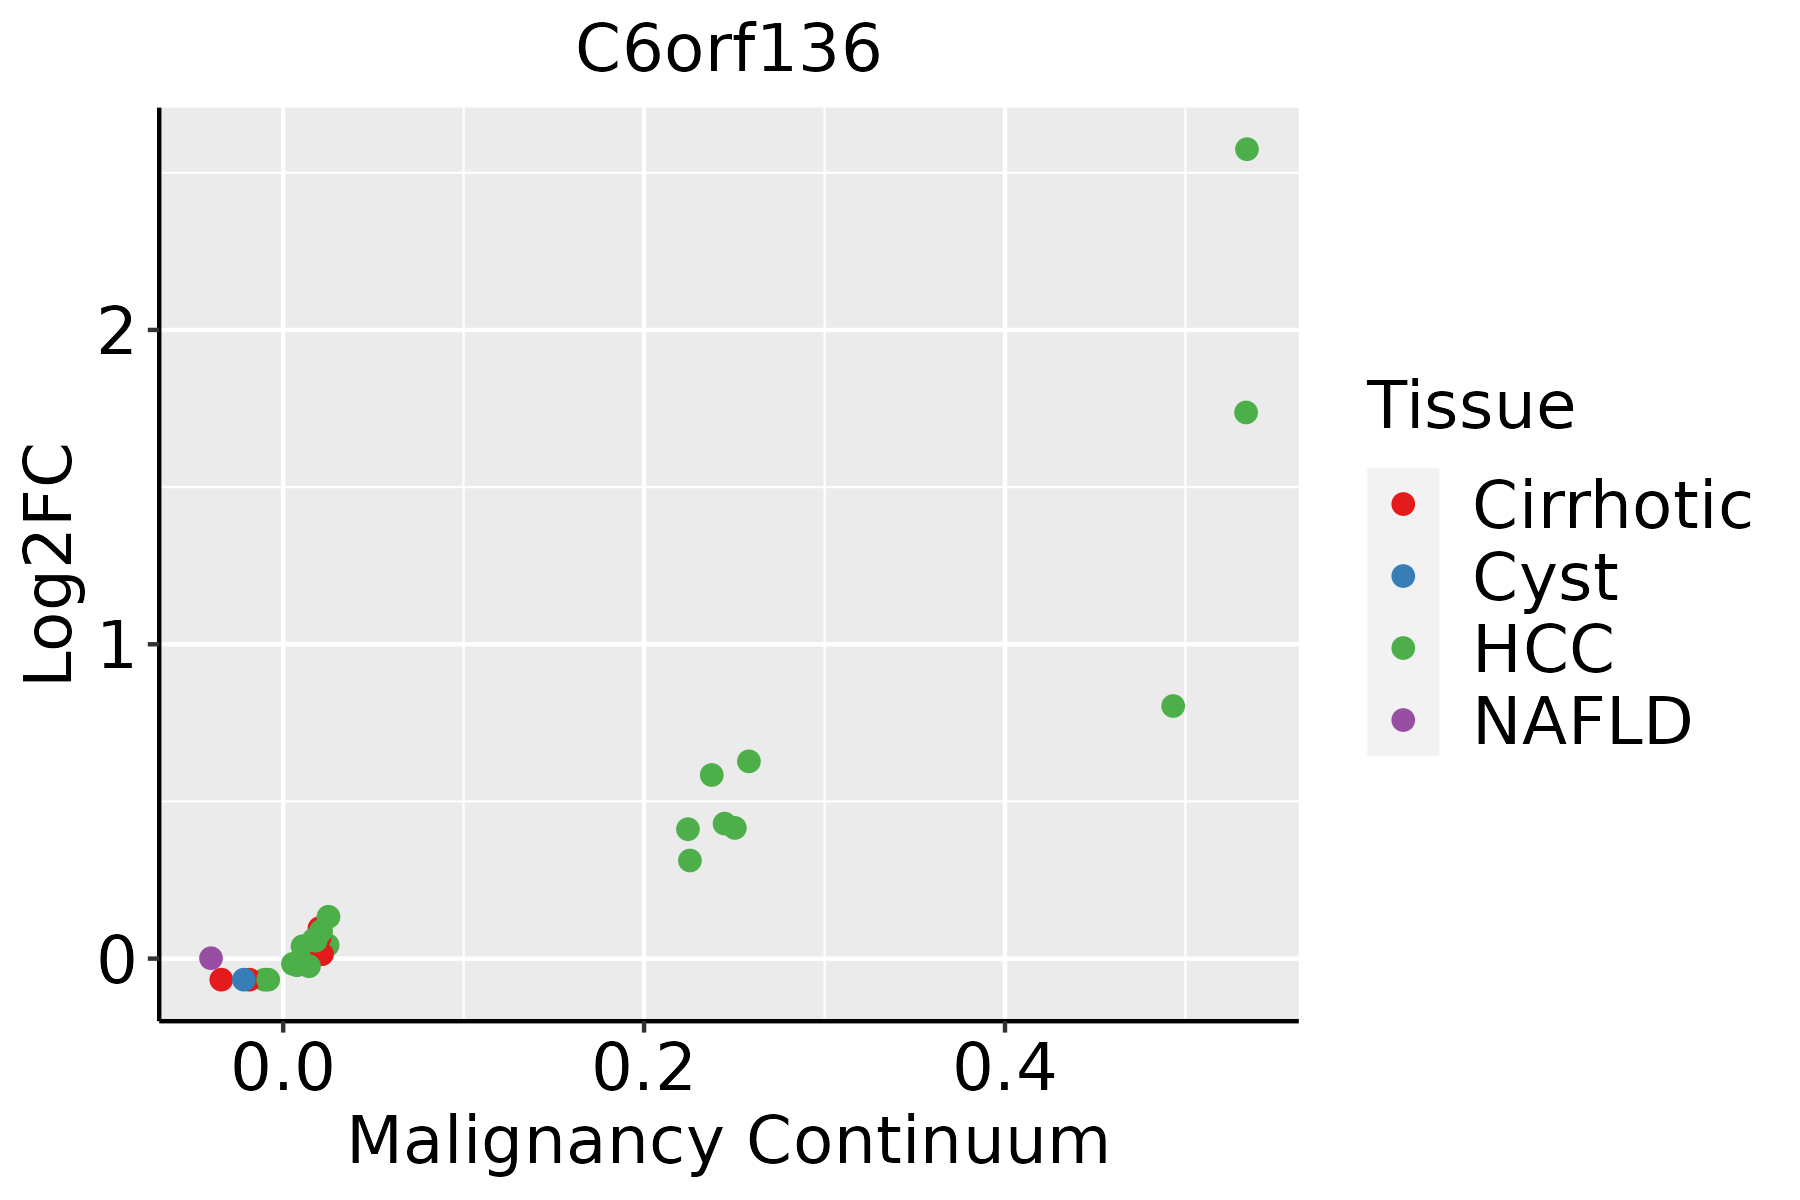 | HCC: Hepatocellular carcinoma |
| NAFLD: Non-alcoholic fatty liver disease | ||
| Oral Cavity | 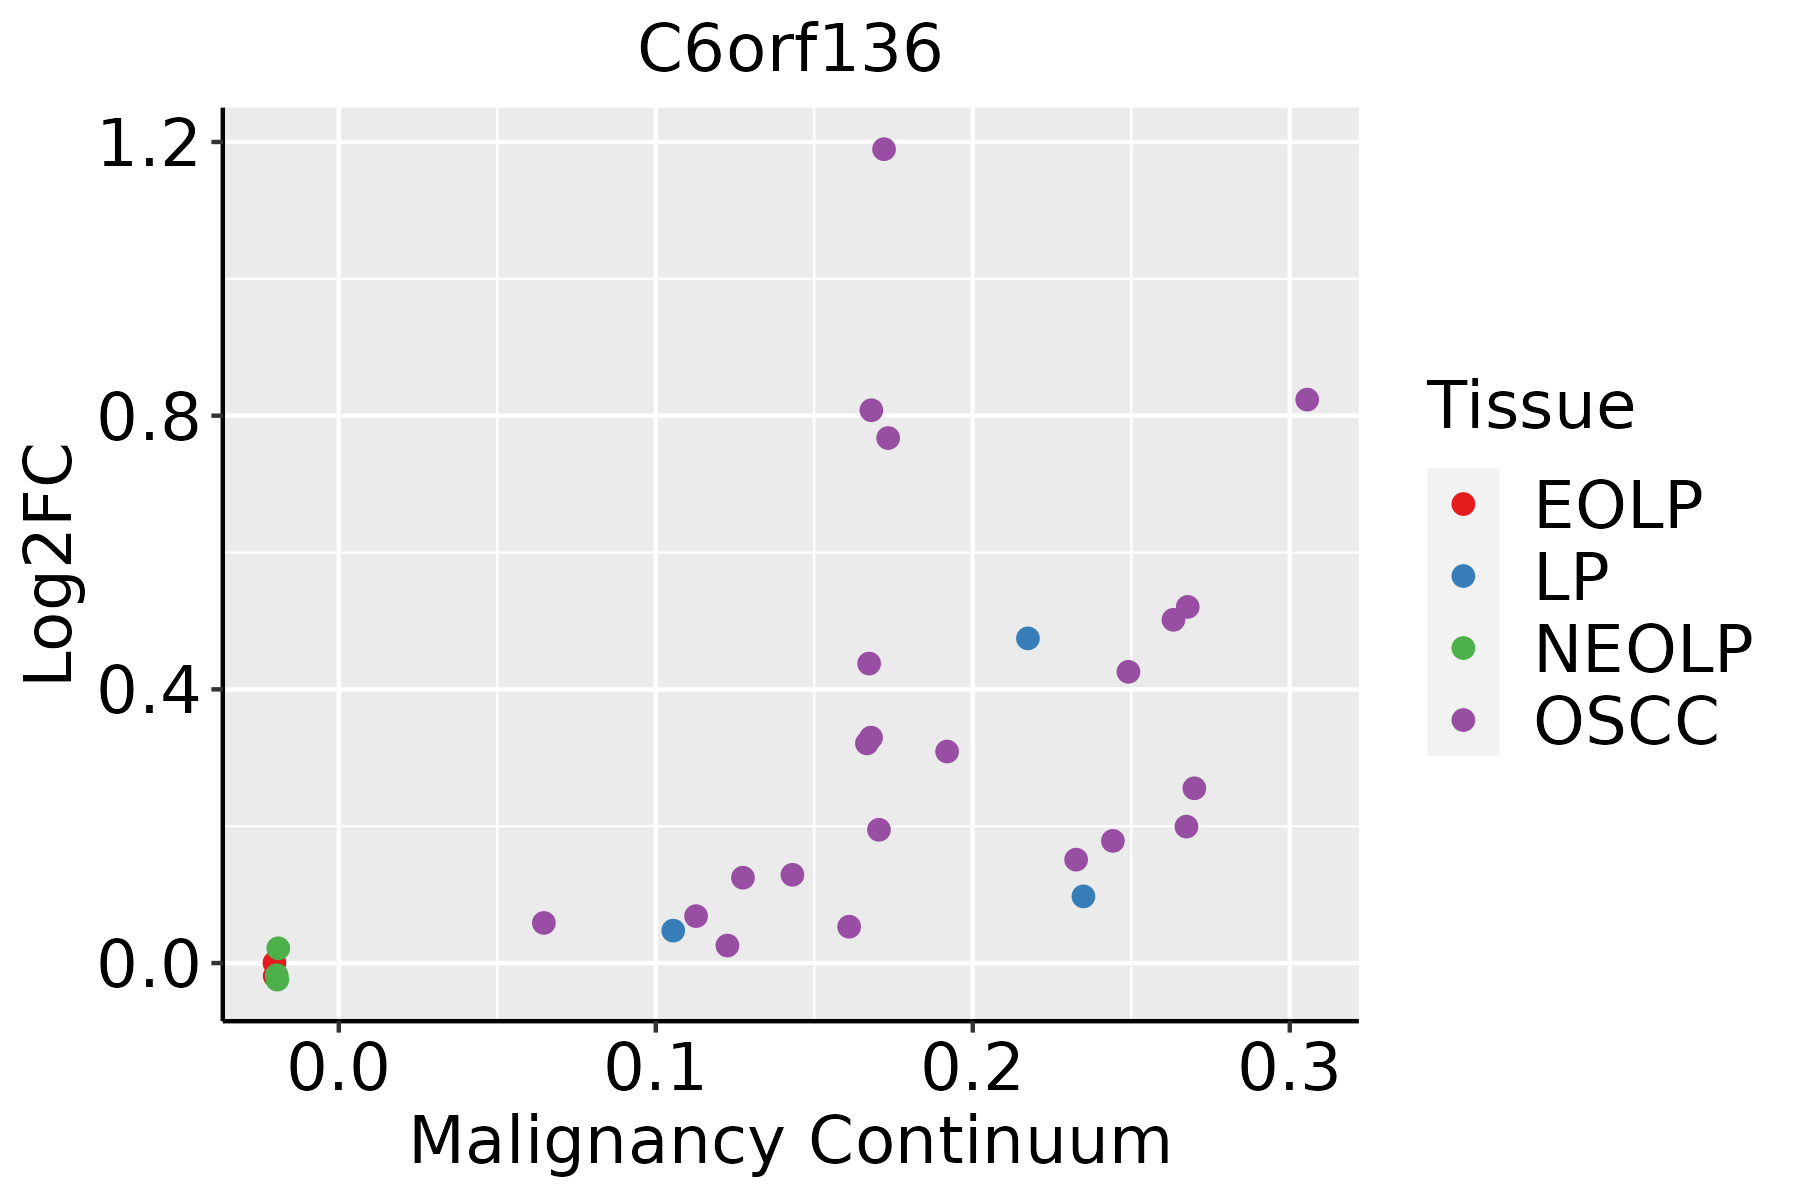 | EOLP: Erosive Oral lichen planus |
| LP: leukoplakia | ||
| NEOLP: Non-erosive oral lichen planus | ||
| OSCC: Oral squamous cell carcinoma |
| ∗log2FC in expression of this searched gene in stem-like cells from each diseased tissue sample relative to stem-like cells in normal samples in each tissue plotted against the malignancy continuum. Samples are colored based on if they are from different disease stage. |
Top |
Malignant transformation related pathway analysis |
| Find out the enriched GO biological processes and KEGG pathways involved in transition from healthy to precancer to cancer |
| Tissue | Disease Stage | Enriched GO biological Processes |
| Colorectum | AD |  |
| Colorectum | SER |  |
| Colorectum | MSS |  |
| Colorectum | MSI-H |  |
| Colorectum | FAP |  |
| ∗Top 15 enriched GO BP terms are showed in the bar plot of each disease state in each tissue. Each row represents a significant GO biological process which is colored according to the -log10(p.adjust). |
| Page: 1 2 3 4 5 6 7 8 9 |
| GO ID | Tissue | Disease Stage | Description | Gene Ratio | Bg Ratio | pvalue | p.adjust | Count |
| Page: 1 |
| Pathway ID | Tissue | Disease Stage | Description | Gene Ratio | Bg Ratio | pvalue | p.adjust | qvalue | Count |
| Page: 1 |
Top |
Cell-cell communication analysis |
| Identification of potential cell-cell interactions between two cell types and their ligand-receptor pairs for different disease states |
| Ligand | Receptor | LRpair | Pathway | Tissue | Disease Stage |
| Page: 1 |
Top |
Single-cell gene regulatory network inference analysis |
| Find out the significant the regulons (TFs) and the target genes of each regulon across cell types for different disease states |
| TF | Cell Type | Tissue | Disease Stage | Target Gene | RSS | Regulon Activity |
| ∗The dot plots of a searched regulon are shown for all cell subpopulations in each disease state of each tissue based on the regulon specific score inferred using pySCENIC and by calculating the average expression. |
| Page: 1 |
Top |
Somatic mutation of malignant transformation related genes |
| Annotation of somatic variants for genes involved in malignant transformation |
| Hugo Symbol | Variant Class | Variant Classification | dbSNP RS | HGVSc | HGVSp | HGVSp Short | SWISSPROT | BIOTYPE | SIFT | PolyPhen | Tumor Sample Barcode | Tissue | Histology | Sex | Age | Stage | Therapy Types | Drugs | Outcome |
| C6orf136 | insertion | Frame_Shift_Ins | novel | c.1218_1219insCGTTTTGTTTACATTCATT | p.Thr407ArgfsTer30 | p.T407Rfs*30 | Q5SQH8 | protein_coding | TCGA-AO-A0J5-01 | Breast | breast invasive carcinoma | Female | <65 | III/IV | Other, specify in notesBisphosphonate | zoledronic | PD | ||
| C6orf136 | deletion | Frame_Shift_Del | novel | c.1055_1056delNN | p.Tyr353PhefsTer9 | p.Y353Ffs*9 | Q5SQH8 | protein_coding | TCGA-E2-A9RU-01 | Breast | breast invasive carcinoma | Female | >=65 | III/IV | Hormone Therapy | arimidex | SD | ||
| C6orf136 | SNV | Missense_Mutation | novel | c.328G>T | p.Gly110Trp | p.G110W | Q5SQH8 | protein_coding | deleterious_low_confidence(0) | benign(0.011) | TCGA-EK-A2PM-01 | Cervix | cervical & endocervical cancer | Female | >=65 | I/II | Unknown | Unknown | SD |
| C6orf136 | SNV | Missense_Mutation | c.1086G>C | p.Glu362Asp | p.E362D | Q5SQH8 | protein_coding | tolerated(0.09) | benign(0.014) | TCGA-Q1-A73O-01 | Cervix | cervical & endocervical cancer | Female | <65 | I/II | Chemotherapy | cisplatin | CR | |
| C6orf136 | SNV | Missense_Mutation | novel | c.757N>A | p.Pro253Thr | p.P253T | Q5SQH8 | protein_coding | deleterious_low_confidence(0.04) | probably_damaging(0.986) | TCGA-AA-3947-01 | Colorectum | colon adenocarcinoma | Female | <65 | I/II | Unknown | Unknown | SD |
| C6orf136 | SNV | Missense_Mutation | rs376377195 | c.1100N>A | p.Arg367His | p.R367H | Q5SQH8 | protein_coding | tolerated(0.07) | benign(0.097) | TCGA-AA-3966-01 | Colorectum | colon adenocarcinoma | Female | >=65 | I/II | Unknown | Unknown | SD |
| C6orf136 | SNV | Missense_Mutation | rs757707277 | c.1238N>A | p.Arg413Gln | p.R413Q | Q5SQH8 | protein_coding | deleterious(0) | possibly_damaging(0.745) | TCGA-AY-6197-01 | Colorectum | colon adenocarcinoma | Male | <65 | I/II | Unknown | Unknown | SD |
| C6orf136 | SNV | Missense_Mutation | novel | c.402N>T | p.Glu134Asp | p.E134D | Q5SQH8 | protein_coding | deleterious_low_confidence(0.04) | benign(0.217) | TCGA-CA-6717-01 | Colorectum | colon adenocarcinoma | Male | <65 | I/II | Chemotherapy | oxaliplatin | CR |
| C6orf136 | SNV | Missense_Mutation | rs773937348 | c.1367N>A | p.Arg456His | p.R456H | Q5SQH8 | protein_coding | tolerated(0.3) | benign(0.033) | TCGA-G4-6588-01 | Colorectum | colon adenocarcinoma | Female | <65 | I/II | Unknown | Unknown | SD |
| C6orf136 | SNV | Missense_Mutation | rs771615967 | c.1045N>A | p.Asp349Asn | p.D349N | Q5SQH8 | protein_coding | tolerated(0.1) | probably_damaging(0.986) | TCGA-AG-3892-01 | Colorectum | rectum adenocarcinoma | Female | <65 | I/II | Unknown | Unknown | SD |
| Page: 1 2 3 |
Top |
Related drugs of malignant transformation related genes |
| Identification of chemicals and drugs interact with genes involved in malignant transfromation |
| (DGIdb 4.0) |
| Entrez ID | Symbol | Category | Interaction Types | Drug Claim Name | Drug Name | PMIDs |
| Page: 1 |

Copyright 2023-Present -The University of Texas Health Science Center at Houston |