
|
|||||
|
 | |
| |
| |
| |
| |
| |
|
Gene: C6orf132 |
Gene summary for C6ORF132 |
| Gene information | Species | Human | Gene symbol | C6orf132 | Gene ID | 647024 |
| Gene name | chromosome 6 open reading frame 132 | |
| Gene Alias | bA7K24.2 | |
| Cytomap | 6p21.1 | |
| Gene Type | protein-coding | GO ID | NA | UniProtAcc | Q5T0Z8 |
Top |
Malignant transformation analysis |
| Identification of the aberrant gene expression in precancerous and cancerous lesions by comparing the gene expression of stem-like cells in diseased tissues with normal stem cells |
| Entrez ID | Symbol | Replicates | Species | Organ | Tissue | Adj P-value | Log2FC | Malignancy |
| 647024 | C6orf132 | CA_HPV_1 | Human | Cervix | CC | 1.88e-05 | -1.57e-01 | 0.0264 |
| 647024 | C6orf132 | CCI_1 | Human | Cervix | CC | 2.20e-03 | 5.61e-01 | 0.528 |
| 647024 | C6orf132 | CCI_2 | Human | Cervix | CC | 4.39e-05 | 6.31e-01 | 0.5249 |
| 647024 | C6orf132 | sample3 | Human | Cervix | CC | 5.17e-04 | 1.98e-01 | 0.1387 |
| 647024 | C6orf132 | H2 | Human | Cervix | HSIL_HPV | 8.24e-14 | 5.33e-01 | 0.0632 |
| 647024 | C6orf132 | HTA11_2487_2000001011 | Human | Colorectum | SER | 3.87e-11 | 5.76e-01 | -0.1808 |
| 647024 | C6orf132 | HTA11_1938_2000001011 | Human | Colorectum | AD | 2.45e-08 | 5.09e-01 | -0.0811 |
| 647024 | C6orf132 | HTA11_347_2000001011 | Human | Colorectum | AD | 4.90e-11 | 4.90e-01 | -0.1954 |
| 647024 | C6orf132 | HTA11_411_2000001011 | Human | Colorectum | SER | 2.45e-07 | 1.07e+00 | -0.2602 |
| 647024 | C6orf132 | HTA11_2112_2000001011 | Human | Colorectum | SER | 8.69e-06 | 7.93e-01 | -0.2196 |
| 647024 | C6orf132 | HTA11_696_2000001011 | Human | Colorectum | AD | 2.05e-15 | 5.98e-01 | -0.1464 |
| 647024 | C6orf132 | HTA11_866_2000001011 | Human | Colorectum | AD | 1.94e-15 | 5.14e-01 | -0.1001 |
| 647024 | C6orf132 | HTA11_1391_2000001011 | Human | Colorectum | AD | 9.42e-17 | 7.86e-01 | -0.059 |
| 647024 | C6orf132 | HTA11_2992_2000001011 | Human | Colorectum | SER | 4.71e-03 | 6.89e-01 | -0.1706 |
| 647024 | C6orf132 | HTA11_5212_2000001011 | Human | Colorectum | AD | 2.41e-02 | 4.78e-01 | -0.2061 |
| 647024 | C6orf132 | HTA11_546_2000001011 | Human | Colorectum | AD | 3.65e-02 | 4.08e-01 | -0.0842 |
| 647024 | C6orf132 | HTA11_866_3004761011 | Human | Colorectum | AD | 1.78e-09 | 4.34e-01 | 0.096 |
| 647024 | C6orf132 | HTA11_8622_2000001021 | Human | Colorectum | SER | 1.06e-03 | 4.50e-01 | 0.0528 |
| 647024 | C6orf132 | HTA11_10711_2000001011 | Human | Colorectum | AD | 2.82e-02 | 3.68e-01 | 0.0338 |
| 647024 | C6orf132 | HTA11_7696_3000711011 | Human | Colorectum | AD | 5.88e-13 | 5.53e-01 | 0.0674 |
| Page: 1 2 3 4 5 6 7 |
| Tissue | Expression Dynamics | Abbreviation |
| Cervix |  | CC: Cervix cancer |
| HSIL_HPV: HPV-infected high-grade squamous intraepithelial lesions | ||
| N_HPV: HPV-infected normal cervix | ||
| Colorectum (GSE201348) |  | FAP: Familial adenomatous polyposis |
| CRC: Colorectal cancer | ||
| Colorectum (HTA11) |  | AD: Adenomas |
| SER: Sessile serrated lesions | ||
| MSI-H: Microsatellite-high colorectal cancer | ||
| MSS: Microsatellite stable colorectal cancer | ||
| Esophagus | 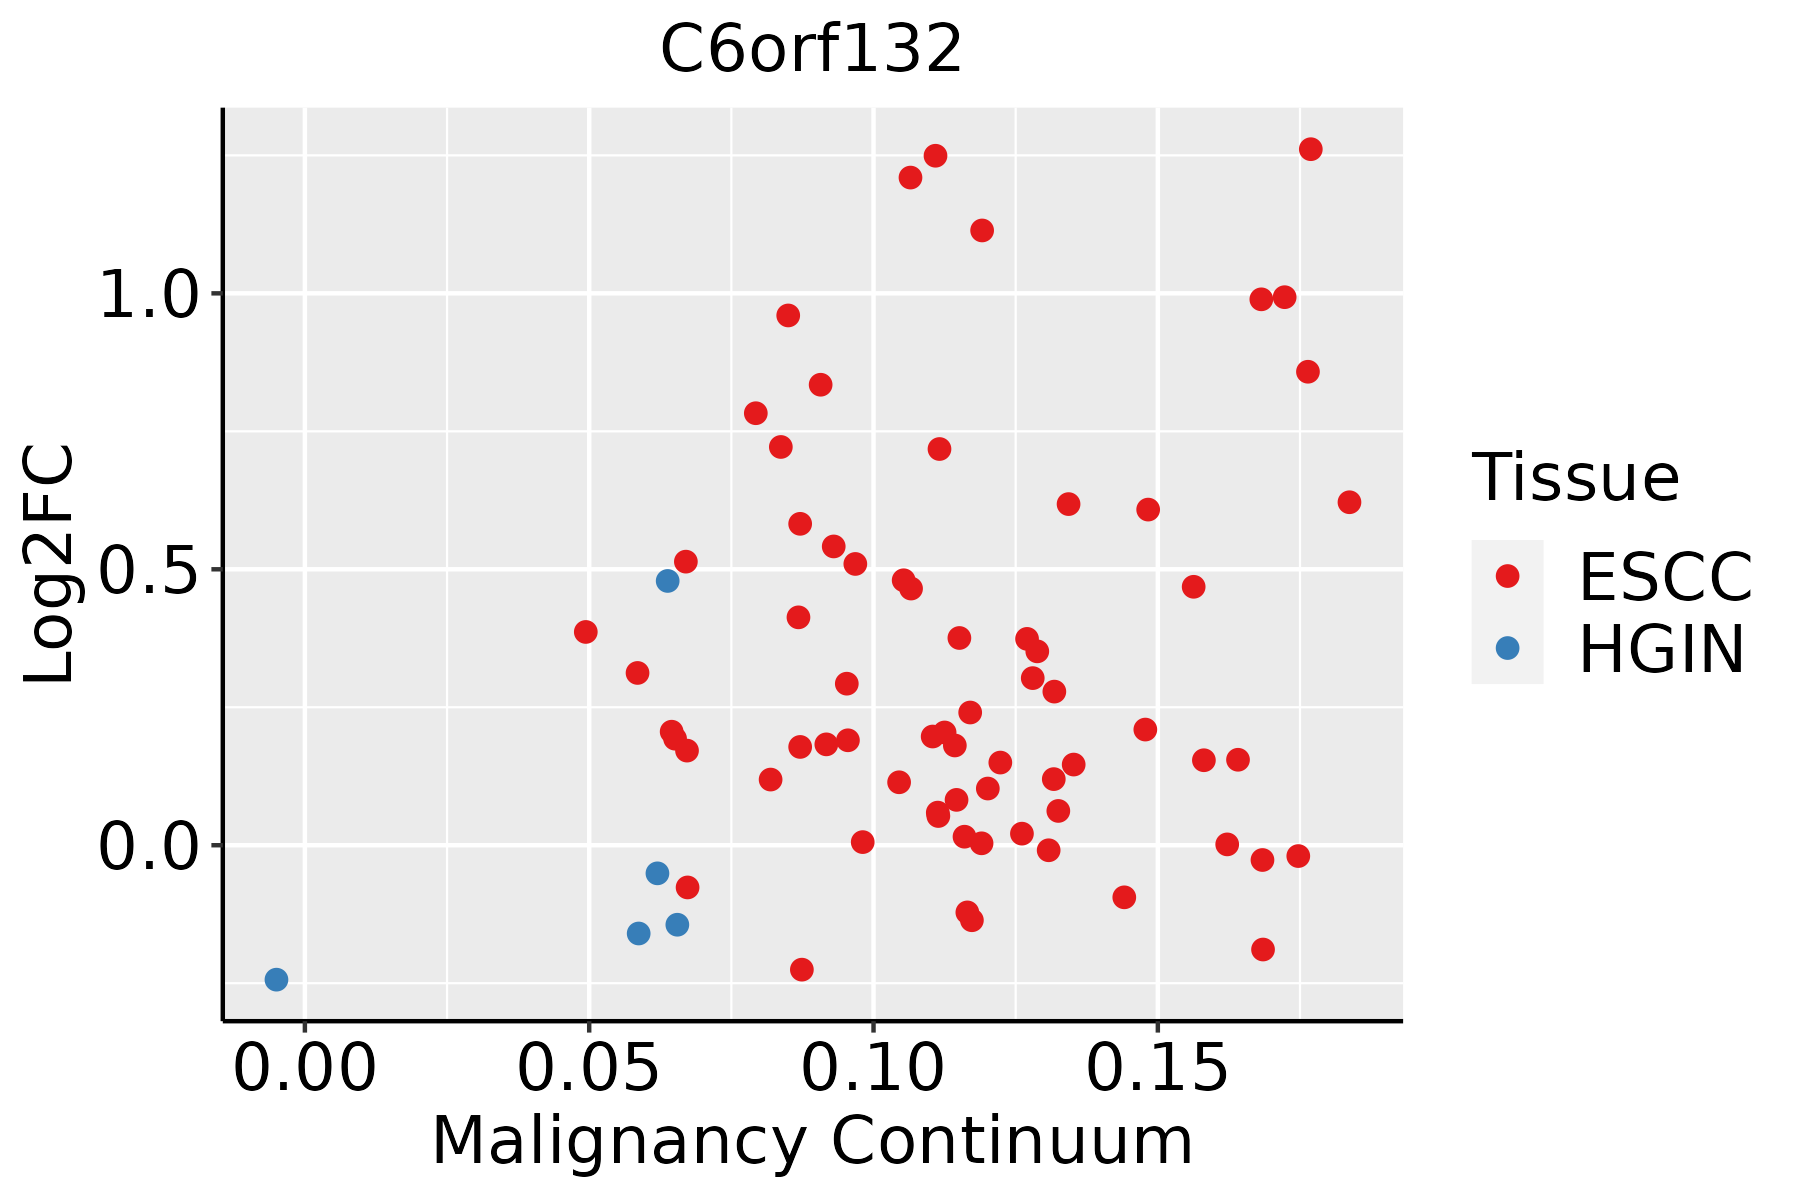 | ESCC: Esophageal squamous cell carcinoma |
| HGIN: High-grade intraepithelial neoplasias | ||
| LGIN: Low-grade intraepithelial neoplasias | ||
| Liver | 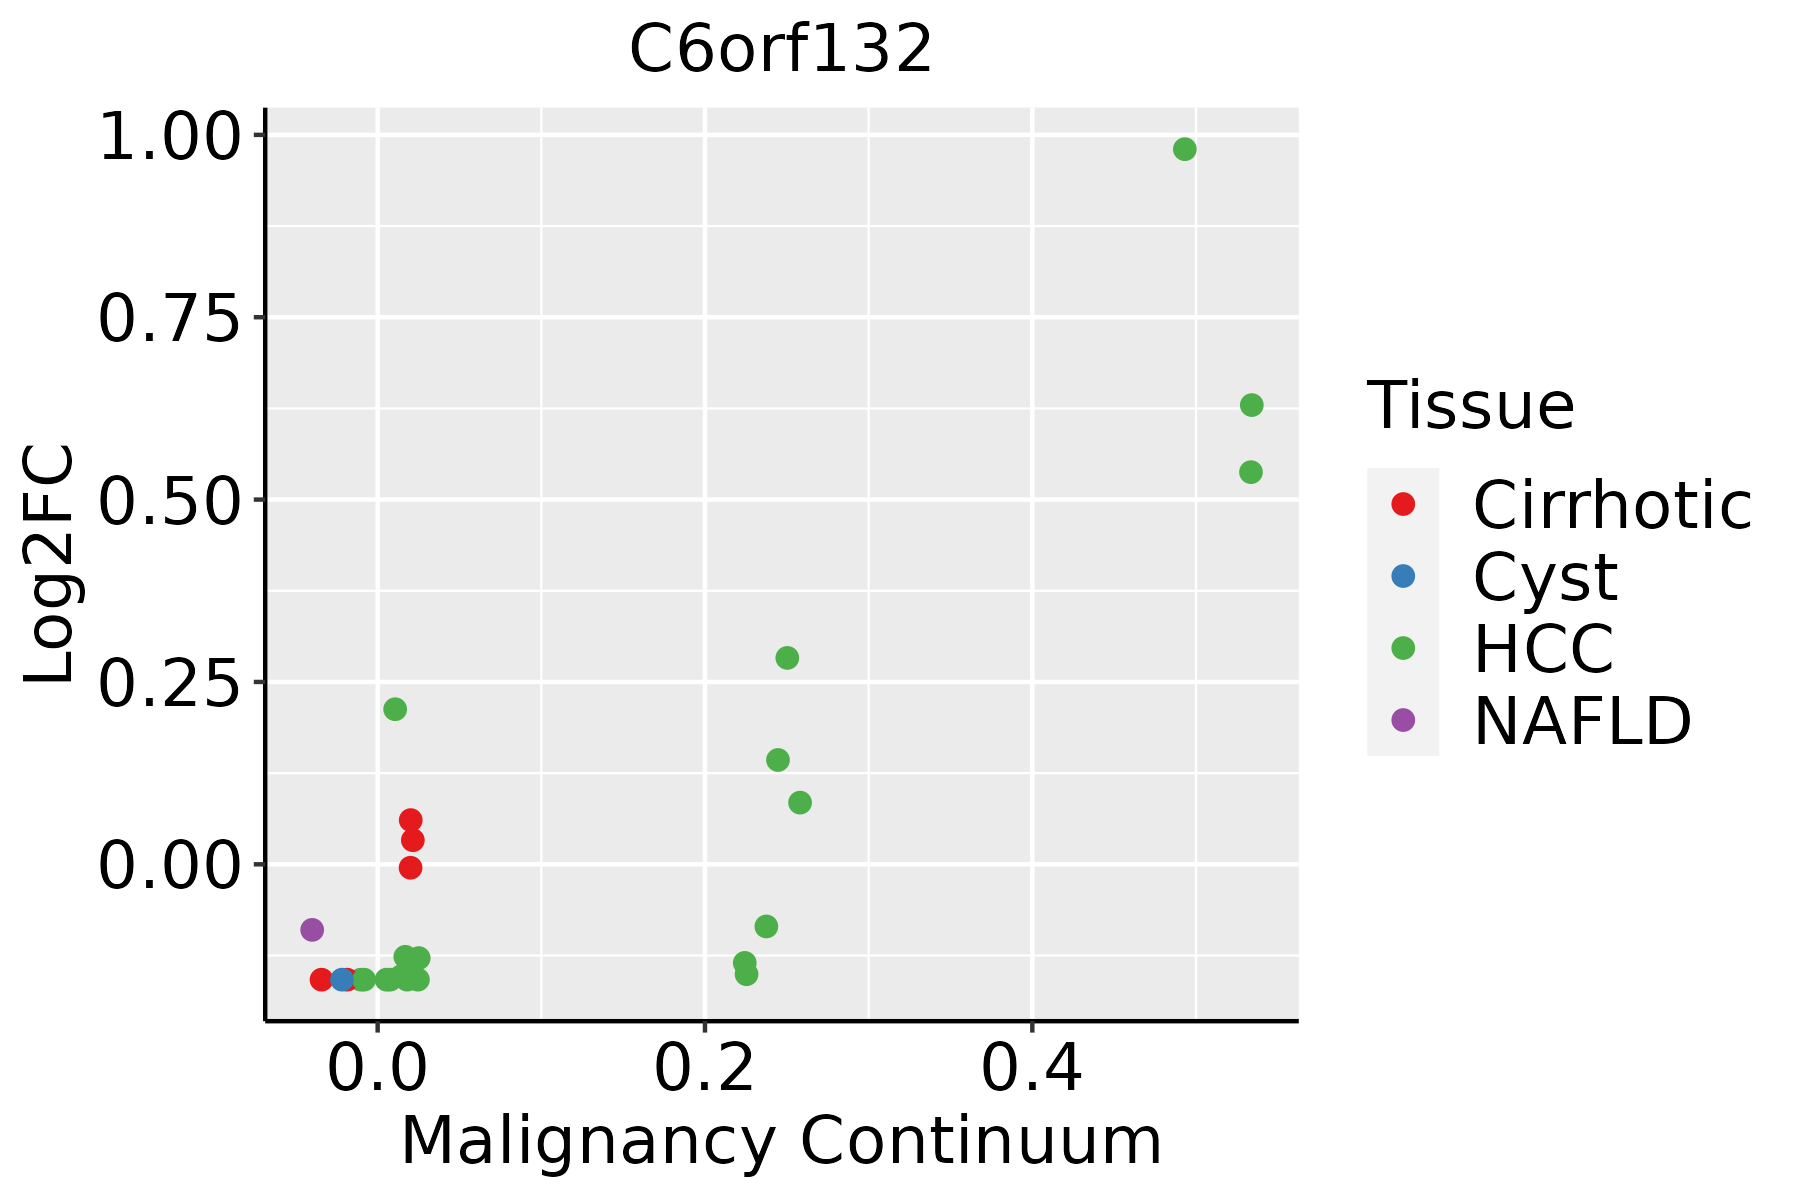 | HCC: Hepatocellular carcinoma |
| NAFLD: Non-alcoholic fatty liver disease | ||
| Oral Cavity | 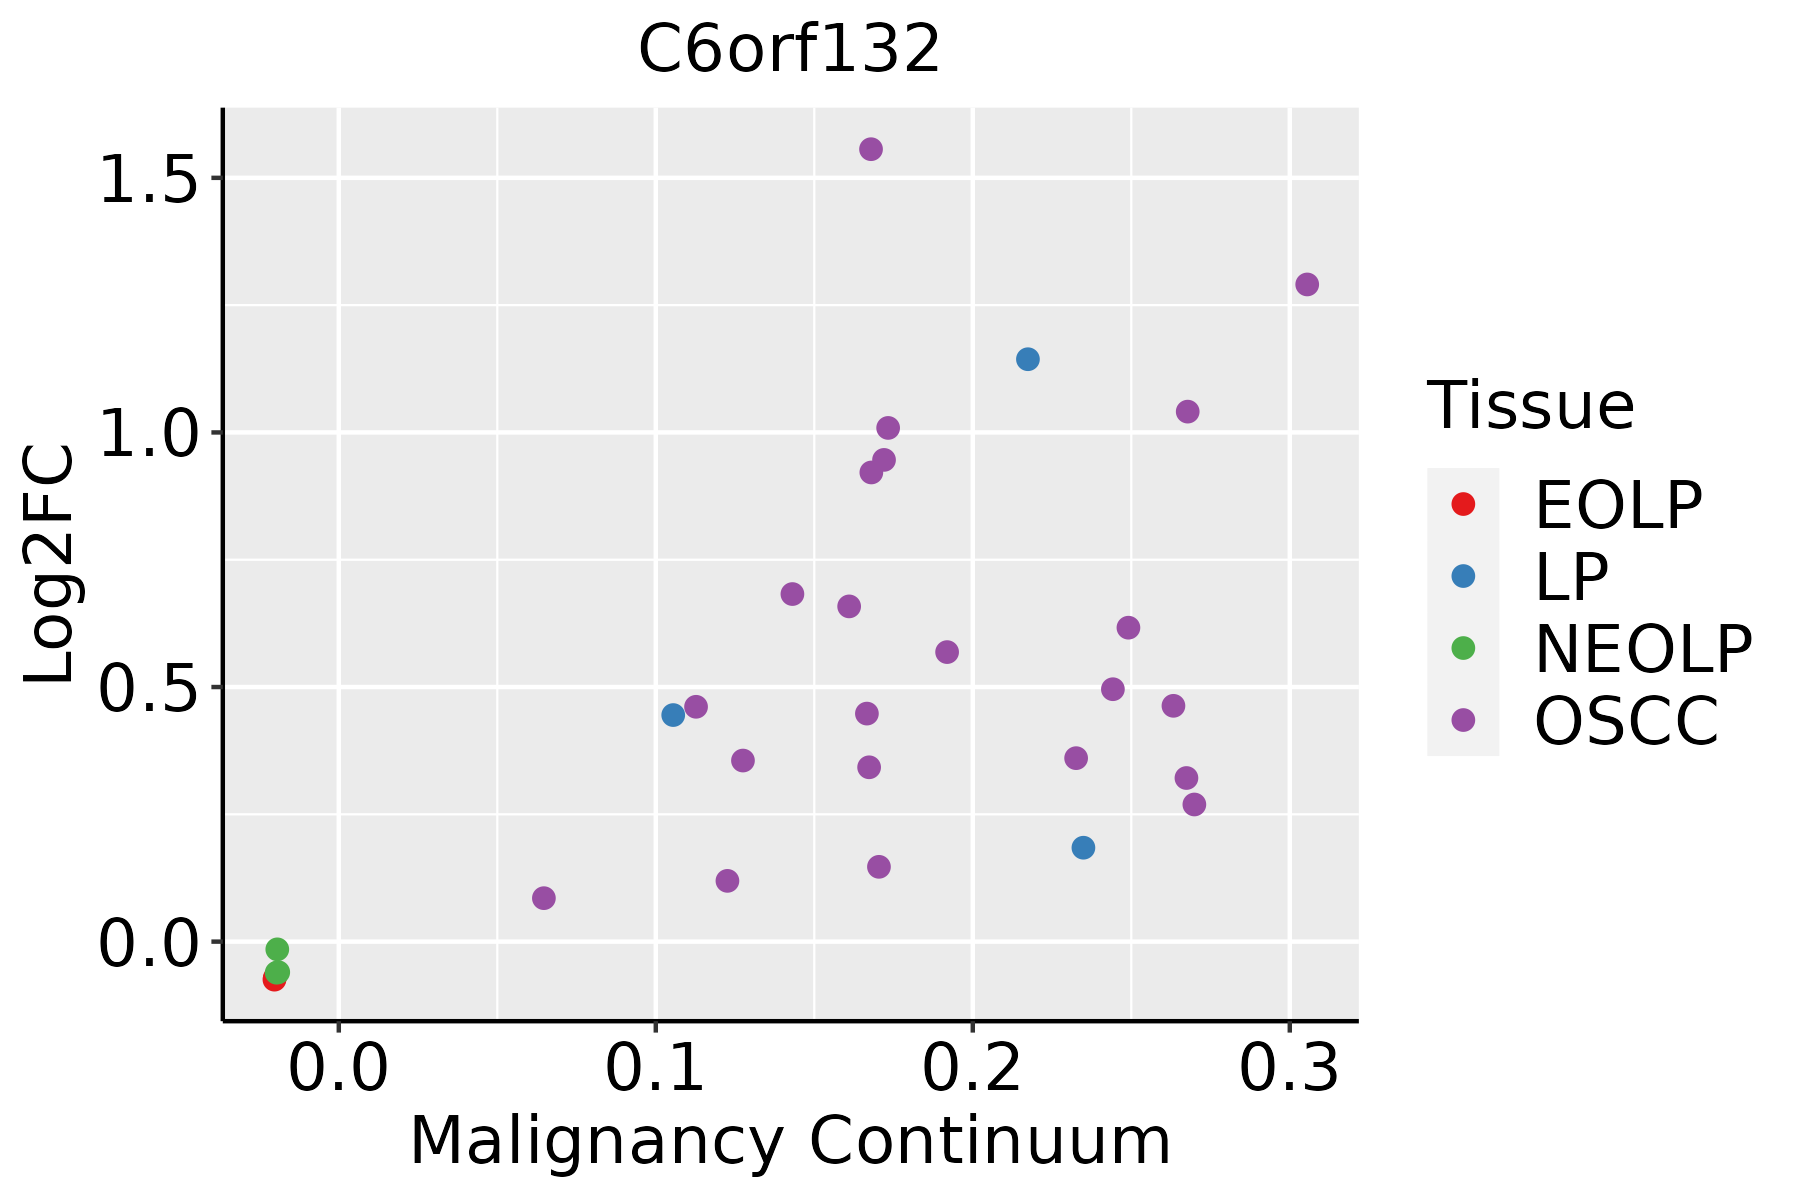 | EOLP: Erosive Oral lichen planus |
| LP: leukoplakia | ||
| NEOLP: Non-erosive oral lichen planus | ||
| OSCC: Oral squamous cell carcinoma | ||
| Skin |  | AK: Actinic keratosis |
| cSCC: Cutaneous squamous cell carcinoma | ||
| SCCIS:squamous cell carcinoma in situ | ||
| Thyroid | 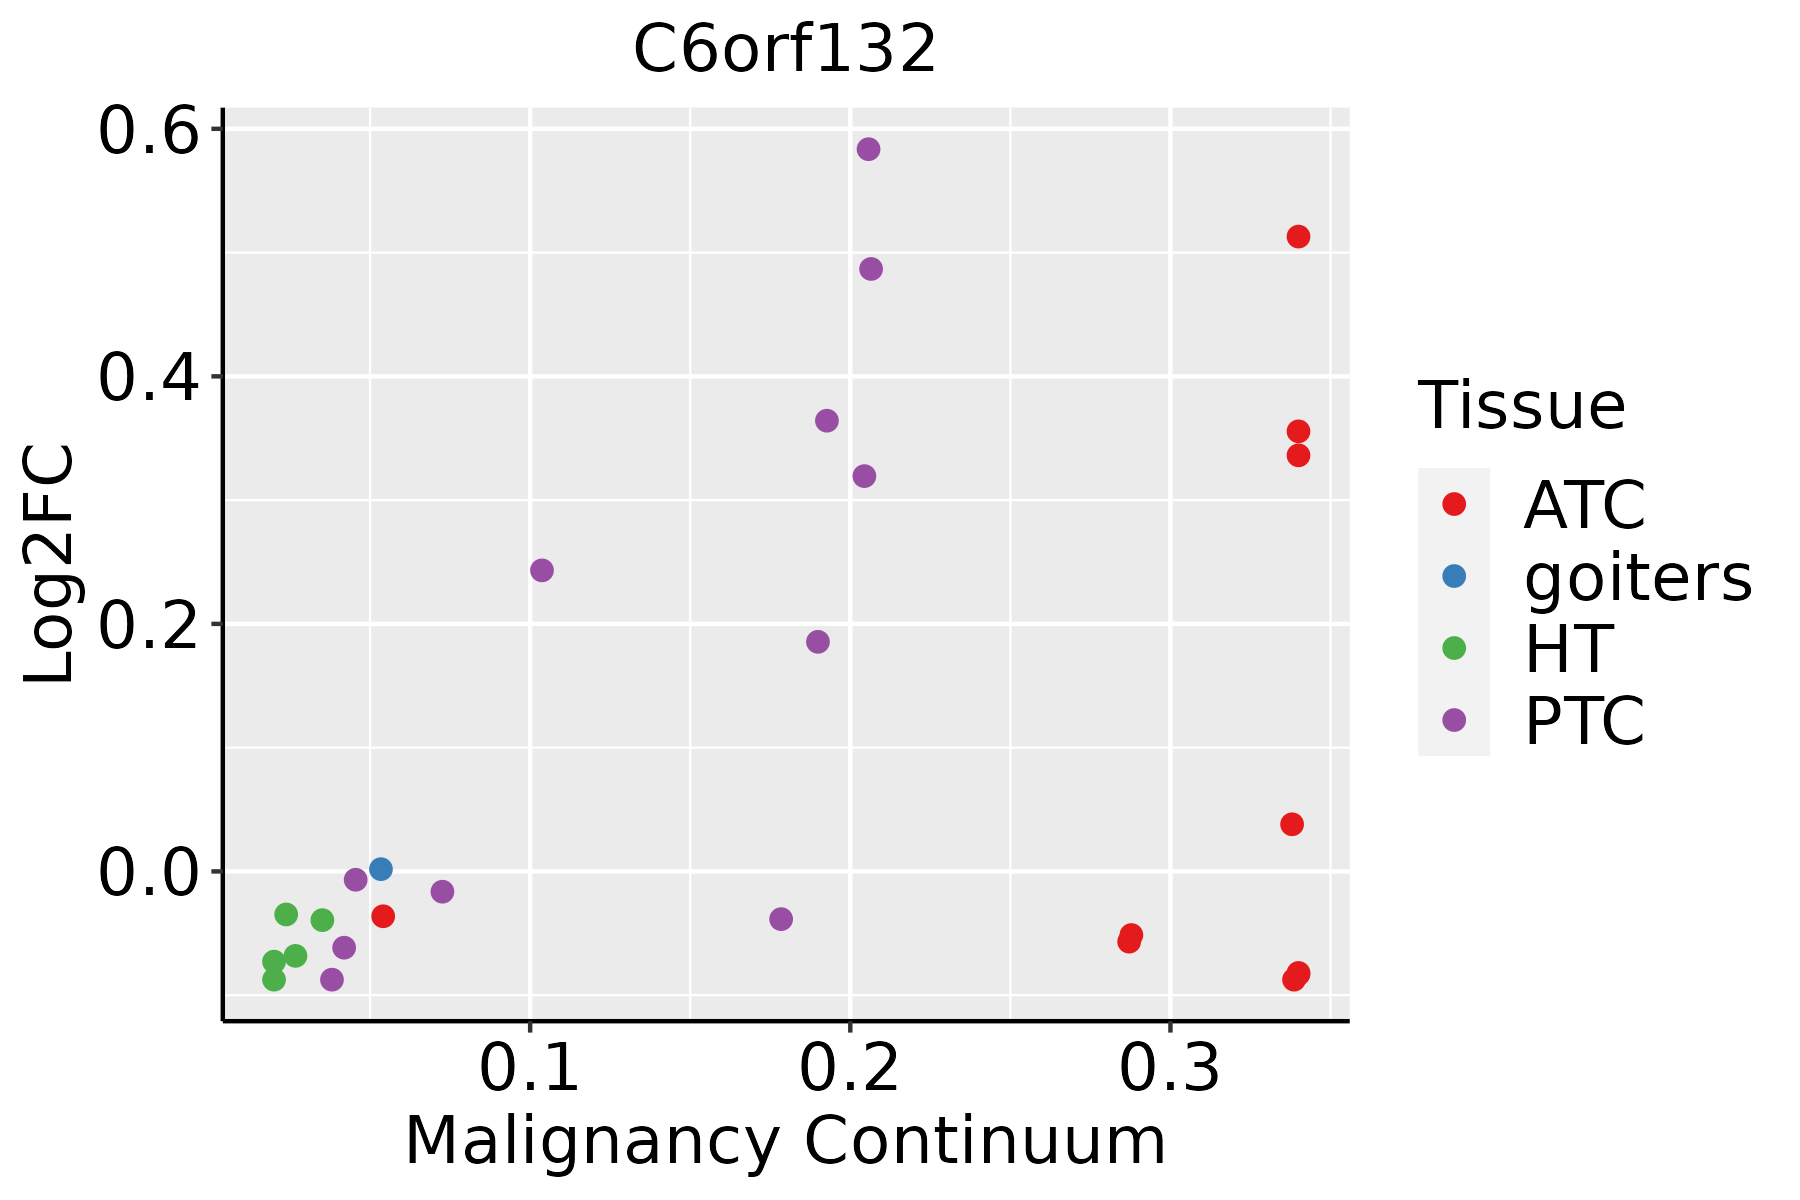 | ATC: Anaplastic thyroid cancer |
| HT: Hashimoto's thyroiditis | ||
| PTC: Papillary thyroid cancer |
| ∗log2FC in expression of this searched gene in stem-like cells from each diseased tissue sample relative to stem-like cells in normal samples in each tissue plotted against the malignancy continuum. Samples are colored based on if they are from different disease stage. |
Top |
Malignant transformation related pathway analysis |
| Find out the enriched GO biological processes and KEGG pathways involved in transition from healthy to precancer to cancer |
| Tissue | Disease Stage | Enriched GO biological Processes |
| Colorectum | AD |  |
| Colorectum | SER |  |
| Colorectum | MSS |  |
| Colorectum | MSI-H |  |
| Colorectum | FAP |  |
| ∗Top 15 enriched GO BP terms are showed in the bar plot of each disease state in each tissue. Each row represents a significant GO biological process which is colored according to the -log10(p.adjust). |
| Page: 1 2 3 4 5 6 7 8 9 |
| GO ID | Tissue | Disease Stage | Description | Gene Ratio | Bg Ratio | pvalue | p.adjust | Count |
| Page: 1 |
| Pathway ID | Tissue | Disease Stage | Description | Gene Ratio | Bg Ratio | pvalue | p.adjust | qvalue | Count |
| Page: 1 |
Top |
Cell-cell communication analysis |
| Identification of potential cell-cell interactions between two cell types and their ligand-receptor pairs for different disease states |
| Ligand | Receptor | LRpair | Pathway | Tissue | Disease Stage |
| Page: 1 |
Top |
Single-cell gene regulatory network inference analysis |
| Find out the significant the regulons (TFs) and the target genes of each regulon across cell types for different disease states |
| TF | Cell Type | Tissue | Disease Stage | Target Gene | RSS | Regulon Activity |
| ∗The dot plots of a searched regulon are shown for all cell subpopulations in each disease state of each tissue based on the regulon specific score inferred using pySCENIC and by calculating the average expression. |
| Page: 1 |
Top |
Somatic mutation of malignant transformation related genes |
| Annotation of somatic variants for genes involved in malignant transformation |
| Hugo Symbol | Variant Class | Variant Classification | dbSNP RS | HGVSc | HGVSp | HGVSp Short | SWISSPROT | BIOTYPE | SIFT | PolyPhen | Tumor Sample Barcode | Tissue | Histology | Sex | Age | Stage | Therapy Types | Drugs | Outcome |
| C6orf132 | SNV | Missense_Mutation | c.2605N>T | p.Arg869Cys | p.R869C | Q5T0Z8 | protein_coding | deleterious(0) | possibly_damaging(0.855) | TCGA-A1-A0SI-01 | Breast | breast invasive carcinoma | Female | <65 | I/II | Unknown | Unknown | SD | |
| C6orf132 | SNV | Missense_Mutation | c.854N>C | p.Gly285Ala | p.G285A | Q5T0Z8 | protein_coding | tolerated_low_confidence(0.08) | benign(0.337) | TCGA-AR-A1AH-01 | Breast | breast invasive carcinoma | Female | <65 | I/II | Unspecific | PD | ||
| C6orf132 | SNV | Missense_Mutation | rs374673003 | c.169C>T | p.Arg57Trp | p.R57W | Q5T0Z8 | protein_coding | deleterious(0) | unknown(0) | TCGA-BH-A18J-01 | Breast | breast invasive carcinoma | Female | <65 | III/IV | Unknown | Unknown | PD |
| C6orf132 | insertion | Frame_Shift_Ins | novel | c.1994_1995insGAAAT | p.Thr666LysfsTer28 | p.T666Kfs*28 | Q5T0Z8 | protein_coding | TCGA-A8-A07R-01 | Breast | breast invasive carcinoma | Female | >=65 | III/IV | Ancillary | zoledronic | SD | ||
| C6orf132 | insertion | Frame_Shift_Ins | novel | c.1993_1994insAGGCTGAGAAGGACTCCCCGCTGACGAC | p.Ala665GlufsTer87 | p.A665Efs*87 | Q5T0Z8 | protein_coding | TCGA-A8-A07R-01 | Breast | breast invasive carcinoma | Female | >=65 | III/IV | Ancillary | zoledronic | SD | ||
| C6orf132 | SNV | Missense_Mutation | novel | c.914C>A | p.Pro305His | p.P305H | Q5T0Z8 | protein_coding | deleterious_low_confidence(0) | probably_damaging(0.98) | TCGA-EA-A410-01 | Cervix | cervical & endocervical cancer | Female | <65 | I/II | Unknown | Unknown | SD |
| C6orf132 | SNV | Missense_Mutation | c.1003N>T | p.Pro335Ser | p.P335S | Q5T0Z8 | protein_coding | tolerated_low_confidence(0.21) | benign(0.003) | TCGA-JW-A5VL-01 | Cervix | cervical & endocervical cancer | Female | <65 | I/II | Unknown | Unknown | SD | |
| C6orf132 | SNV | Missense_Mutation | novel | c.1804N>A | p.Glu602Lys | p.E602K | Q5T0Z8 | protein_coding | deleterious_low_confidence(0.01) | probably_damaging(0.911) | TCGA-VS-A959-01 | Cervix | cervical & endocervical cancer | Female | >=65 | I/II | Unknown | Unknown | SD |
| C6orf132 | SNV | Missense_Mutation | novel | c.751N>T | p.Pro251Ser | p.P251S | Q5T0Z8 | protein_coding | deleterious_low_confidence(0.01) | probably_damaging(0.935) | TCGA-ZJ-AAX8-01 | Cervix | cervical & endocervical cancer | Female | <65 | III/IV | Unknown | Unknown | SD |
| C6orf132 | deletion | Frame_Shift_Del | novel | c.1345delN | p.Ser449AlafsTer68 | p.S449Afs*68 | Q5T0Z8 | protein_coding | TCGA-MA-AA42-01 | Cervix | cervical & endocervical cancer | Female | >=65 | I/II | Unknown | Unknown | SD |
| Page: 1 2 3 |
Top |
Related drugs of malignant transformation related genes |
| Identification of chemicals and drugs interact with genes involved in malignant transfromation |
| (DGIdb 4.0) |
| Entrez ID | Symbol | Category | Interaction Types | Drug Claim Name | Drug Name | PMIDs |
| Page: 1 |

Copyright 2023-Present -The University of Texas Health Science Center at Houston |