
|
|||||
|
 | |
| |
| |
| |
| |
| |
|
Gene: C6orf106 |
Gene summary for C6ORF106 |
| Gene information | Species | Human | Gene symbol | C6orf106 | Gene ID | 64771 |
| Gene name | inflammation and lipid regulator with UBA-like and NBR1-like domains | |
| Gene Alias | C6orf106 | |
| Cytomap | 6p21.31 | |
| Gene Type | protein-coding | GO ID | GO:0001816 | UniProtAcc | Q9H6K1 |
Top |
Malignant transformation analysis |
| Identification of the aberrant gene expression in precancerous and cancerous lesions by comparing the gene expression of stem-like cells in diseased tissues with normal stem cells |
| Entrez ID | Symbol | Replicates | Species | Organ | Tissue | Adj P-value | Log2FC | Malignancy |
| 64771 | C6orf106 | HTA11_3410_2000001011 | Human | Colorectum | AD | 3.15e-18 | -5.06e-01 | 0.0155 |
| 64771 | C6orf106 | HTA11_2487_2000001011 | Human | Colorectum | SER | 2.27e-10 | -5.06e-01 | -0.1808 |
| 64771 | C6orf106 | HTA11_1938_2000001011 | Human | Colorectum | AD | 1.33e-07 | -5.06e-01 | -0.0811 |
| 64771 | C6orf106 | HTA11_78_2000001011 | Human | Colorectum | AD | 2.11e-12 | -5.06e-01 | -0.1088 |
| 64771 | C6orf106 | HTA11_347_2000001011 | Human | Colorectum | AD | 1.21e-19 | -5.06e-01 | -0.1954 |
| 64771 | C6orf106 | HTA11_3361_2000001011 | Human | Colorectum | AD | 6.09e-08 | -5.06e-01 | -0.1207 |
| 64771 | C6orf106 | HTA11_83_2000001011 | Human | Colorectum | SER | 4.06e-06 | -5.06e-01 | -0.1526 |
| 64771 | C6orf106 | HTA11_696_2000001011 | Human | Colorectum | AD | 1.58e-25 | -5.06e-01 | -0.1464 |
| 64771 | C6orf106 | HTA11_866_2000001011 | Human | Colorectum | AD | 9.10e-25 | -5.06e-01 | -0.1001 |
| 64771 | C6orf106 | HTA11_1391_2000001011 | Human | Colorectum | AD | 1.39e-14 | -5.06e-01 | -0.059 |
| 64771 | C6orf106 | HTA11_2992_2000001011 | Human | Colorectum | SER | 4.26e-02 | -5.06e-01 | -0.1706 |
| 64771 | C6orf106 | HTA11_5212_2000001011 | Human | Colorectum | AD | 1.05e-02 | -5.06e-01 | -0.2061 |
| 64771 | C6orf106 | HTA11_546_2000001011 | Human | Colorectum | AD | 4.07e-05 | -5.06e-01 | -0.0842 |
| 64771 | C6orf106 | HTA11_7862_2000001011 | Human | Colorectum | AD | 6.88e-04 | -5.06e-01 | -0.0179 |
| 64771 | C6orf106 | HTA11_866_3004761011 | Human | Colorectum | AD | 5.63e-16 | -5.06e-01 | 0.096 |
| 64771 | C6orf106 | HTA11_8622_2000001021 | Human | Colorectum | SER | 5.24e-03 | -5.06e-01 | 0.0528 |
| 64771 | C6orf106 | HTA11_10623_2000001011 | Human | Colorectum | AD | 1.35e-03 | -5.06e-01 | -0.0177 |
| 64771 | C6orf106 | HTA11_10711_2000001011 | Human | Colorectum | AD | 1.39e-09 | -5.06e-01 | 0.0338 |
| 64771 | C6orf106 | HTA11_7696_3000711011 | Human | Colorectum | AD | 9.10e-25 | -5.06e-01 | 0.0674 |
| 64771 | C6orf106 | HTA11_6818_2000001011 | Human | Colorectum | AD | 8.60e-04 | -5.06e-01 | 0.0112 |
| Page: 1 2 3 4 5 6 7 8 9 |
| Tissue | Expression Dynamics | Abbreviation |
| Colorectum (GSE201348) |  | FAP: Familial adenomatous polyposis |
| CRC: Colorectal cancer | ||
| Colorectum (HTA11) | 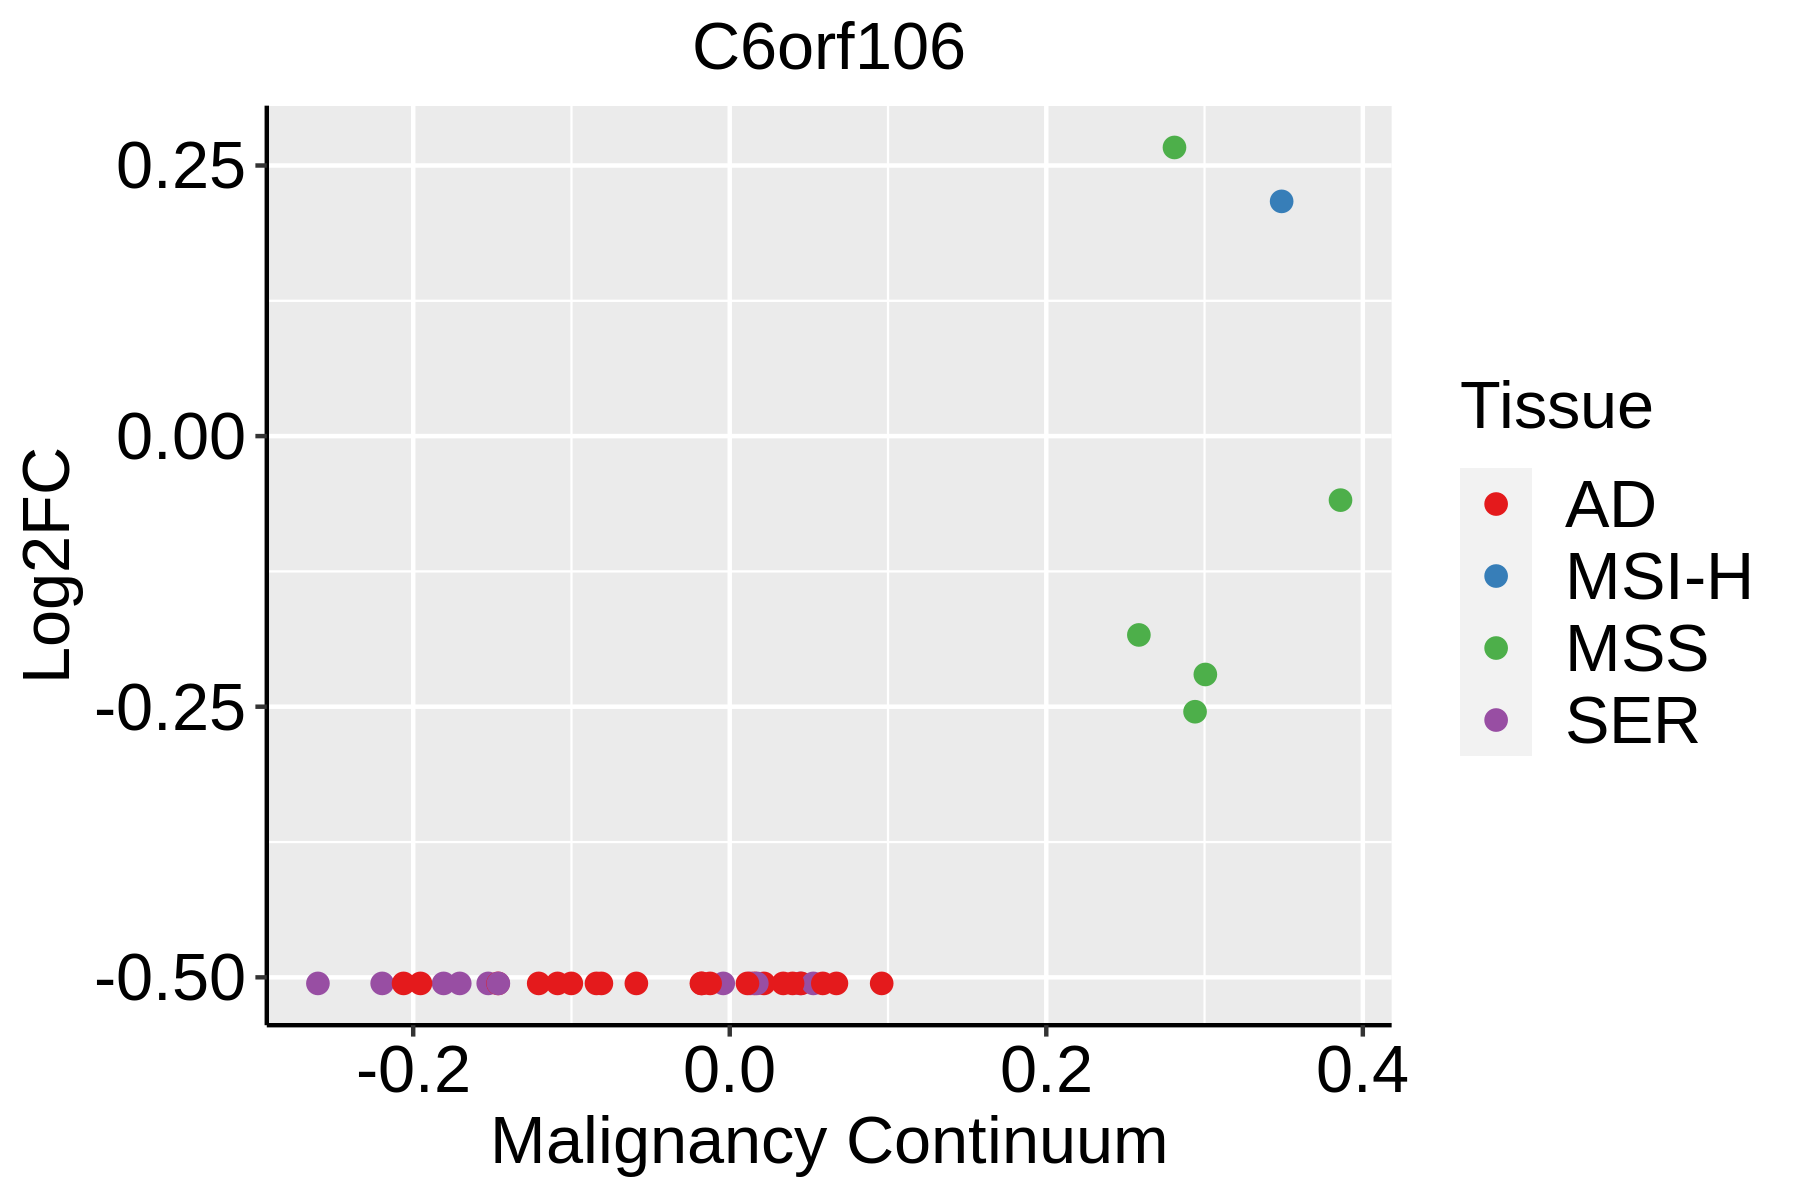 | AD: Adenomas |
| SER: Sessile serrated lesions | ||
| MSI-H: Microsatellite-high colorectal cancer | ||
| MSS: Microsatellite stable colorectal cancer | ||
| Esophagus | 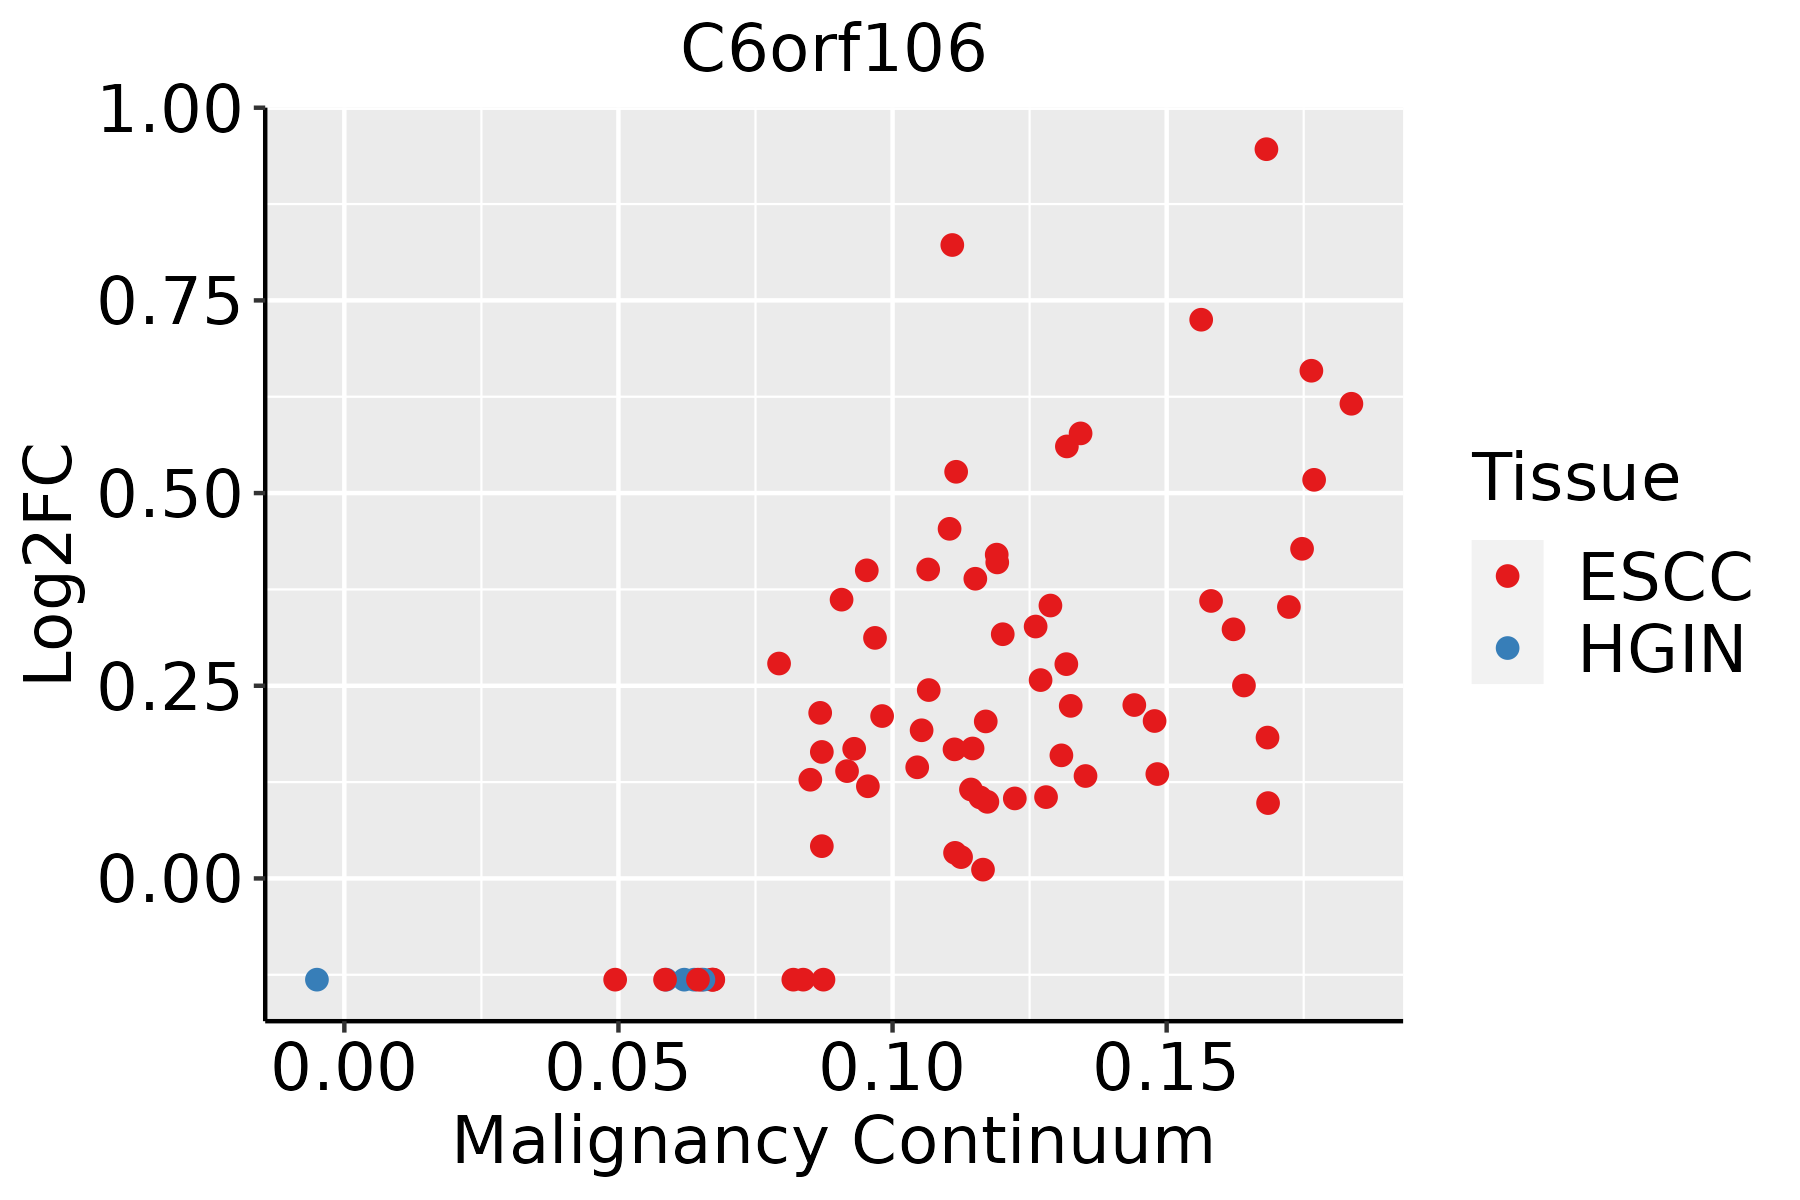 | ESCC: Esophageal squamous cell carcinoma |
| HGIN: High-grade intraepithelial neoplasias | ||
| LGIN: Low-grade intraepithelial neoplasias | ||
| Liver | 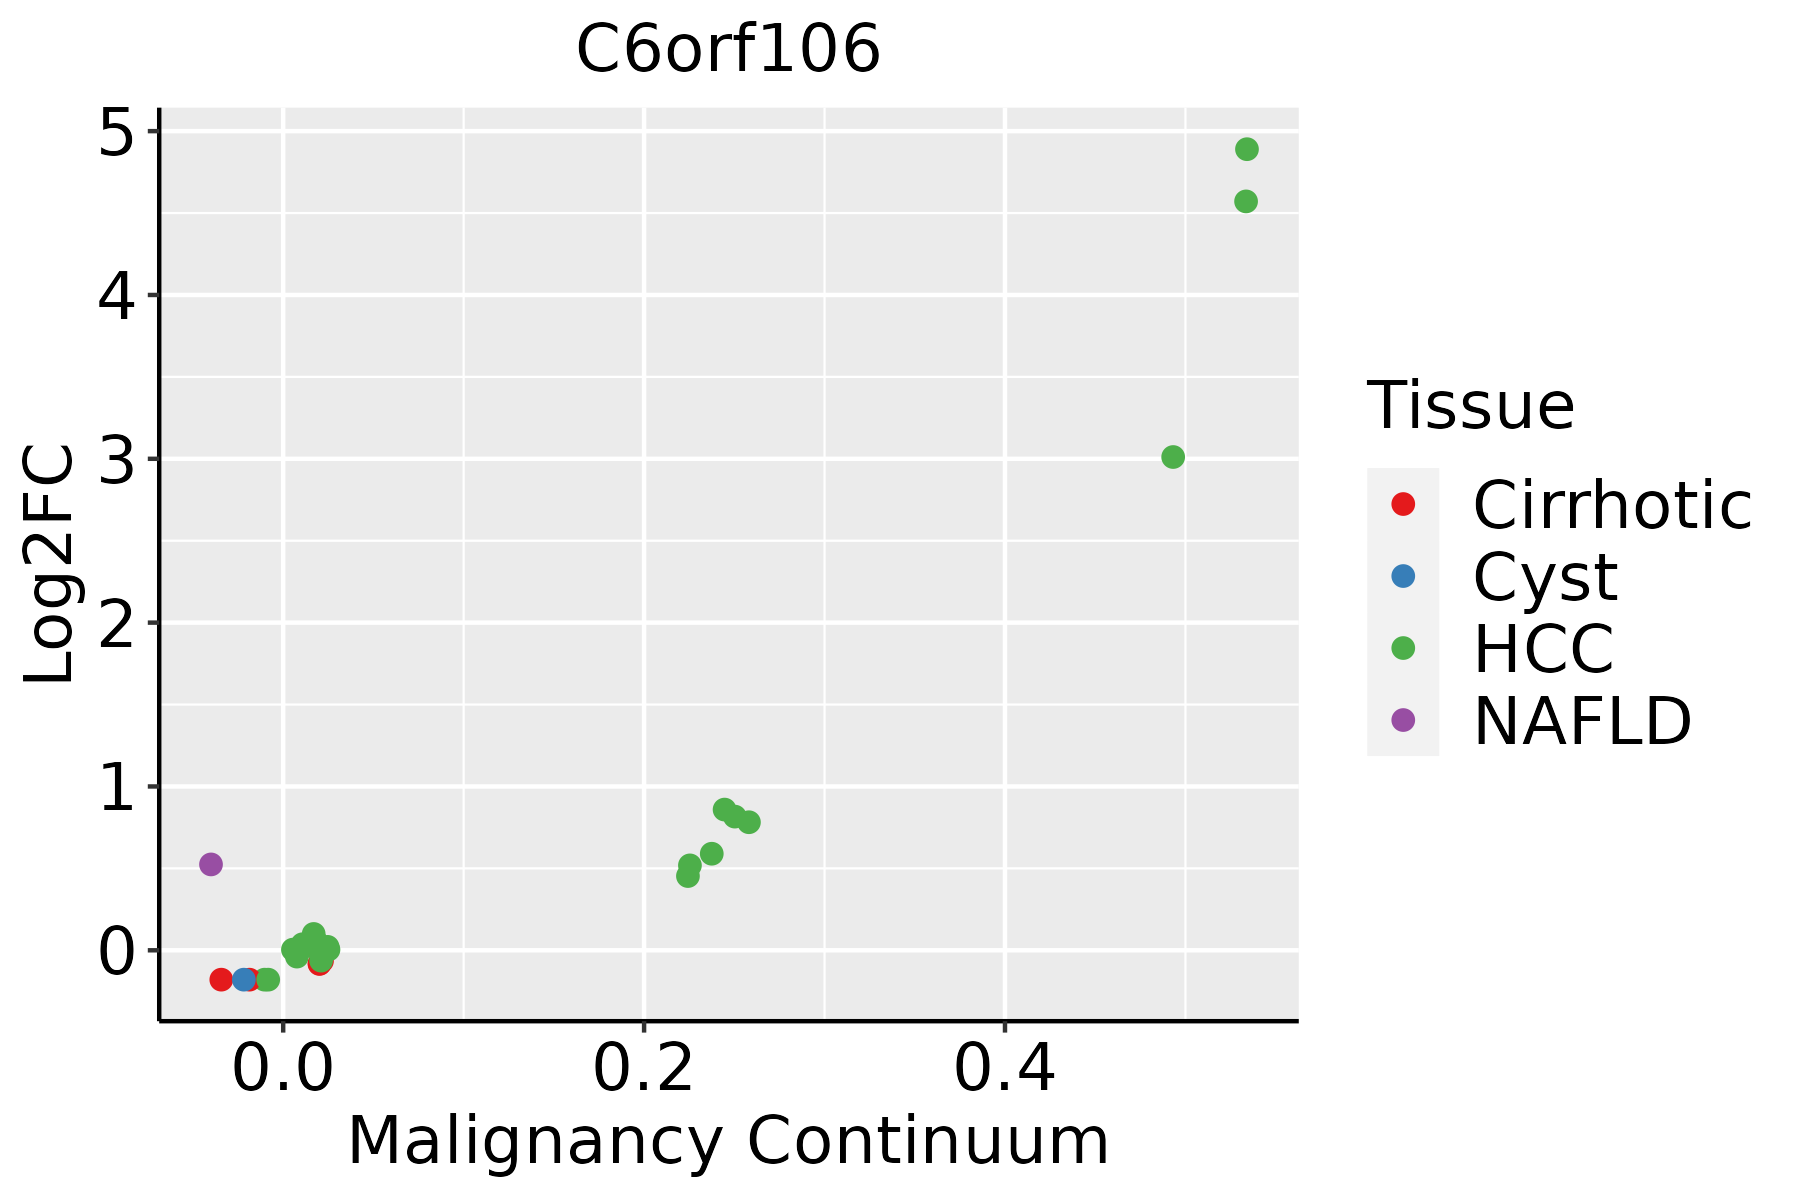 | HCC: Hepatocellular carcinoma |
| NAFLD: Non-alcoholic fatty liver disease | ||
| Oral Cavity | 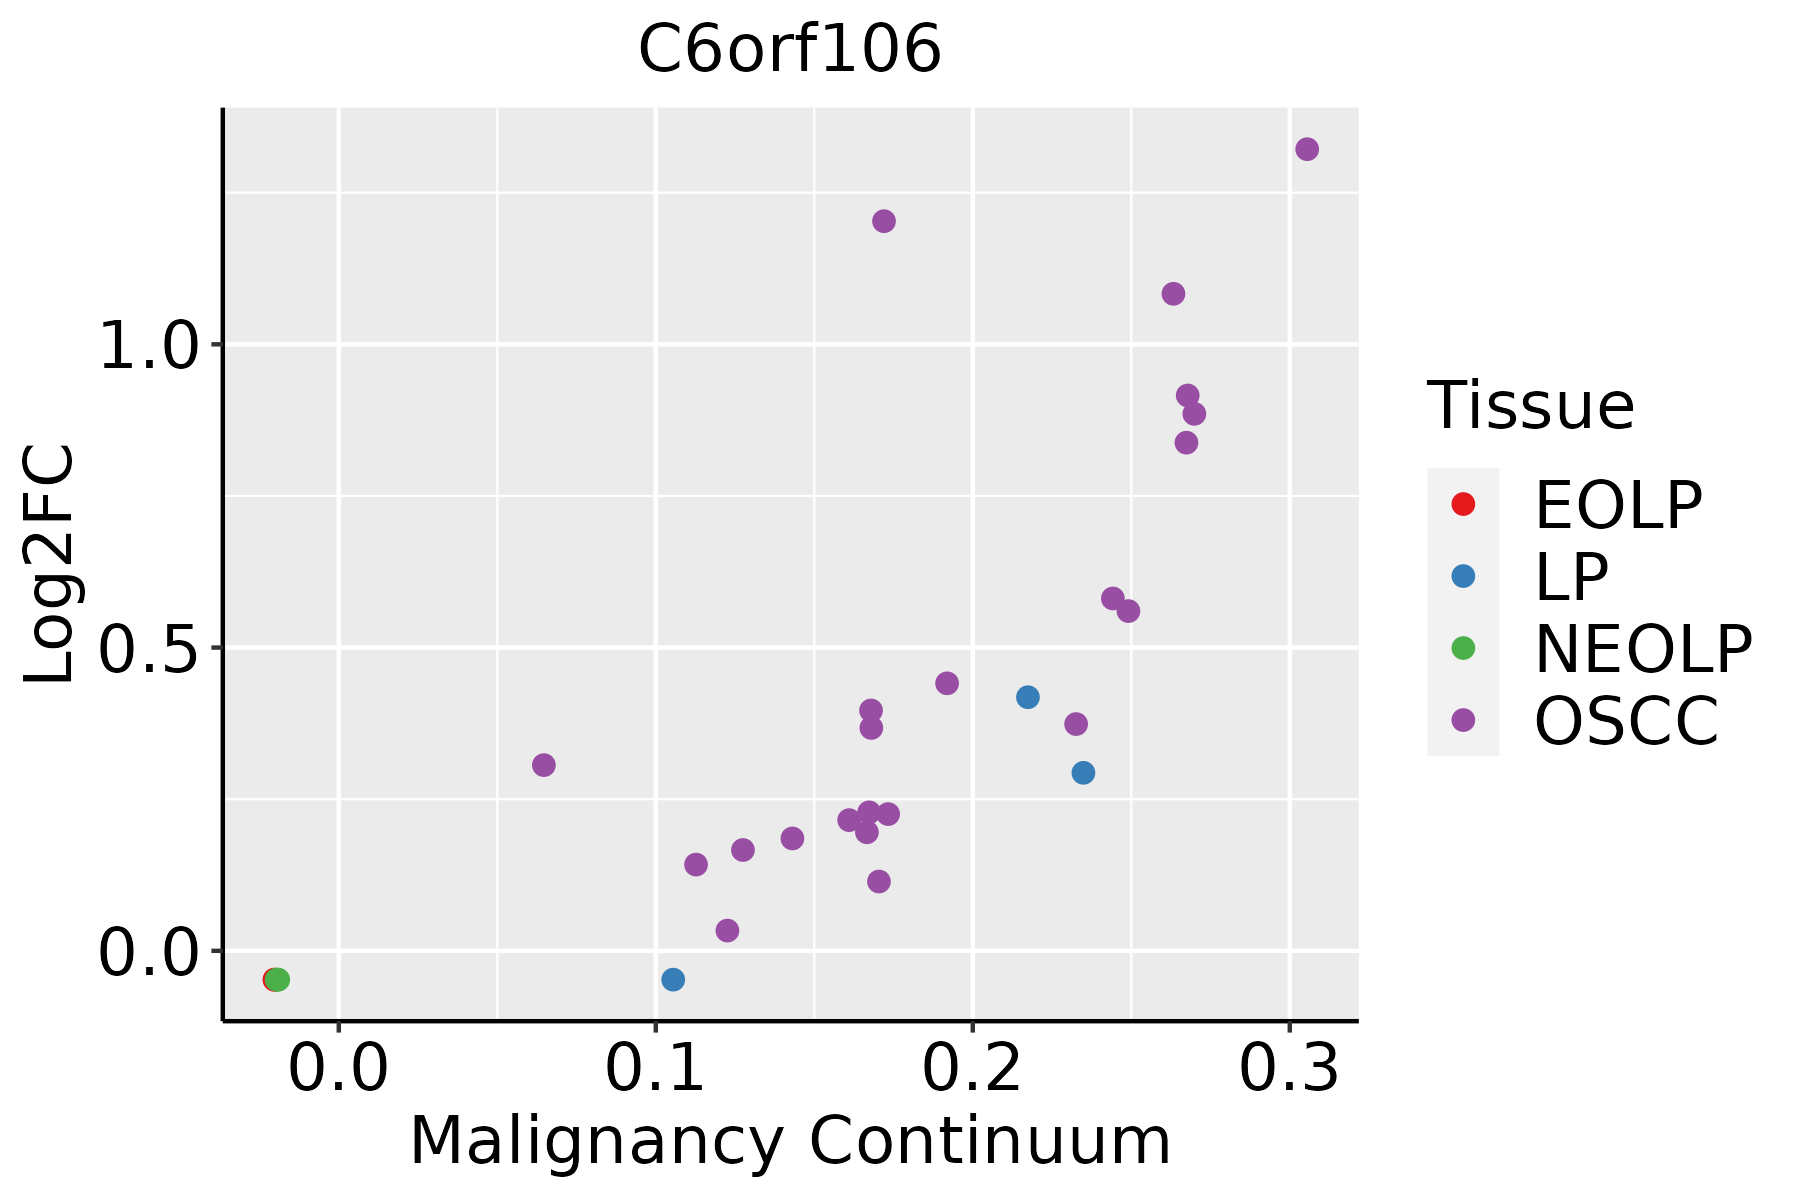 | EOLP: Erosive Oral lichen planus |
| LP: leukoplakia | ||
| NEOLP: Non-erosive oral lichen planus | ||
| OSCC: Oral squamous cell carcinoma | ||
| Prostate |  | BPH: Benign Prostatic Hyperplasia |
| Skin |  | AK: Actinic keratosis |
| cSCC: Cutaneous squamous cell carcinoma | ||
| SCCIS:squamous cell carcinoma in situ | ||
| Thyroid | 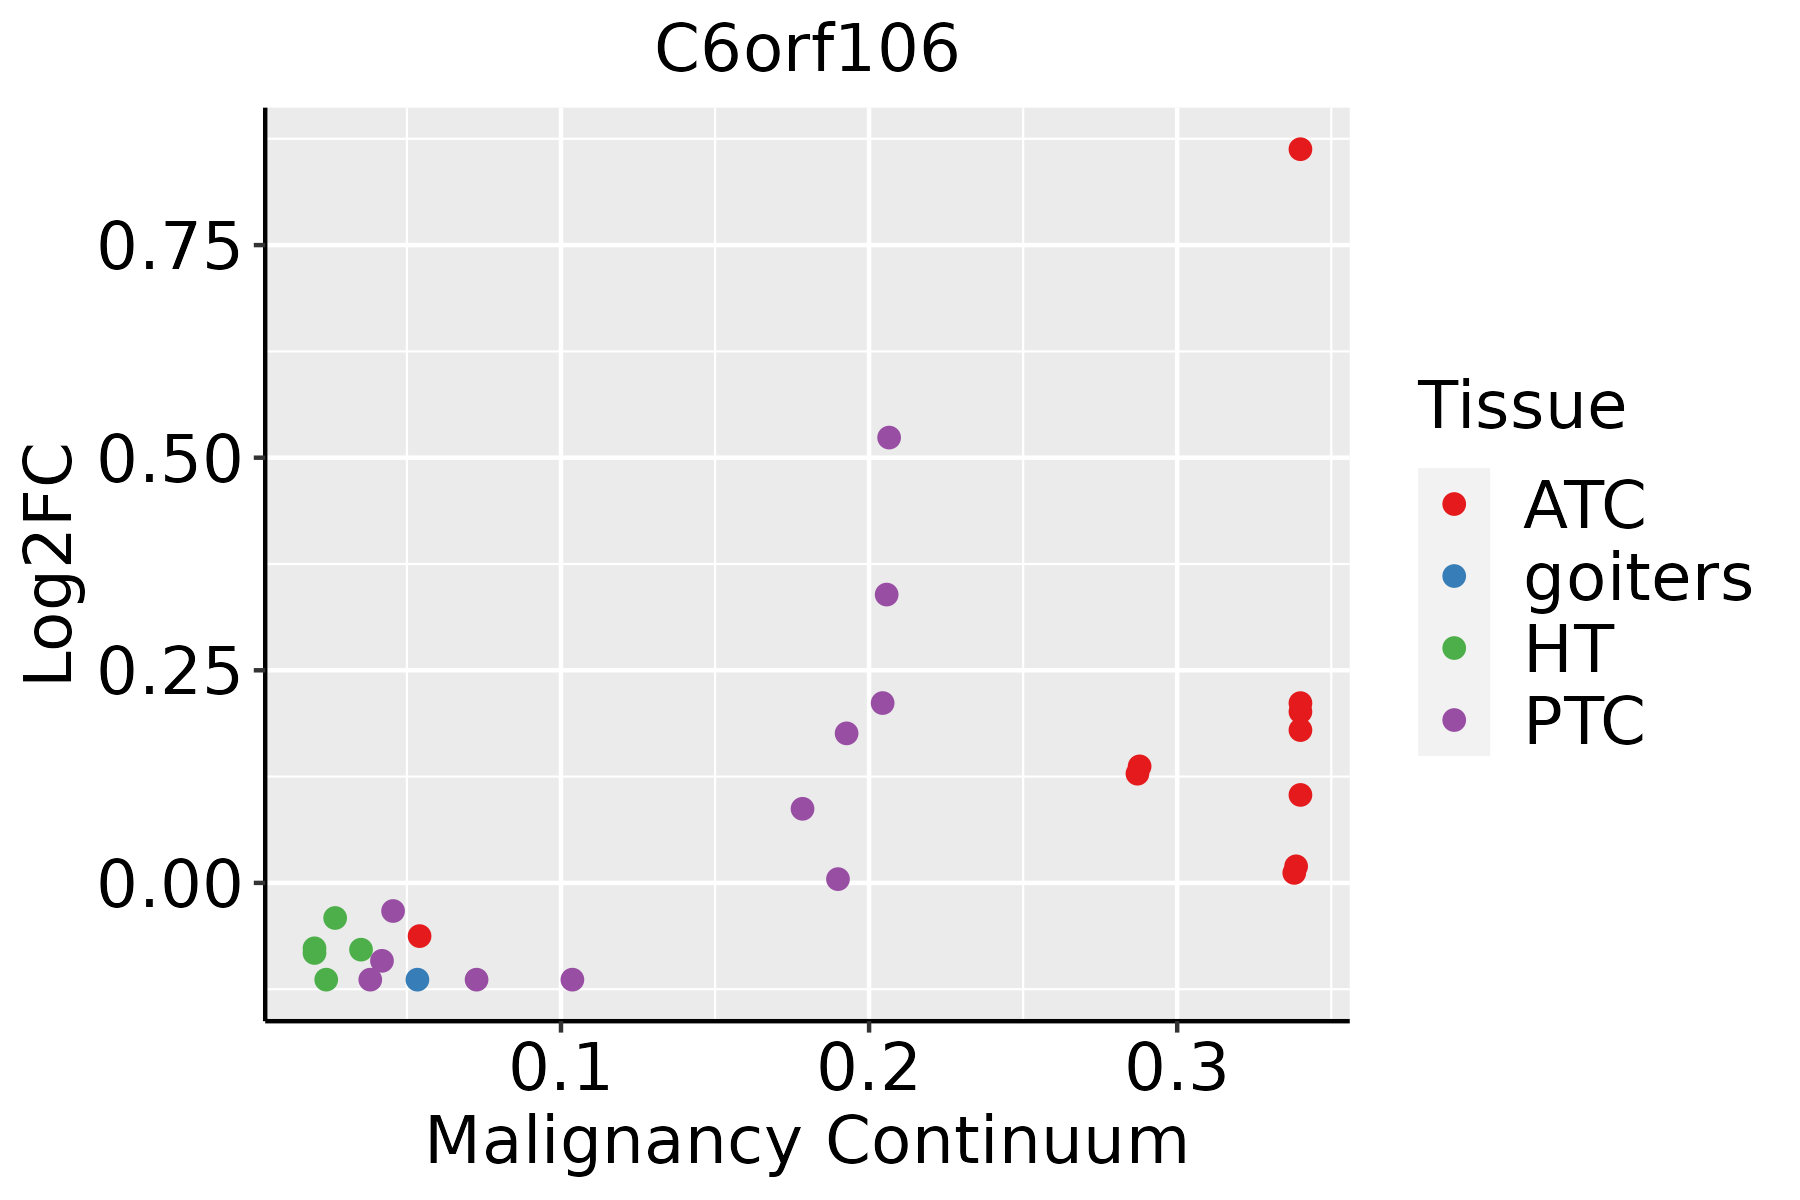 | ATC: Anaplastic thyroid cancer |
| HT: Hashimoto's thyroiditis | ||
| PTC: Papillary thyroid cancer |
| ∗log2FC in expression of this searched gene in stem-like cells from each diseased tissue sample relative to stem-like cells in normal samples in each tissue plotted against the malignancy continuum. Samples are colored based on if they are from different disease stage. |
Top |
Malignant transformation related pathway analysis |
| Find out the enriched GO biological processes and KEGG pathways involved in transition from healthy to precancer to cancer |
| Tissue | Disease Stage | Enriched GO biological Processes |
| Colorectum | AD |  |
| Colorectum | SER |  |
| Colorectum | MSS |  |
| Colorectum | MSI-H |  |
| Colorectum | FAP |  |
| ∗Top 15 enriched GO BP terms are showed in the bar plot of each disease state in each tissue. Each row represents a significant GO biological process which is colored according to the -log10(p.adjust). |
| Page: 1 2 3 4 5 6 7 8 9 |
| GO ID | Tissue | Disease Stage | Description | Gene Ratio | Bg Ratio | pvalue | p.adjust | Count |
| Page: 1 |
| Pathway ID | Tissue | Disease Stage | Description | Gene Ratio | Bg Ratio | pvalue | p.adjust | qvalue | Count |
| Page: 1 |
Top |
Cell-cell communication analysis |
| Identification of potential cell-cell interactions between two cell types and their ligand-receptor pairs for different disease states |
| Ligand | Receptor | LRpair | Pathway | Tissue | Disease Stage |
| Page: 1 |
Top |
Single-cell gene regulatory network inference analysis |
| Find out the significant the regulons (TFs) and the target genes of each regulon across cell types for different disease states |
| TF | Cell Type | Tissue | Disease Stage | Target Gene | RSS | Regulon Activity |
| ∗The dot plots of a searched regulon are shown for all cell subpopulations in each disease state of each tissue based on the regulon specific score inferred using pySCENIC and by calculating the average expression. |
| Page: 1 |
Top |
Somatic mutation of malignant transformation related genes |
| Annotation of somatic variants for genes involved in malignant transformation |
| Hugo Symbol | Variant Class | Variant Classification | dbSNP RS | HGVSc | HGVSp | HGVSp Short | SWISSPROT | BIOTYPE | SIFT | PolyPhen | Tumor Sample Barcode | Tissue | Histology | Sex | Age | Stage | Therapy Types | Drugs | Outcome |
| C6orf106 | deletion | Frame_Shift_Del | novel | c.126delN | p.Gly43ValfsTer8 | p.G43Vfs*8 | Q9H6K1 | protein_coding | TCGA-EW-A2FV-01 | Breast | breast invasive carcinoma | Female | <65 | III/IV | Chemotherapy | docetaxel | SD | ||
| C6orf106 | SNV | Missense_Mutation | c.98G>T | p.Arg33Met | p.R33M | Q9H6K1 | protein_coding | deleterious(0.04) | possibly_damaging(0.723) | TCGA-AA-3977-01 | Colorectum | colon adenocarcinoma | Male | >=65 | I/II | Unknown | Unknown | SD | |
| C6orf106 | SNV | Missense_Mutation | rs746154191 | c.233N>C | p.Val78Ala | p.V78A | Q9H6K1 | protein_coding | deleterious(0.03) | possibly_damaging(0.737) | TCGA-AZ-4315-01 | Colorectum | colon adenocarcinoma | Male | <65 | I/II | Unknown | Unknown | SD |
| C6orf106 | SNV | Missense_Mutation | c.493N>T | p.Thr165Ser | p.T165S | Q9H6K1 | protein_coding | tolerated(0.2) | benign(0.037) | TCGA-CK-4951-01 | Colorectum | colon adenocarcinoma | Female | >=65 | I/II | Unknown | Unknown | PD | |
| C6orf106 | SNV | Missense_Mutation | novel | c.20N>G | p.Asp7Gly | p.D7G | Q9H6K1 | protein_coding | deleterious(0) | probably_damaging(0.998) | TCGA-F4-6808-01 | Colorectum | colon adenocarcinoma | Female | <65 | I/II | Unknown | Unknown | SD |
| C6orf106 | SNV | Missense_Mutation | rs748166159 | c.430N>A | p.Val144Ile | p.V144I | Q9H6K1 | protein_coding | tolerated(0.12) | probably_damaging(0.996) | TCGA-F4-6856-01 | Colorectum | colon adenocarcinoma | Male | <65 | I/II | Ancillary | leucovorin | CR |
| C6orf106 | SNV | Missense_Mutation | c.654N>T | p.Lys218Asn | p.K218N | Q9H6K1 | protein_coding | deleterious(0.05) | benign(0.372) | TCGA-AP-A056-01 | Endometrium | uterine corpus endometrioid carcinoma | Female | <65 | I/II | Unknown | Unknown | SD | |
| C6orf106 | SNV | Missense_Mutation | rs750056993 | c.700N>A | p.Glu234Lys | p.E234K | Q9H6K1 | protein_coding | tolerated(0.85) | benign(0) | TCGA-AP-A0LM-01 | Endometrium | uterine corpus endometrioid carcinoma | Female | <65 | III/IV | Chemotherapy | cisplatin | SD |
| C6orf106 | SNV | Missense_Mutation | novel | c.308N>C | p.Asn103Thr | p.N103T | Q9H6K1 | protein_coding | deleterious(0) | probably_damaging(0.998) | TCGA-B5-A1MR-01 | Endometrium | uterine corpus endometrioid carcinoma | Female | >=65 | III/IV | Unknown | Unknown | SD |
| C6orf106 | SNV | Missense_Mutation | novel | c.455C>T | p.Ala152Val | p.A152V | Q9H6K1 | protein_coding | deleterious(0.03) | benign(0.306) | TCGA-B5-A1MX-01 | Endometrium | uterine corpus endometrioid carcinoma | Female | <65 | I/II | Hormone Therapy | megace | SD |
| Page: 1 2 |
Top |
Related drugs of malignant transformation related genes |
| Identification of chemicals and drugs interact with genes involved in malignant transfromation |
| (DGIdb 4.0) |
| Entrez ID | Symbol | Category | Interaction Types | Drug Claim Name | Drug Name | PMIDs |
| Page: 1 |

Copyright 2023-Present -The University of Texas Health Science Center at Houston |