
|
|||||
|
 | |
| |
| |
| |
| |
| |
|
Gene: C6orf1 |
Gene summary for C6ORF1 |
| Gene information | Species | Human | Gene symbol | C6orf1 | Gene ID | 221491 |
| Gene name | small integral membrane protein 29 | |
| Gene Alias | C6orf1 | |
| Cytomap | 6p21.31 | |
| Gene Type | protein-coding | GO ID | GO:0005575 | UniProtAcc | Q86T20 |
Top |
Malignant transformation analysis |
| Identification of the aberrant gene expression in precancerous and cancerous lesions by comparing the gene expression of stem-like cells in diseased tissues with normal stem cells |
| Entrez ID | Symbol | Replicates | Species | Organ | Tissue | Adj P-value | Log2FC | Malignancy |
| 221491 | C6orf1 | P1T-E | Human | Esophagus | ESCC | 3.85e-10 | 5.81e-01 | 0.0875 |
| 221491 | C6orf1 | P2T-E | Human | Esophagus | ESCC | 2.27e-28 | 5.49e-01 | 0.1177 |
| 221491 | C6orf1 | P4T-E | Human | Esophagus | ESCC | 1.28e-46 | 1.03e+00 | 0.1323 |
| 221491 | C6orf1 | P5T-E | Human | Esophagus | ESCC | 8.06e-28 | 5.73e-01 | 0.1327 |
| 221491 | C6orf1 | P8T-E | Human | Esophagus | ESCC | 1.41e-15 | 3.11e-01 | 0.0889 |
| 221491 | C6orf1 | P9T-E | Human | Esophagus | ESCC | 1.67e-54 | 1.10e+00 | 0.1131 |
| 221491 | C6orf1 | P10T-E | Human | Esophagus | ESCC | 9.10e-33 | 6.08e-01 | 0.116 |
| 221491 | C6orf1 | P11T-E | Human | Esophagus | ESCC | 2.03e-27 | 9.79e-01 | 0.1426 |
| 221491 | C6orf1 | P12T-E | Human | Esophagus | ESCC | 7.05e-15 | 3.08e-01 | 0.1122 |
| 221491 | C6orf1 | P15T-E | Human | Esophagus | ESCC | 3.23e-27 | 5.91e-01 | 0.1149 |
| 221491 | C6orf1 | P16T-E | Human | Esophagus | ESCC | 7.87e-30 | 6.49e-01 | 0.1153 |
| 221491 | C6orf1 | P17T-E | Human | Esophagus | ESCC | 1.42e-17 | 7.87e-01 | 0.1278 |
| 221491 | C6orf1 | P19T-E | Human | Esophagus | ESCC | 1.45e-20 | 1.15e+00 | 0.1662 |
| 221491 | C6orf1 | P20T-E | Human | Esophagus | ESCC | 5.53e-19 | 4.62e-01 | 0.1124 |
| 221491 | C6orf1 | P21T-E | Human | Esophagus | ESCC | 1.21e-48 | 1.02e+00 | 0.1617 |
| 221491 | C6orf1 | P22T-E | Human | Esophagus | ESCC | 6.69e-83 | 1.46e+00 | 0.1236 |
| 221491 | C6orf1 | P23T-E | Human | Esophagus | ESCC | 1.00e-31 | 8.42e-01 | 0.108 |
| 221491 | C6orf1 | P24T-E | Human | Esophagus | ESCC | 1.12e-36 | 7.43e-01 | 0.1287 |
| 221491 | C6orf1 | P26T-E | Human | Esophagus | ESCC | 9.94e-30 | 5.34e-01 | 0.1276 |
| 221491 | C6orf1 | P27T-E | Human | Esophagus | ESCC | 1.02e-17 | 3.52e-01 | 0.1055 |
| Page: 1 2 3 4 5 |
| Tissue | Expression Dynamics | Abbreviation |
| Esophagus |  | ESCC: Esophageal squamous cell carcinoma |
| HGIN: High-grade intraepithelial neoplasias | ||
| LGIN: Low-grade intraepithelial neoplasias | ||
| Oral Cavity | 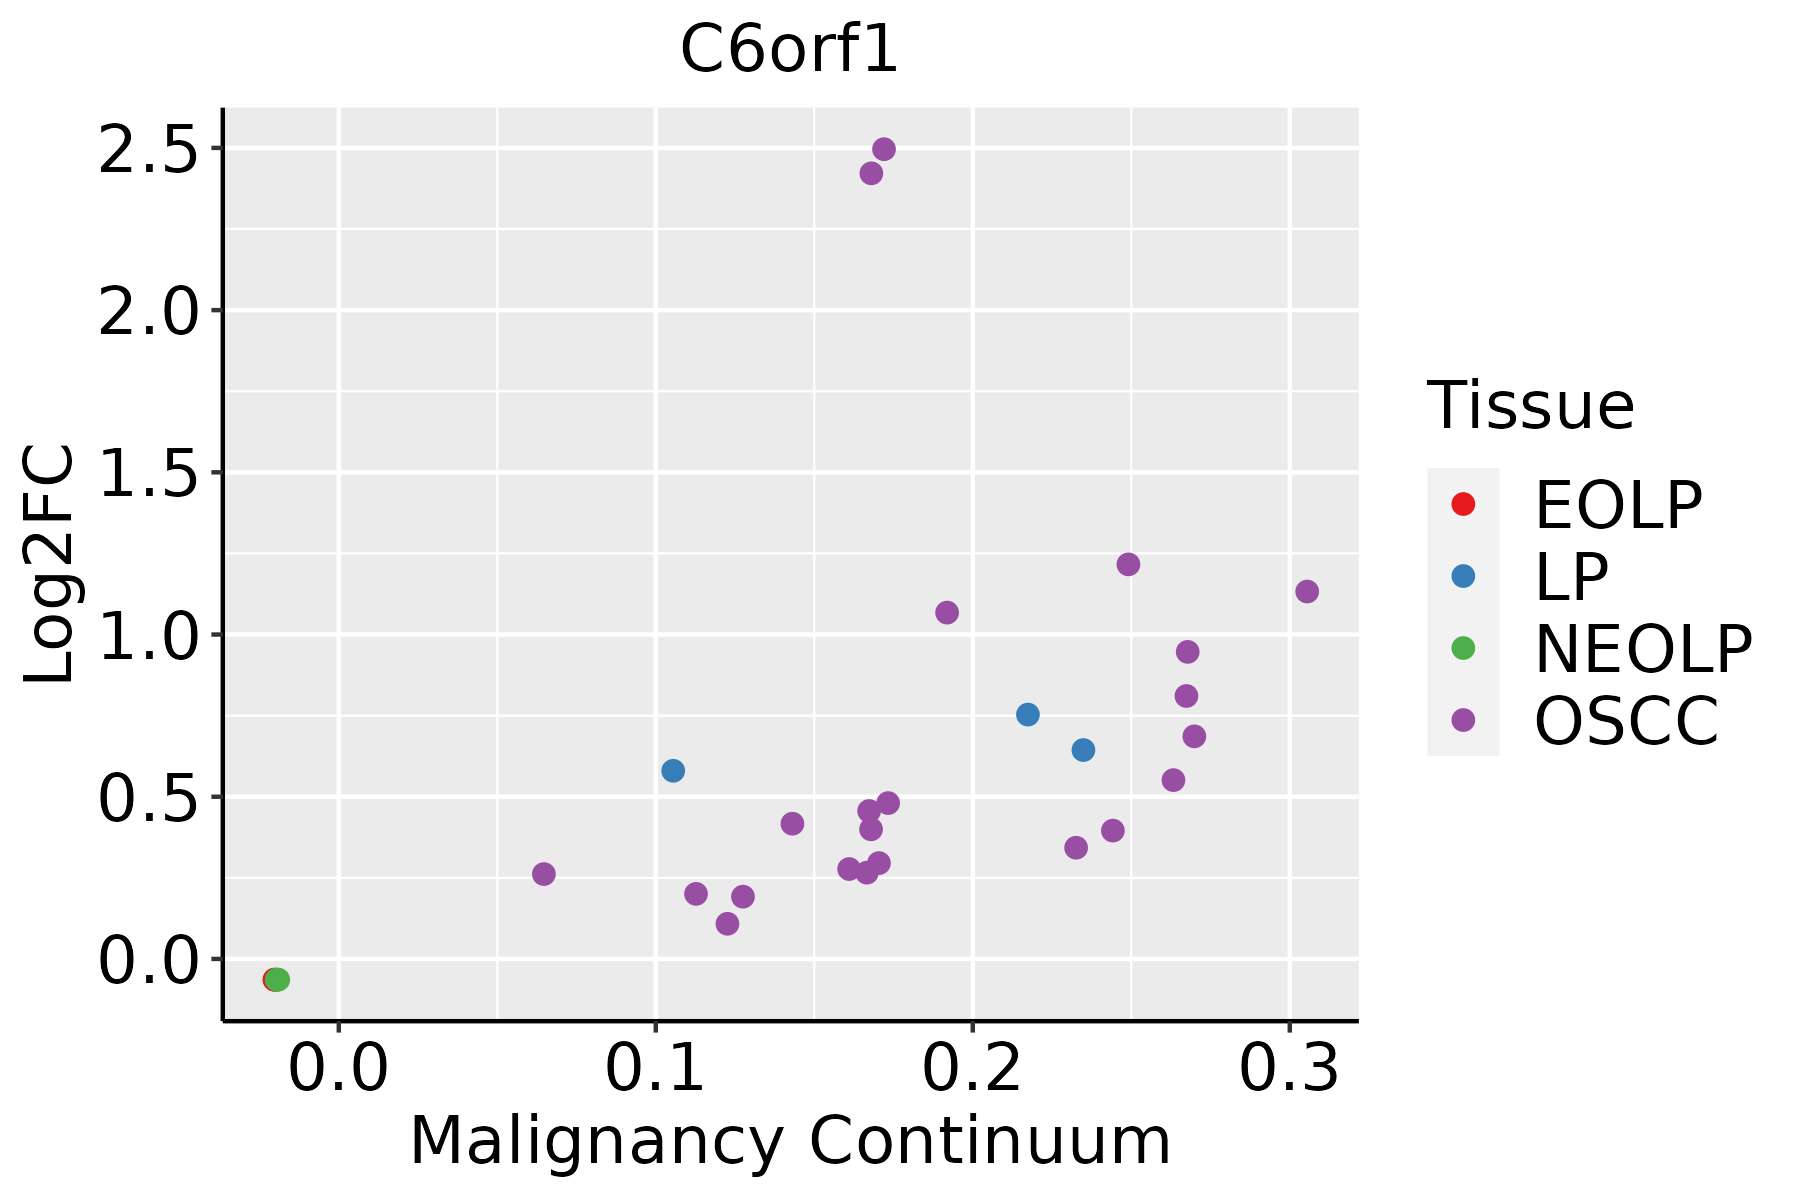 | EOLP: Erosive Oral lichen planus |
| LP: leukoplakia | ||
| NEOLP: Non-erosive oral lichen planus | ||
| OSCC: Oral squamous cell carcinoma | ||
| Prostate |  | BPH: Benign Prostatic Hyperplasia |
| Skin | 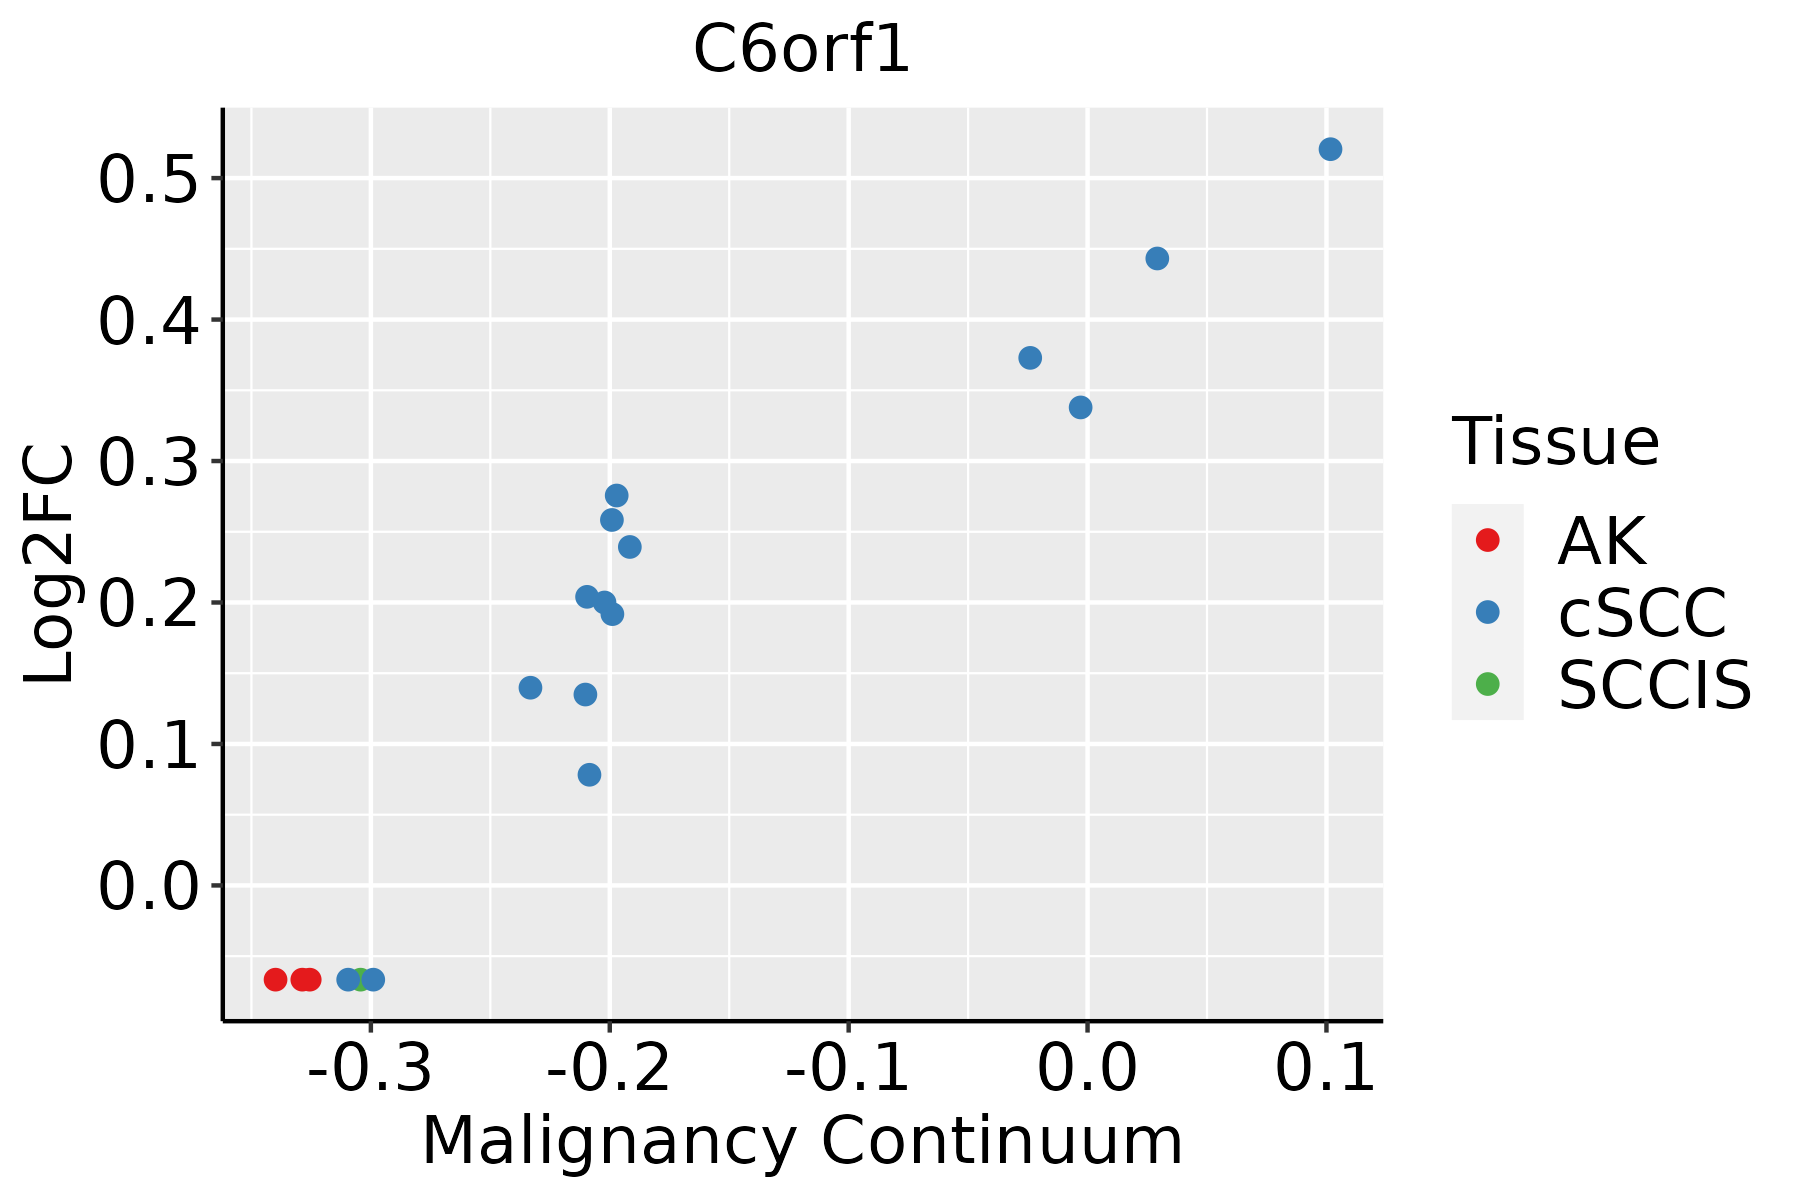 | AK: Actinic keratosis |
| cSCC: Cutaneous squamous cell carcinoma | ||
| SCCIS:squamous cell carcinoma in situ |
| ∗log2FC in expression of this searched gene in stem-like cells from each diseased tissue sample relative to stem-like cells in normal samples in each tissue plotted against the malignancy continuum. Samples are colored based on if they are from different disease stage. |
Top |
Malignant transformation related pathway analysis |
| Find out the enriched GO biological processes and KEGG pathways involved in transition from healthy to precancer to cancer |
| Tissue | Disease Stage | Enriched GO biological Processes |
| Colorectum | AD |  |
| Colorectum | SER |  |
| Colorectum | MSS |  |
| Colorectum | MSI-H |  |
| Colorectum | FAP |  |
| ∗Top 15 enriched GO BP terms are showed in the bar plot of each disease state in each tissue. Each row represents a significant GO biological process which is colored according to the -log10(p.adjust). |
| Page: 1 2 3 4 5 6 7 8 9 |
| GO ID | Tissue | Disease Stage | Description | Gene Ratio | Bg Ratio | pvalue | p.adjust | Count |
| GO:00017017 | Breast | Precancer | in utero embryonic development | 35/1080 | 367/18723 | 2.47e-03 | 2.27e-02 | 35 |
| GO:000170113 | Breast | IDC | in utero embryonic development | 42/1434 | 367/18723 | 5.85e-03 | 4.24e-02 | 42 |
| GO:000170122 | Breast | DCIS | in utero embryonic development | 41/1390 | 367/18723 | 5.74e-03 | 4.13e-02 | 41 |
| GO:000170119 | Esophagus | ESCC | in utero embryonic development | 243/8552 | 367/18723 | 1.00e-15 | 6.86e-14 | 243 |
| GO:000182412 | Esophagus | ESCC | blastocyst development | 73/8552 | 106/18723 | 1.13e-06 | 1.40e-05 | 73 |
| GO:000170116 | Oral cavity | OSCC | in utero embryonic development | 207/7305 | 367/18723 | 7.92e-12 | 2.95e-10 | 207 |
| GO:00018243 | Oral cavity | OSCC | blastocyst development | 66/7305 | 106/18723 | 1.04e-06 | 1.40e-05 | 66 |
| GO:000170124 | Skin | cSCC | in utero embryonic development | 150/4864 | 367/18723 | 2.47e-10 | 1.04e-08 | 150 |
| GO:000182413 | Skin | cSCC | blastocyst development | 53/4864 | 106/18723 | 9.74e-08 | 2.32e-06 | 53 |
| Page: 1 |
| Pathway ID | Tissue | Disease Stage | Description | Gene Ratio | Bg Ratio | pvalue | p.adjust | qvalue | Count |
| Page: 1 |
Top |
Cell-cell communication analysis |
| Identification of potential cell-cell interactions between two cell types and their ligand-receptor pairs for different disease states |
| Ligand | Receptor | LRpair | Pathway | Tissue | Disease Stage |
| Page: 1 |
Top |
Single-cell gene regulatory network inference analysis |
| Find out the significant the regulons (TFs) and the target genes of each regulon across cell types for different disease states |
| TF | Cell Type | Tissue | Disease Stage | Target Gene | RSS | Regulon Activity |
| ∗The dot plots of a searched regulon are shown for all cell subpopulations in each disease state of each tissue based on the regulon specific score inferred using pySCENIC and by calculating the average expression. |
| Page: 1 |
Top |
Somatic mutation of malignant transformation related genes |
| Annotation of somatic variants for genes involved in malignant transformation |
| Hugo Symbol | Variant Class | Variant Classification | dbSNP RS | HGVSc | HGVSp | HGVSp Short | SWISSPROT | BIOTYPE | SIFT | PolyPhen | Tumor Sample Barcode | Tissue | Histology | Sex | Age | Stage | Therapy Types | Drugs | Outcome |
| C6orf1 | SNV | Missense_Mutation | novel | c.472T>C | p.Phe158Leu | p.F158L | Q86T20 | protein_coding | deleterious_low_confidence(0) | benign(0.015) | TCGA-OL-A5D7-01 | Breast | breast invasive carcinoma | Female | >=65 | I/II | Chemotherapy | cytoxan | CR |
| C6orf1 | SNV | Missense_Mutation | c.179N>C | p.Met60Thr | p.M60T | Q86T20 | protein_coding | tolerated_low_confidence(0.55) | benign(0.019) | TCGA-DS-A1OC-01 | Cervix | cervical & endocervical cancer | Female | <65 | I/II | Chemotherapy | gemcitabine | SD | |
| C6orf1 | SNV | Missense_Mutation | rs761702562 | c.34G>A | p.Ala12Thr | p.A12T | Q86T20 | protein_coding | deleterious_low_confidence(0) | possibly_damaging(0.738) | TCGA-AZ-4615-01 | Colorectum | colon adenocarcinoma | Male | >=65 | III/IV | Chemotherapy | xeloda | PD |
| C6orf1 | insertion | Frame_Shift_Ins | novel | c.368_369insC | p.Gly124ArgfsTer9 | p.G124Rfs*9 | Q86T20 | protein_coding | TCGA-AA-3715-01 | Colorectum | colon adenocarcinoma | Male | >=65 | I/II | Unknown | Unknown | PD | ||
| C6orf1 | SNV | Missense_Mutation | novel | c.448N>A | p.Gly150Arg | p.G150R | Q86T20 | protein_coding | deleterious_low_confidence(0) | benign(0.015) | TCGA-AP-A051-01 | Endometrium | uterine corpus endometrioid carcinoma | Female | >=65 | I/II | Unknown | Unknown | SD |
| C6orf1 | SNV | Missense_Mutation | novel | c.220C>A | p.Pro74Thr | p.P74T | Q86T20 | protein_coding | tolerated_low_confidence(0.42) | possibly_damaging(0.767) | TCGA-AP-A1DV-01 | Endometrium | uterine corpus endometrioid carcinoma | Female | <65 | I/II | Unknown | Unknown | SD |
| C6orf1 | SNV | Missense_Mutation | novel | c.155G>A | p.Ser52Asn | p.S52N | Q86T20 | protein_coding | deleterious_low_confidence(0.05) | benign(0.422) | TCGA-BG-A222-01 | Endometrium | uterine corpus endometrioid carcinoma | Female | <65 | I/II | Unknown | Unknown | SD |
| C6orf1 | SNV | Missense_Mutation | novel | c.47N>T | p.Ser16Phe | p.S16F | Q86T20 | protein_coding | tolerated_low_confidence(0.12) | benign(0.143) | TCGA-DF-A2KU-01 | Endometrium | uterine corpus endometrioid carcinoma | Female | Unknown | I/II | Unknown | Unknown | SD |
| C6orf1 | SNV | Missense_Mutation | novel | c.335N>A | p.Ala112Asp | p.A112D | Q86T20 | protein_coding | deleterious_low_confidence(0.04) | benign(0.39) | TCGA-E6-A1LX-01 | Endometrium | uterine corpus endometrioid carcinoma | Female | <65 | I/II | Unknown | Unknown | SD |
| C6orf1 | SNV | Missense_Mutation | rs761702562 | c.34G>A | p.Ala12Thr | p.A12T | Q86T20 | protein_coding | deleterious_low_confidence(0) | possibly_damaging(0.738) | TCGA-FI-A2D5-01 | Endometrium | uterine corpus endometrioid carcinoma | Female | <65 | III/IV | Chemotherapy | carboplatinum | PD |
| Page: 1 2 |
Top |
Related drugs of malignant transformation related genes |
| Identification of chemicals and drugs interact with genes involved in malignant transfromation |
| (DGIdb 4.0) |
| Entrez ID | Symbol | Category | Interaction Types | Drug Claim Name | Drug Name | PMIDs |
| Page: 1 |

Copyright 2023-Present -The University of Texas Health Science Center at Houston |