
|
|||||
|
 | |
| |
| |
| |
| |
| |
|
Gene: C5orf38 |
Gene summary for C5ORF38 |
| Gene information | Species | Human | Gene symbol | C5orf38 | Gene ID | 153571 |
| Gene name | chromosome 5 open reading frame 38 | |
| Gene Alias | CEI | |
| Cytomap | 5p15.33 | |
| Gene Type | ncRNA | GO ID | GO:0005575 | UniProtAcc | NA |
Top |
Malignant transformation analysis |
| Identification of the aberrant gene expression in precancerous and cancerous lesions by comparing the gene expression of stem-like cells in diseased tissues with normal stem cells |
| Entrez ID | Symbol | Replicates | Species | Organ | Tissue | Adj P-value | Log2FC | Malignancy |
| 153571 | C5orf38 | GSM4909282 | Human | Breast | IDC | 3.84e-07 | -1.79e-01 | -0.0288 |
| 153571 | C5orf38 | GSM4909287 | Human | Breast | IDC | 1.23e-06 | -1.33e-01 | 0.2057 |
| 153571 | C5orf38 | GSM4909296 | Human | Breast | IDC | 3.84e-07 | -1.84e-01 | 0.1524 |
| 153571 | C5orf38 | GSM4909297 | Human | Breast | IDC | 4.57e-04 | -7.52e-02 | 0.1517 |
| 153571 | C5orf38 | GSM4909307 | Human | Breast | IDC | 1.91e-03 | 2.41e-01 | 0.1569 |
| 153571 | C5orf38 | GSM4909308 | Human | Breast | IDC | 5.17e-27 | 6.64e-01 | 0.158 |
| 153571 | C5orf38 | GSM4909311 | Human | Breast | IDC | 4.62e-07 | -7.93e-02 | 0.1534 |
| 153571 | C5orf38 | GSM4909317 | Human | Breast | IDC | 3.34e-02 | 2.72e-01 | 0.1355 |
| 153571 | C5orf38 | GSM4909318 | Human | Breast | IDC | 1.60e-04 | 5.49e-01 | 0.2031 |
| 153571 | C5orf38 | GSM4909319 | Human | Breast | IDC | 8.38e-13 | -8.00e-02 | 0.1563 |
| 153571 | C5orf38 | GSM4909321 | Human | Breast | IDC | 1.12e-02 | 1.51e-02 | 0.1559 |
| 153571 | C5orf38 | M2 | Human | Breast | IDC | 9.33e-03 | 1.44e-01 | 0.21 |
| 153571 | C5orf38 | NCCBC5 | Human | Breast | DCIS | 1.01e-04 | -1.52e-01 | 0.2046 |
| 153571 | C5orf38 | P1 | Human | Breast | IDC | 5.87e-06 | -7.36e-02 | 0.1527 |
| 153571 | C5orf38 | P3 | Human | Breast | IDC | 9.35e-03 | 5.02e-01 | 0.1542 |
| 153571 | C5orf38 | DCIS2 | Human | Breast | DCIS | 1.53e-27 | 6.03e-02 | 0.0085 |
| 153571 | C5orf38 | LZE4T | Human | Esophagus | ESCC | 1.85e-02 | 1.17e-01 | 0.0811 |
| 153571 | C5orf38 | P1T-E | Human | Esophagus | ESCC | 3.44e-05 | 2.88e-01 | 0.0875 |
| 153571 | C5orf38 | P2T-E | Human | Esophagus | ESCC | 1.46e-13 | 2.90e-01 | 0.1177 |
| 153571 | C5orf38 | P4T-E | Human | Esophagus | ESCC | 1.73e-04 | 1.04e-01 | 0.1323 |
| Page: 1 2 3 4 5 |
| Tissue | Expression Dynamics | Abbreviation |
| Breast | 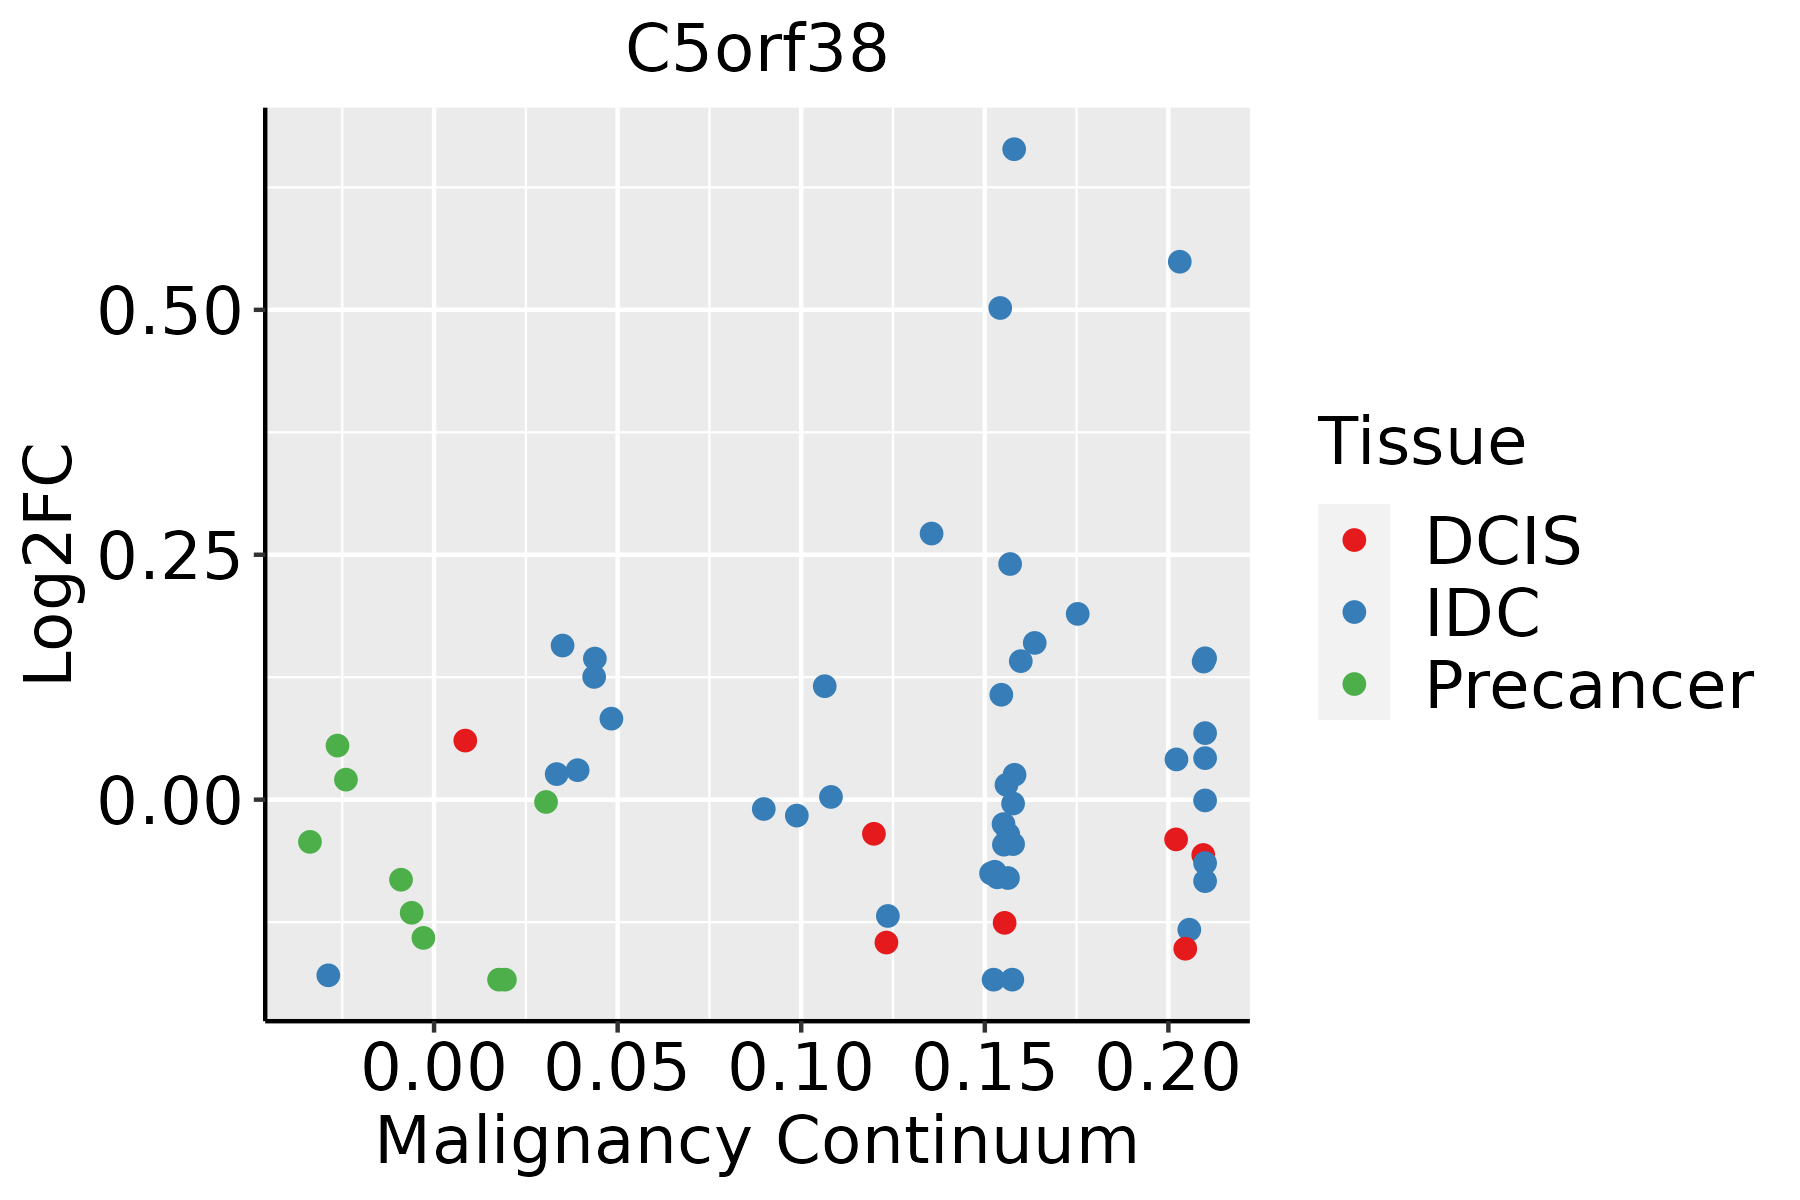 | IDC: Invasive ductal carcinoma |
| DCIS: Ductal carcinoma in situ | ||
| Precancer(BRCA1-mut): Precancerous lesion from BRCA1 mutation carriers | ||
| Esophagus | 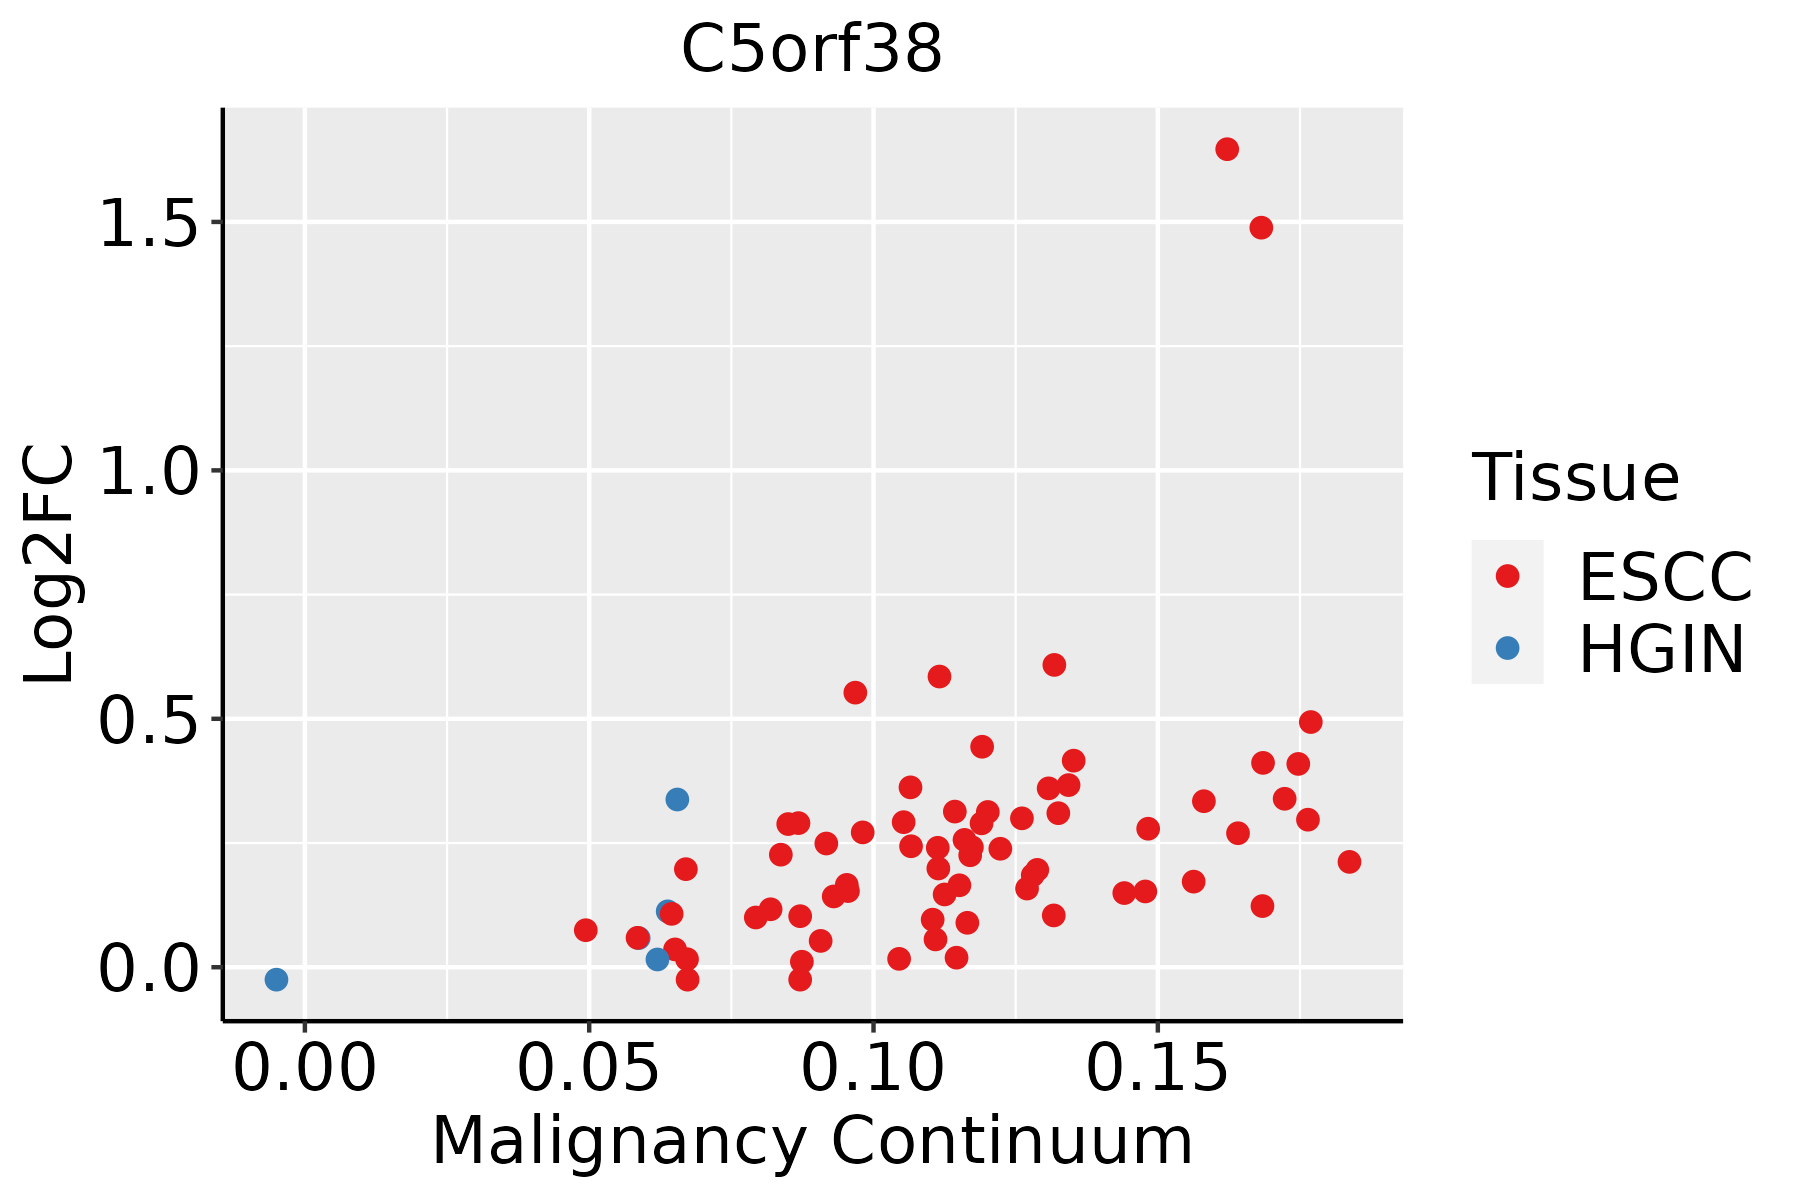 | ESCC: Esophageal squamous cell carcinoma |
| HGIN: High-grade intraepithelial neoplasias | ||
| LGIN: Low-grade intraepithelial neoplasias | ||
| Oral Cavity | 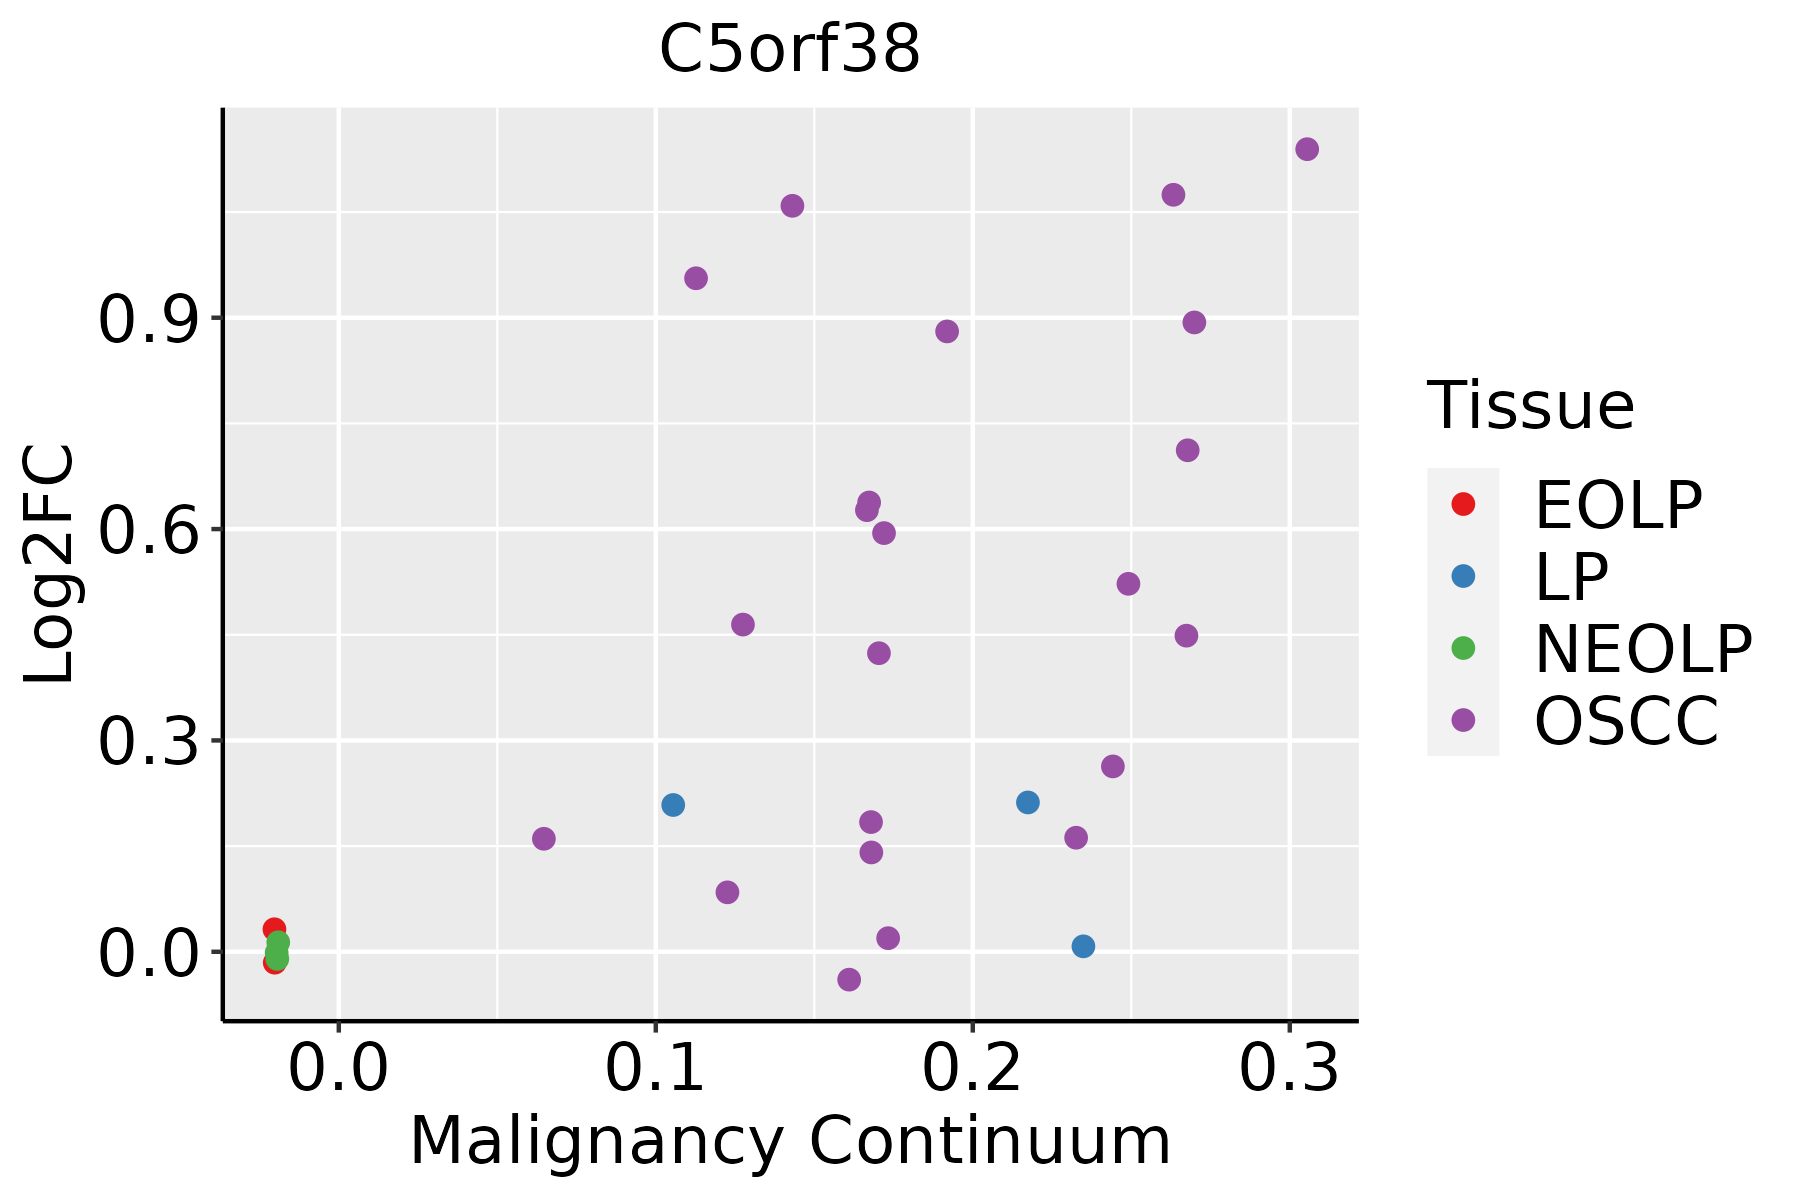 | EOLP: Erosive Oral lichen planus |
| LP: leukoplakia | ||
| NEOLP: Non-erosive oral lichen planus | ||
| OSCC: Oral squamous cell carcinoma | ||
| Thyroid | 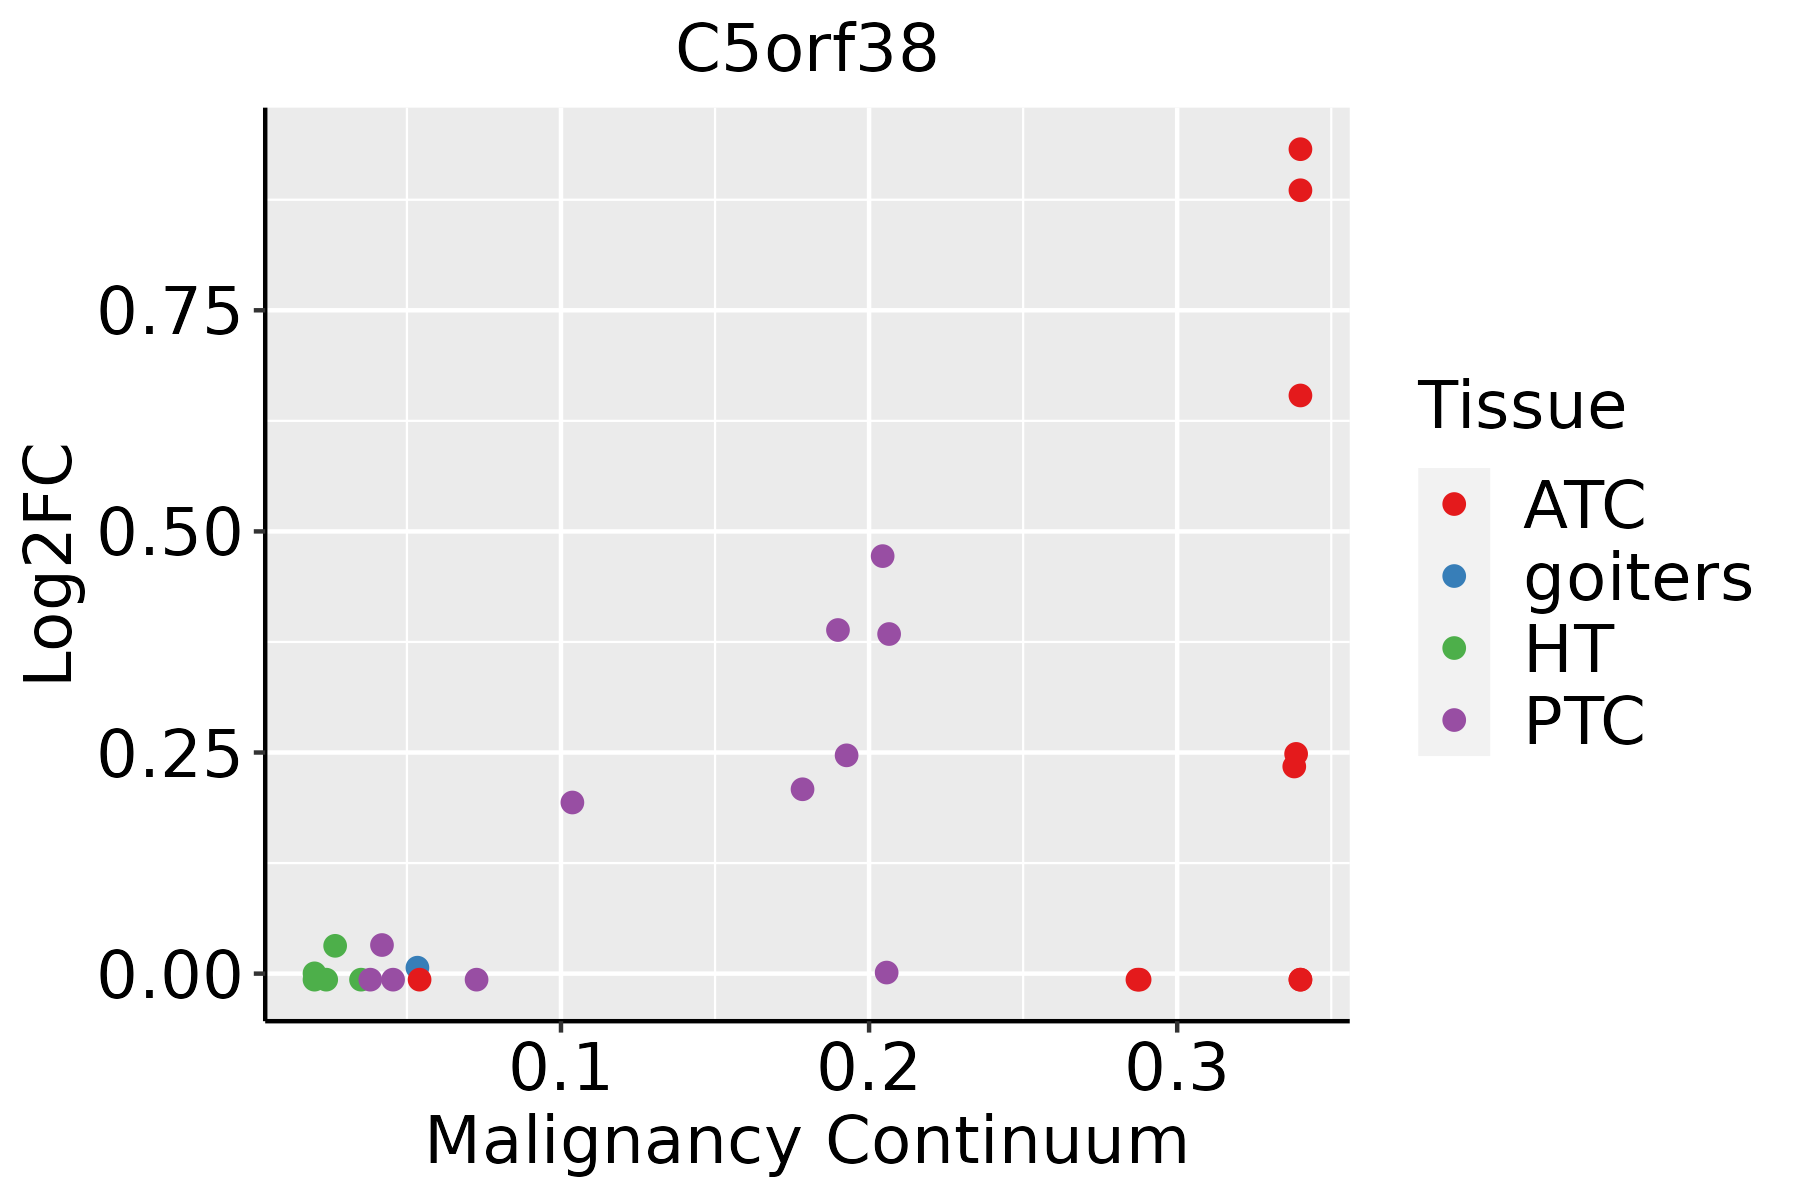 | ATC: Anaplastic thyroid cancer |
| HT: Hashimoto's thyroiditis | ||
| PTC: Papillary thyroid cancer |
| ∗log2FC in expression of this searched gene in stem-like cells from each diseased tissue sample relative to stem-like cells in normal samples in each tissue plotted against the malignancy continuum. Samples are colored based on if they are from different disease stage. |
Top |
Malignant transformation related pathway analysis |
| Find out the enriched GO biological processes and KEGG pathways involved in transition from healthy to precancer to cancer |
| Tissue | Disease Stage | Enriched GO biological Processes |
| Colorectum | AD |  |
| Colorectum | SER |  |
| Colorectum | MSS |  |
| Colorectum | MSI-H |  |
| Colorectum | FAP |  |
| ∗Top 15 enriched GO BP terms are showed in the bar plot of each disease state in each tissue. Each row represents a significant GO biological process which is colored according to the -log10(p.adjust). |
| Page: 1 2 3 4 5 6 7 8 9 |
| GO ID | Tissue | Disease Stage | Description | Gene Ratio | Bg Ratio | pvalue | p.adjust | Count |
| Page: 1 |
| Pathway ID | Tissue | Disease Stage | Description | Gene Ratio | Bg Ratio | pvalue | p.adjust | qvalue | Count |
| Page: 1 |
Top |
Cell-cell communication analysis |
| Identification of potential cell-cell interactions between two cell types and their ligand-receptor pairs for different disease states |
| Ligand | Receptor | LRpair | Pathway | Tissue | Disease Stage |
| Page: 1 |
Top |
Single-cell gene regulatory network inference analysis |
| Find out the significant the regulons (TFs) and the target genes of each regulon across cell types for different disease states |
| TF | Cell Type | Tissue | Disease Stage | Target Gene | RSS | Regulon Activity |
| ∗The dot plots of a searched regulon are shown for all cell subpopulations in each disease state of each tissue based on the regulon specific score inferred using pySCENIC and by calculating the average expression. |
| Page: 1 |
Top |
Somatic mutation of malignant transformation related genes |
| Annotation of somatic variants for genes involved in malignant transformation |
| Hugo Symbol | Variant Class | Variant Classification | dbSNP RS | HGVSc | HGVSp | HGVSp Short | SWISSPROT | BIOTYPE | SIFT | PolyPhen | Tumor Sample Barcode | Tissue | Histology | Sex | Age | Stage | Therapy Types | Drugs | Outcome |
| C5orf38 | SNV | Missense_Mutation | novel | c.56N>T | p.Ser19Phe | p.S19F | Q86SI9 | protein_coding | deleterious_low_confidence(0) | probably_damaging(0.937) | TCGA-EA-A3HU-01 | Cervix | cervical & endocervical cancer | Female | <65 | I/II | Unknown | Unknown | SD |
| C5orf38 | SNV | Missense_Mutation | rs779809202 | c.410N>T | p.Arg137Ile | p.R137I | Q86SI9 | protein_coding | deleterious_low_confidence(0) | benign(0.027) | TCGA-FU-A3HZ-01 | Cervix | cervical & endocervical cancer | Female | <65 | I/II | Chemotherapy | cisplatin | CR |
| C5orf38 | SNV | Missense_Mutation | c.169N>A | p.Pro57Thr | p.P57T | Q86SI9 | protein_coding | deleterious_low_confidence(0) | benign(0.393) | TCGA-AM-5821-01 | Colorectum | colon adenocarcinoma | Female | >=65 | I/II | Unknown | Unknown | SD | |
| C5orf38 | SNV | Missense_Mutation | novel | c.359N>T | p.Ala120Val | p.A120V | Q86SI9 | protein_coding | deleterious_low_confidence(0) | benign(0.441) | TCGA-WS-AB45-01 | Colorectum | colon adenocarcinoma | Female | <65 | I/II | Unknown | Unknown | SD |
| C5orf38 | SNV | Missense_Mutation | c.59N>T | p.Thr20Met | p.T20M | Q86SI9 | protein_coding | deleterious_low_confidence(0) | probably_damaging(0.96) | TCGA-DC-6155-01 | Colorectum | rectum adenocarcinoma | Female | <65 | III/IV | Ancillary | leucovorin | SD | |
| C5orf38 | SNV | Missense_Mutation | c.179N>A | p.Arg60Gln | p.R60Q | Q86SI9 | protein_coding | deleterious_low_confidence(0) | benign(0.367) | TCGA-EI-6917-01 | Colorectum | rectum adenocarcinoma | Male | <65 | III/IV | Chemotherapy | 5fluorouracil+oxaciplatina+l-folinian | SD | |
| C5orf38 | SNV | Missense_Mutation | c.205N>A | p.Val69Met | p.V69M | Q86SI9 | protein_coding | deleterious_low_confidence(0.02) | possibly_damaging(0.596) | TCGA-A5-A0VP-01 | Endometrium | uterine corpus endometrioid carcinoma | Female | >=65 | I/II | Unknown | Unknown | SD | |
| C5orf38 | SNV | Missense_Mutation | rs779809202 | c.410G>T | p.Arg137Ile | p.R137I | Q86SI9 | protein_coding | deleterious_low_confidence(0) | benign(0.027) | TCGA-A5-A1OF-01 | Endometrium | uterine corpus endometrioid carcinoma | Female | <65 | I/II | Unknown | Unknown | SD |
| C5orf38 | SNV | Missense_Mutation | c.179N>A | p.Arg60Gln | p.R60Q | Q86SI9 | protein_coding | deleterious_low_confidence(0) | benign(0.367) | TCGA-AP-A059-01 | Endometrium | uterine corpus endometrioid carcinoma | Female | >=65 | I/II | Unknown | Unknown | SD | |
| C5orf38 | SNV | Missense_Mutation | novel | c.289G>A | p.Gly97Arg | p.G97R | Q86SI9 | protein_coding | deleterious_low_confidence(0) | probably_damaging(0.978) | TCGA-AP-A0LM-01 | Endometrium | uterine corpus endometrioid carcinoma | Female | <65 | III/IV | Chemotherapy | cisplatin | SD |
| Page: 1 2 3 |
Top |
Related drugs of malignant transformation related genes |
| Identification of chemicals and drugs interact with genes involved in malignant transfromation |
| (DGIdb 4.0) |
| Entrez ID | Symbol | Category | Interaction Types | Drug Claim Name | Drug Name | PMIDs |
| Page: 1 |

Copyright 2023-Present -The University of Texas Health Science Center at Houston |