
|
|||||
|
 | |
| |
| |
| |
| |
| |
|
Gene: C5orf22 |
Gene summary for C5ORF22 |
| Gene information | Species | Human | Gene symbol | C5orf22 | Gene ID | 55322 |
| Gene name | chromosome 5 open reading frame 22 | |
| Gene Alias | C5orf22 | |
| Cytomap | 5p13.3 | |
| Gene Type | protein-coding | GO ID | GO:0003674 | UniProtAcc | A0A024RE14 |
Top |
Malignant transformation analysis |
| Identification of the aberrant gene expression in precancerous and cancerous lesions by comparing the gene expression of stem-like cells in diseased tissues with normal stem cells |
| Entrez ID | Symbol | Replicates | Species | Organ | Tissue | Adj P-value | Log2FC | Malignancy |
| 55322 | C5orf22 | LZE4T | Human | Esophagus | ESCC | 3.64e-07 | 2.92e-01 | 0.0811 |
| 55322 | C5orf22 | LZE5T | Human | Esophagus | ESCC | 1.16e-04 | 4.90e-01 | 0.0514 |
| 55322 | C5orf22 | LZE7T | Human | Esophagus | ESCC | 2.23e-03 | 2.59e-01 | 0.0667 |
| 55322 | C5orf22 | LZE20T | Human | Esophagus | ESCC | 1.55e-09 | 4.12e-01 | 0.0662 |
| 55322 | C5orf22 | LZE24T | Human | Esophagus | ESCC | 2.60e-07 | 2.34e-01 | 0.0596 |
| 55322 | C5orf22 | P2T-E | Human | Esophagus | ESCC | 8.59e-13 | 2.77e-01 | 0.1177 |
| 55322 | C5orf22 | P4T-E | Human | Esophagus | ESCC | 1.42e-06 | 1.91e-01 | 0.1323 |
| 55322 | C5orf22 | P5T-E | Human | Esophagus | ESCC | 1.04e-14 | 2.63e-01 | 0.1327 |
| 55322 | C5orf22 | P8T-E | Human | Esophagus | ESCC | 9.38e-15 | 2.26e-01 | 0.0889 |
| 55322 | C5orf22 | P9T-E | Human | Esophagus | ESCC | 1.73e-05 | 1.64e-01 | 0.1131 |
| 55322 | C5orf22 | P10T-E | Human | Esophagus | ESCC | 7.80e-24 | 3.61e-01 | 0.116 |
| 55322 | C5orf22 | P11T-E | Human | Esophagus | ESCC | 2.05e-04 | 2.12e-01 | 0.1426 |
| 55322 | C5orf22 | P12T-E | Human | Esophagus | ESCC | 3.02e-15 | 2.89e-01 | 0.1122 |
| 55322 | C5orf22 | P15T-E | Human | Esophagus | ESCC | 3.21e-06 | 1.61e-01 | 0.1149 |
| 55322 | C5orf22 | P16T-E | Human | Esophagus | ESCC | 6.80e-22 | 3.41e-01 | 0.1153 |
| 55322 | C5orf22 | P17T-E | Human | Esophagus | ESCC | 9.15e-06 | 2.90e-01 | 0.1278 |
| 55322 | C5orf22 | P19T-E | Human | Esophagus | ESCC | 1.51e-09 | 7.66e-01 | 0.1662 |
| 55322 | C5orf22 | P20T-E | Human | Esophagus | ESCC | 6.41e-09 | 2.72e-01 | 0.1124 |
| 55322 | C5orf22 | P21T-E | Human | Esophagus | ESCC | 5.19e-08 | 1.92e-01 | 0.1617 |
| 55322 | C5orf22 | P22T-E | Human | Esophagus | ESCC | 1.26e-11 | 1.89e-01 | 0.1236 |
| Page: 1 2 3 4 |
| Tissue | Expression Dynamics | Abbreviation |
| Esophagus | 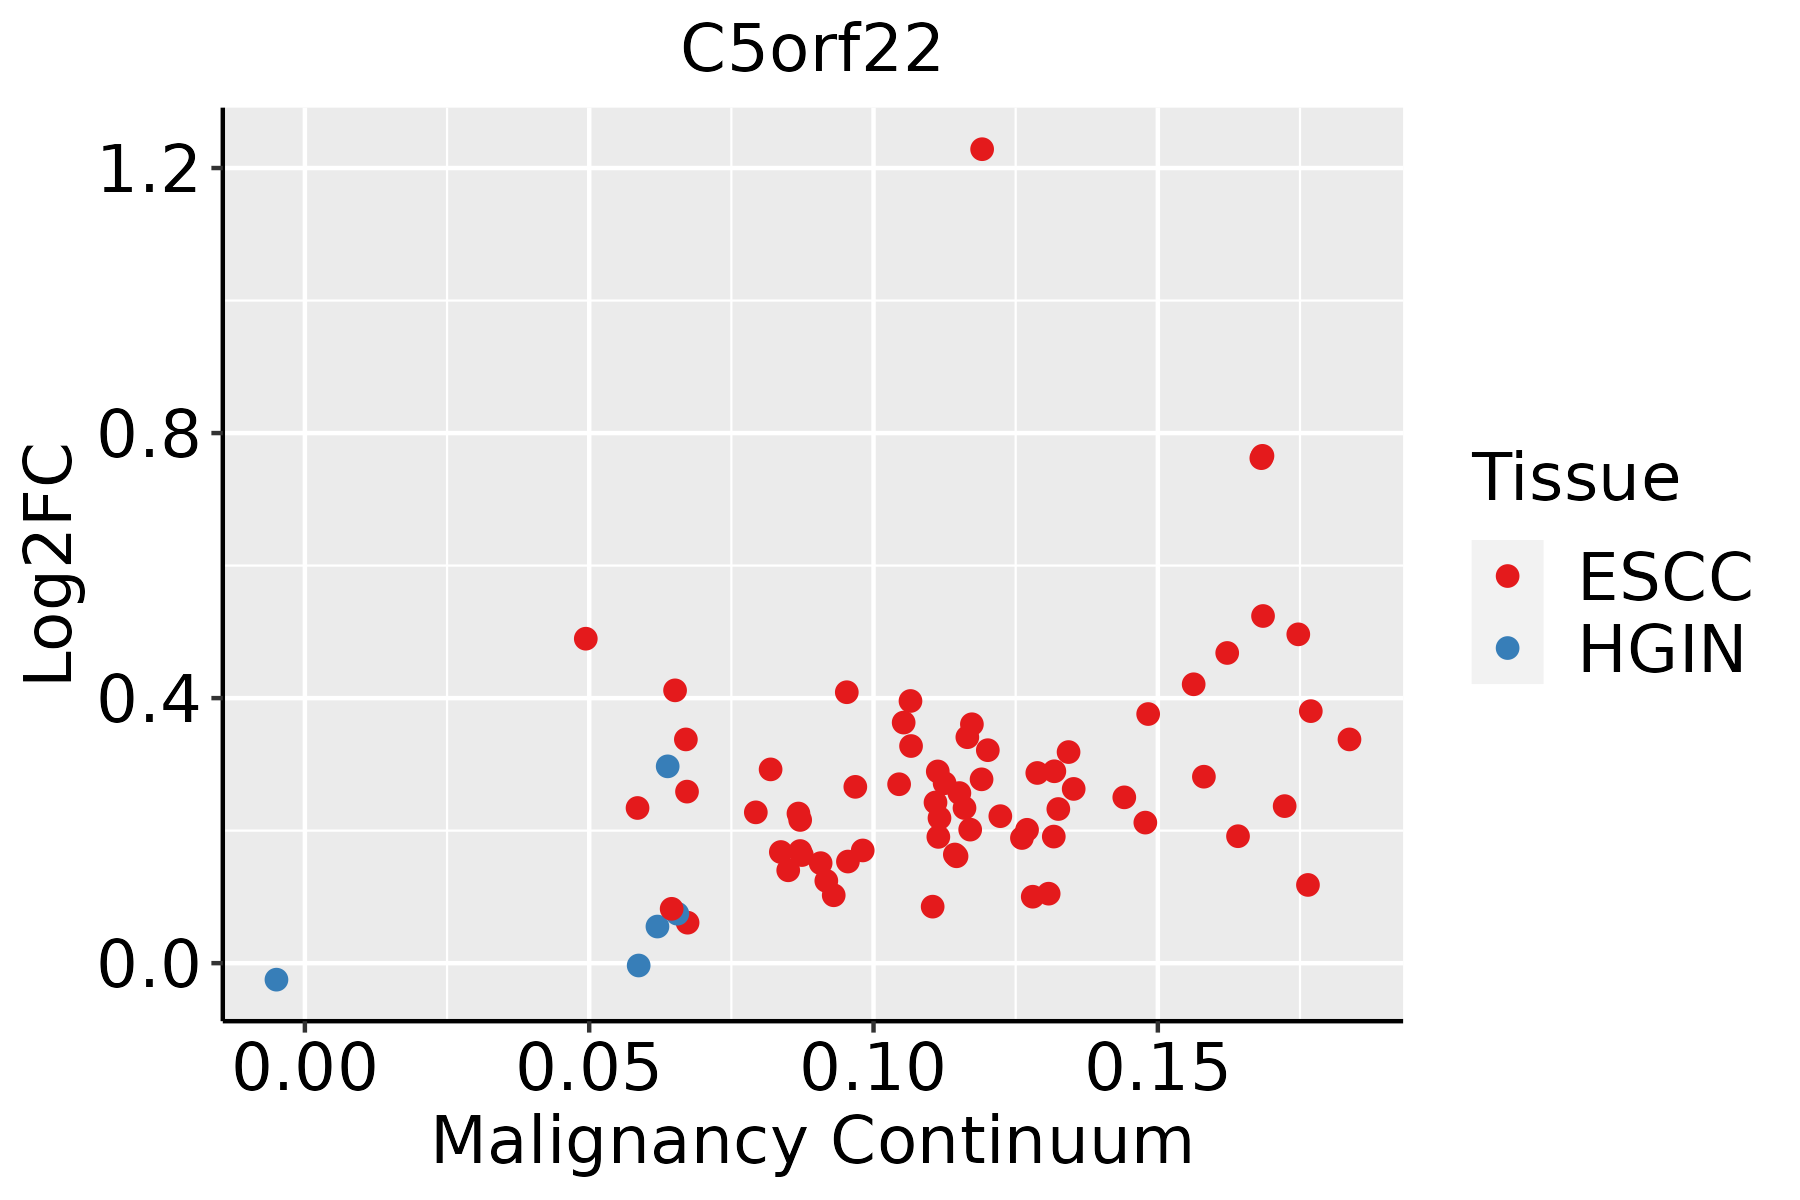 | ESCC: Esophageal squamous cell carcinoma |
| HGIN: High-grade intraepithelial neoplasias | ||
| LGIN: Low-grade intraepithelial neoplasias | ||
| Liver | 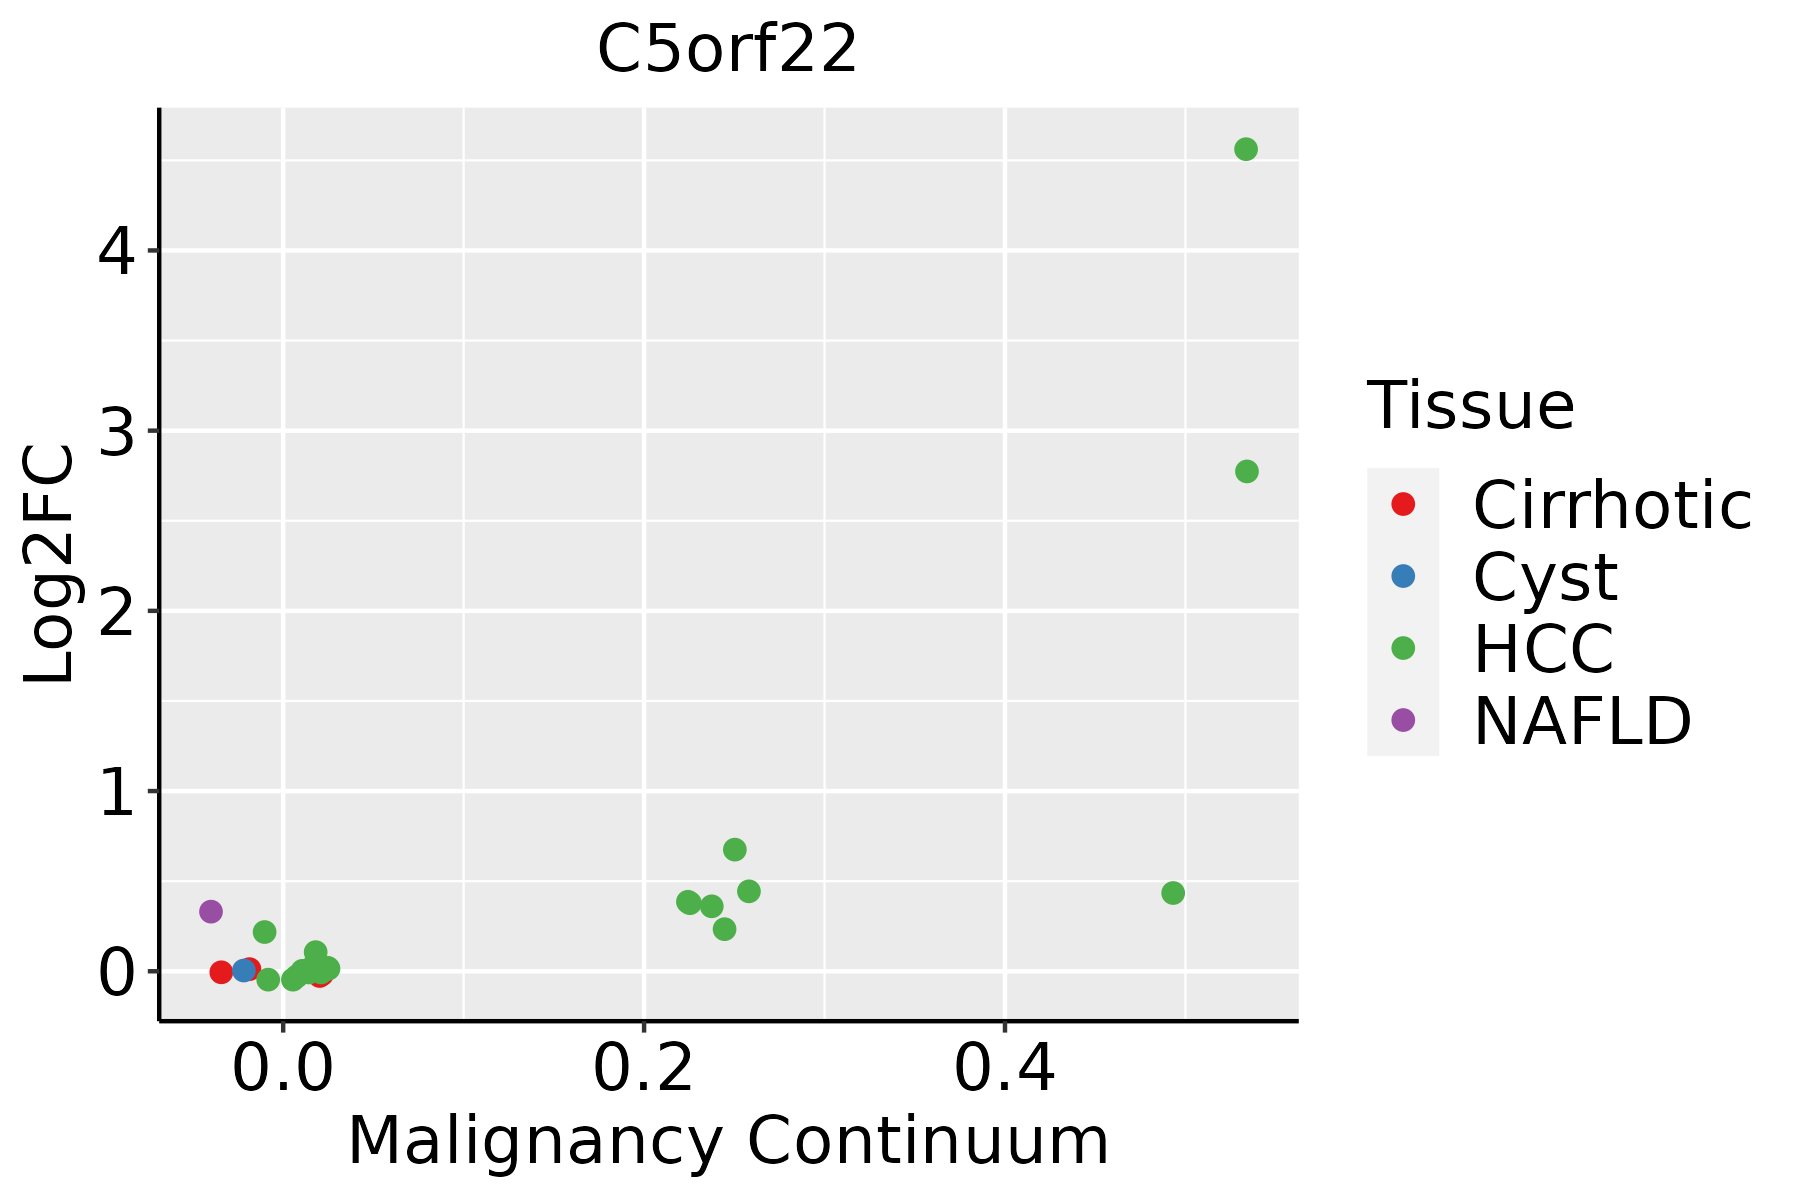 | HCC: Hepatocellular carcinoma |
| NAFLD: Non-alcoholic fatty liver disease |
| ∗log2FC in expression of this searched gene in stem-like cells from each diseased tissue sample relative to stem-like cells in normal samples in each tissue plotted against the malignancy continuum. Samples are colored based on if they are from different disease stage. |
Top |
Malignant transformation related pathway analysis |
| Find out the enriched GO biological processes and KEGG pathways involved in transition from healthy to precancer to cancer |
| Tissue | Disease Stage | Enriched GO biological Processes |
| Colorectum | AD |  |
| Colorectum | SER |  |
| Colorectum | MSS |  |
| Colorectum | MSI-H |  |
| Colorectum | FAP |  |
| ∗Top 15 enriched GO BP terms are showed in the bar plot of each disease state in each tissue. Each row represents a significant GO biological process which is colored according to the -log10(p.adjust). |
| Page: 1 2 3 4 5 6 7 8 9 |
| GO ID | Tissue | Disease Stage | Description | Gene Ratio | Bg Ratio | pvalue | p.adjust | Count |
| Page: 1 |
| Pathway ID | Tissue | Disease Stage | Description | Gene Ratio | Bg Ratio | pvalue | p.adjust | qvalue | Count |
| Page: 1 |
Top |
Cell-cell communication analysis |
| Identification of potential cell-cell interactions between two cell types and their ligand-receptor pairs for different disease states |
| Ligand | Receptor | LRpair | Pathway | Tissue | Disease Stage |
| Page: 1 |
Top |
Single-cell gene regulatory network inference analysis |
| Find out the significant the regulons (TFs) and the target genes of each regulon across cell types for different disease states |
| TF | Cell Type | Tissue | Disease Stage | Target Gene | RSS | Regulon Activity |
| ∗The dot plots of a searched regulon are shown for all cell subpopulations in each disease state of each tissue based on the regulon specific score inferred using pySCENIC and by calculating the average expression. |
| Page: 1 |
Top |
Somatic mutation of malignant transformation related genes |
| Annotation of somatic variants for genes involved in malignant transformation |
| Hugo Symbol | Variant Class | Variant Classification | dbSNP RS | HGVSc | HGVSp | HGVSp Short | SWISSPROT | BIOTYPE | SIFT | PolyPhen | Tumor Sample Barcode | Tissue | Histology | Sex | Age | Stage | Therapy Types | Drugs | Outcome |
| C5orf22 | SNV | Missense_Mutation | c.208N>C | p.Asp70His | p.D70H | Q49AR2 | protein_coding | deleterious(0) | probably_damaging(0.997) | TCGA-FU-A3HY-01 | Cervix | cervical & endocervical cancer | Female | <65 | I/II | Chemotherapy | cisplatin | CR | |
| C5orf22 | SNV | Missense_Mutation | rs147146477 | c.1246N>G | p.Gln416Glu | p.Q416E | Q49AR2 | protein_coding | deleterious(0) | probably_damaging(0.991) | TCGA-IR-A3LK-01 | Cervix | cervical & endocervical cancer | Female | >=65 | I/II | Chemotherapy | cisplatin | PD |
| C5orf22 | SNV | Missense_Mutation | c.1147G>A | p.Val383Met | p.V383M | Q49AR2 | protein_coding | tolerated(0.19) | benign(0.084) | TCGA-A6-5661-01 | Colorectum | colon adenocarcinoma | Female | >=65 | I/II | Unknown | Unknown | SD | |
| C5orf22 | SNV | Missense_Mutation | rs780737764 | c.289N>G | p.Ile97Val | p.I97V | Q49AR2 | protein_coding | tolerated(0.95) | benign(0.001) | TCGA-AA-3672-01 | Colorectum | colon adenocarcinoma | Female | >=65 | III/IV | Unknown | Unknown | SD |
| C5orf22 | SNV | Missense_Mutation | rs760715623 | c.965C>T | p.Thr322Met | p.T322M | Q49AR2 | protein_coding | deleterious(0.03) | benign(0.202) | TCGA-AD-A5EJ-01 | Colorectum | colon adenocarcinoma | Female | >=65 | I/II | Unknown | Unknown | SD |
| C5orf22 | SNV | Missense_Mutation | c.457C>A | p.Gln153Lys | p.Q153K | Q49AR2 | protein_coding | tolerated(0.44) | benign(0.015) | TCGA-D5-6932-01 | Colorectum | colon adenocarcinoma | Male | >=65 | I/II | Unknown | Unknown | SD | |
| C5orf22 | SNV | Missense_Mutation | c.137T>C | p.Val46Ala | p.V46A | Q49AR2 | protein_coding | deleterious(0.05) | benign(0.01) | TCGA-F4-6805-01 | Colorectum | colon adenocarcinoma | Female | <65 | I/II | Chemotherapy | xeloda | CR | |
| C5orf22 | SNV | Missense_Mutation | rs755393777 | c.560N>T | p.Ser187Leu | p.S187L | Q49AR2 | protein_coding | tolerated(0.23) | benign(0.001) | TCGA-EI-6917-01 | Colorectum | rectum adenocarcinoma | Male | <65 | III/IV | Chemotherapy | 5fluorouracil+oxaciplatina+l-folinian | SD |
| C5orf22 | SNV | Missense_Mutation | c.103N>A | p.Ala35Thr | p.A35T | Q49AR2 | protein_coding | deleterious(0) | probably_damaging(0.971) | TCGA-A5-A0G2-01 | Endometrium | uterine corpus endometrioid carcinoma | Female | <65 | III/IV | Unknown | Unknown | SD | |
| C5orf22 | SNV | Missense_Mutation | novel | c.1325N>A | p.Ser442Tyr | p.S442Y | Q49AR2 | protein_coding | deleterious_low_confidence(0) | benign(0.094) | TCGA-A5-A0G2-01 | Endometrium | uterine corpus endometrioid carcinoma | Female | <65 | III/IV | Unknown | Unknown | SD |
| Page: 1 2 3 4 5 |
Top |
Related drugs of malignant transformation related genes |
| Identification of chemicals and drugs interact with genes involved in malignant transfromation |
| (DGIdb 4.0) |
| Entrez ID | Symbol | Category | Interaction Types | Drug Claim Name | Drug Name | PMIDs |
| Page: 1 |

Copyright 2023-Present -The University of Texas Health Science Center at Houston |