
|
|||||
|
 | |
| |
| |
| |
| |
| |
|
Gene: C4orf47 |
Gene summary for C4ORF47 |
| Gene information | Species | Human | Gene symbol | C4orf47 | Gene ID | 441054 |
| Gene name | chromosome 4 open reading frame 47 | |
| Gene Alias | C4orf47 | |
| Cytomap | 4q35.1 | |
| Gene Type | protein-coding | GO ID | GO:0005575 | UniProtAcc | A7E2U8 |
Top |
Malignant transformation analysis |
| Identification of the aberrant gene expression in precancerous and cancerous lesions by comparing the gene expression of stem-like cells in diseased tissues with normal stem cells |
| Entrez ID | Symbol | Replicates | Species | Organ | Tissue | Adj P-value | Log2FC | Malignancy |
| 441054 | C4orf47 | LZE4T | Human | Esophagus | ESCC | 2.37e-02 | 1.33e-01 | 0.0811 |
| 441054 | C4orf47 | LZE24T | Human | Esophagus | ESCC | 2.20e-04 | 1.69e-01 | 0.0596 |
| 441054 | C4orf47 | LZE22D3 | Human | Esophagus | HGIN | 1.73e-02 | 3.54e-01 | 0.0653 |
| 441054 | C4orf47 | P1T-E | Human | Esophagus | ESCC | 4.62e-03 | 2.32e-01 | 0.0875 |
| 441054 | C4orf47 | P4T-E | Human | Esophagus | ESCC | 5.16e-10 | 2.39e-01 | 0.1323 |
| 441054 | C4orf47 | P5T-E | Human | Esophagus | ESCC | 1.75e-25 | 4.91e-01 | 0.1327 |
| 441054 | C4orf47 | P10T-E | Human | Esophagus | ESCC | 4.30e-10 | 1.96e-01 | 0.116 |
| 441054 | C4orf47 | P16T-E | Human | Esophagus | ESCC | 8.40e-04 | 1.31e-01 | 0.1153 |
| 441054 | C4orf47 | P23T-E | Human | Esophagus | ESCC | 6.93e-10 | 2.68e-01 | 0.108 |
| 441054 | C4orf47 | P24T-E | Human | Esophagus | ESCC | 3.50e-02 | 8.66e-02 | 0.1287 |
| 441054 | C4orf47 | P26T-E | Human | Esophagus | ESCC | 7.31e-14 | 2.97e-01 | 0.1276 |
| 441054 | C4orf47 | P31T-E | Human | Esophagus | ESCC | 1.78e-03 | 9.17e-02 | 0.1251 |
| 441054 | C4orf47 | P32T-E | Human | Esophagus | ESCC | 7.90e-03 | 1.02e-01 | 0.1666 |
| 441054 | C4orf47 | P37T-E | Human | Esophagus | ESCC | 3.34e-07 | 1.65e-01 | 0.1371 |
| 441054 | C4orf47 | P47T-E | Human | Esophagus | ESCC | 3.75e-03 | 1.11e-01 | 0.1067 |
| 441054 | C4orf47 | P49T-E | Human | Esophagus | ESCC | 5.57e-05 | 3.36e-01 | 0.1768 |
| 441054 | C4orf47 | P52T-E | Human | Esophagus | ESCC | 1.88e-04 | 1.18e-01 | 0.1555 |
| 441054 | C4orf47 | P54T-E | Human | Esophagus | ESCC | 3.18e-08 | 2.40e-01 | 0.0975 |
| 441054 | C4orf47 | P56T-E | Human | Esophagus | ESCC | 2.17e-07 | 5.21e-01 | 0.1613 |
| 441054 | C4orf47 | P57T-E | Human | Esophagus | ESCC | 3.75e-03 | 1.02e-01 | 0.0926 |
| Page: 1 2 |
| Tissue | Expression Dynamics | Abbreviation |
| Esophagus | 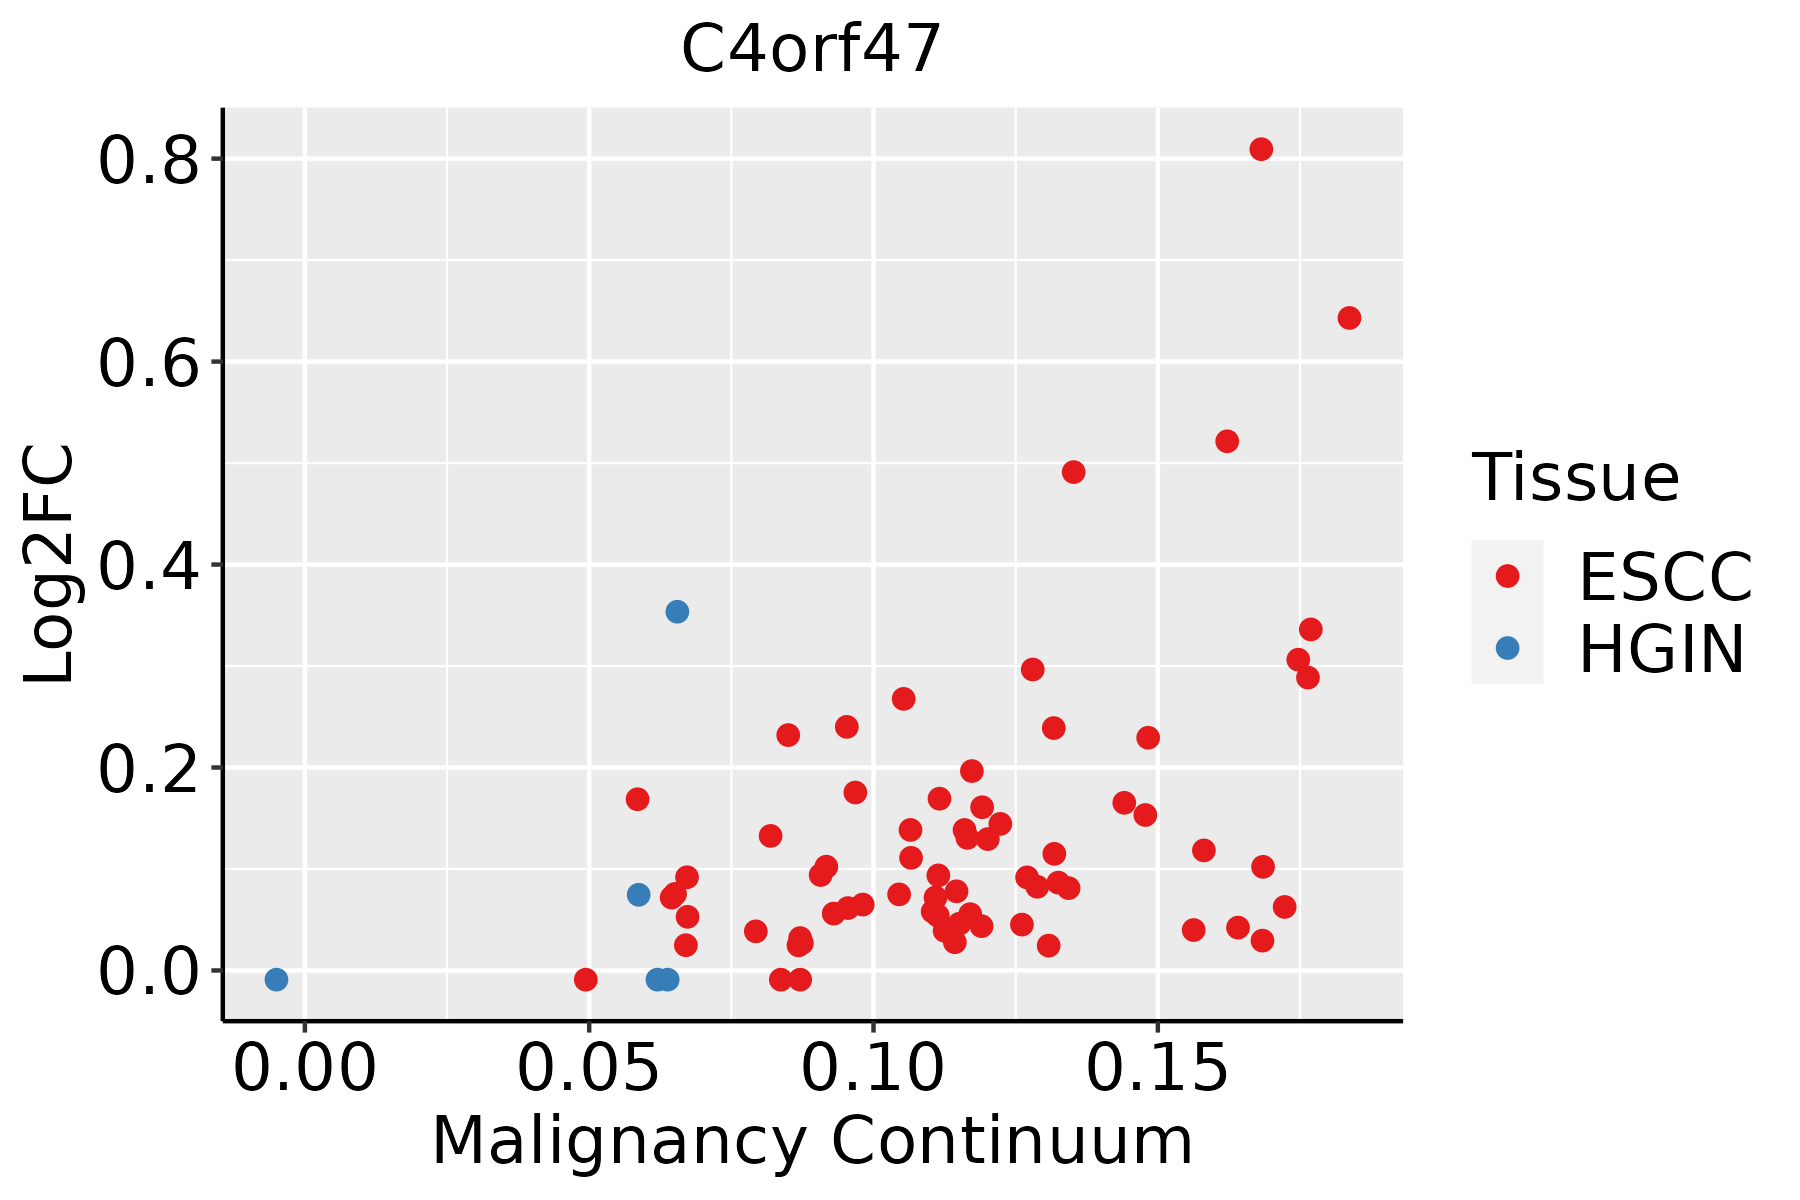 | ESCC: Esophageal squamous cell carcinoma |
| HGIN: High-grade intraepithelial neoplasias | ||
| LGIN: Low-grade intraepithelial neoplasias | ||
| Lung |  | AAH: Atypical adenomatous hyperplasia |
| AIS: Adenocarcinoma in situ | ||
| IAC: Invasive lung adenocarcinoma | ||
| MIA: Minimally invasive adenocarcinoma |
| ∗log2FC in expression of this searched gene in stem-like cells from each diseased tissue sample relative to stem-like cells in normal samples in each tissue plotted against the malignancy continuum. Samples are colored based on if they are from different disease stage. |
Top |
Malignant transformation related pathway analysis |
| Find out the enriched GO biological processes and KEGG pathways involved in transition from healthy to precancer to cancer |
| Tissue | Disease Stage | Enriched GO biological Processes |
| Colorectum | AD |  |
| Colorectum | SER |  |
| Colorectum | MSS |  |
| Colorectum | MSI-H |  |
| Colorectum | FAP |  |
| ∗Top 15 enriched GO BP terms are showed in the bar plot of each disease state in each tissue. Each row represents a significant GO biological process which is colored according to the -log10(p.adjust). |
| Page: 1 2 3 4 5 6 7 8 9 |
| GO ID | Tissue | Disease Stage | Description | Gene Ratio | Bg Ratio | pvalue | p.adjust | Count |
| Page: 1 |
| Pathway ID | Tissue | Disease Stage | Description | Gene Ratio | Bg Ratio | pvalue | p.adjust | qvalue | Count |
| Page: 1 |
Top |
Cell-cell communication analysis |
| Identification of potential cell-cell interactions between two cell types and their ligand-receptor pairs for different disease states |
| Ligand | Receptor | LRpair | Pathway | Tissue | Disease Stage |
| Page: 1 |
Top |
Single-cell gene regulatory network inference analysis |
| Find out the significant the regulons (TFs) and the target genes of each regulon across cell types for different disease states |
| TF | Cell Type | Tissue | Disease Stage | Target Gene | RSS | Regulon Activity |
| ∗The dot plots of a searched regulon are shown for all cell subpopulations in each disease state of each tissue based on the regulon specific score inferred using pySCENIC and by calculating the average expression. |
| Page: 1 |
Top |
Somatic mutation of malignant transformation related genes |
| Annotation of somatic variants for genes involved in malignant transformation |
| Hugo Symbol | Variant Class | Variant Classification | dbSNP RS | HGVSc | HGVSp | HGVSp Short | SWISSPROT | BIOTYPE | SIFT | PolyPhen | Tumor Sample Barcode | Tissue | Histology | Sex | Age | Stage | Therapy Types | Drugs | Outcome |
| C4orf47 | SNV | Missense_Mutation | novel | c.923N>G | p.Ser308Cys | p.S308C | A7E2U8 | protein_coding | deleterious(0.01) | possibly_damaging(0.847) | TCGA-C8-A12T-01 | Breast | breast invasive carcinoma | Female | <65 | I/II | Unknown | Unknown | SD |
| C4orf47 | SNV | Missense_Mutation | c.896A>G | p.Lys299Arg | p.K299R | A7E2U8 | protein_coding | tolerated(0.21) | benign(0.021) | TCGA-E9-A1R2-01 | Breast | breast invasive carcinoma | Female | <65 | III/IV | Chemotherapy | taxotere | CR | |
| C4orf47 | SNV | Missense_Mutation | rs61745989 | c.376N>A | p.Ala126Thr | p.A126T | A7E2U8 | protein_coding | deleterious(0.02) | possibly_damaging(0.505) | TCGA-AA-3972-01 | Colorectum | colon adenocarcinoma | Male | >=65 | III/IV | Chemotherapy | capecitabine | PD |
| C4orf47 | SNV | Missense_Mutation | c.189T>A | p.Asp63Glu | p.D63E | A7E2U8 | protein_coding | tolerated(0.48) | benign(0.019) | TCGA-F4-6856-01 | Colorectum | colon adenocarcinoma | Male | <65 | I/II | Ancillary | leucovorin | CR | |
| C4orf47 | SNV | Missense_Mutation | novel | c.223T>C | p.Tyr75His | p.Y75H | A7E2U8 | protein_coding | deleterious(0.05) | benign(0.275) | TCGA-F5-6814-01 | Colorectum | rectum adenocarcinoma | Male | <65 | I/II | Unknown | Unknown | SD |
| C4orf47 | insertion | In_Frame_Ins | novel | c.317_318insTAACCT | p.Lys106delinsAsnAsnLeu | p.K106delinsNNL | A7E2U8 | protein_coding | TCGA-AM-5820-01 | Colorectum | colon adenocarcinoma | Female | <65 | I/II | Unknown | Unknown | SD | ||
| C4orf47 | SNV | Missense_Mutation | rs752707291 | c.8N>T | p.Ala3Val | p.A3V | A7E2U8 | protein_coding | tolerated_low_confidence(0.28) | benign(0.001) | TCGA-A5-A2K5-01 | Endometrium | uterine corpus endometrioid carcinoma | Female | >=65 | I/II | Unknown | Unknown | SD |
| C4orf47 | SNV | Missense_Mutation | novel | c.872N>C | p.Asn291Thr | p.N291T | A7E2U8 | protein_coding | deleterious(0) | possibly_damaging(0.814) | TCGA-AJ-A3EK-01 | Endometrium | uterine corpus endometrioid carcinoma | Female | <65 | I/II | Chemotherapy | carboplatin | CR |
| C4orf47 | SNV | Missense_Mutation | c.539N>T | p.Ala180Val | p.A180V | A7E2U8 | protein_coding | tolerated(0.08) | benign(0.03) | TCGA-AP-A0LM-01 | Endometrium | uterine corpus endometrioid carcinoma | Female | <65 | III/IV | Chemotherapy | cisplatin | SD | |
| C4orf47 | SNV | Missense_Mutation | novel | c.40N>T | p.Gly14Cys | p.G14C | A7E2U8 | protein_coding | deleterious(0) | probably_damaging(1) | TCGA-AP-A1DK-01 | Endometrium | uterine corpus endometrioid carcinoma | Female | <65 | I/II | Unknown | Unknown | SD |
| Page: 1 2 |
Top |
Related drugs of malignant transformation related genes |
| Identification of chemicals and drugs interact with genes involved in malignant transfromation |
| (DGIdb 4.0) |
| Entrez ID | Symbol | Category | Interaction Types | Drug Claim Name | Drug Name | PMIDs |
| Page: 1 |

Copyright 2023-Present -The University of Texas Health Science Center at Houston |