
|
|||||
|
 | |
| |
| |
| |
| |
| |
|
Gene: C4orf19 |
Gene summary for C4ORF19 |
| Gene information | Species | Human | Gene symbol | C4orf19 | Gene ID | 55286 |
| Gene name | chromosome 4 open reading frame 19 | |
| Gene Alias | C4orf19 | |
| Cytomap | 4p14 | |
| Gene Type | protein-coding | GO ID | GO:0005575 | UniProtAcc | A0A024R9R1 |
Top |
Malignant transformation analysis |
| Identification of the aberrant gene expression in precancerous and cancerous lesions by comparing the gene expression of stem-like cells in diseased tissues with normal stem cells |
| Entrez ID | Symbol | Replicates | Species | Organ | Tissue | Adj P-value | Log2FC | Malignancy |
| 55286 | C4orf19 | HTA11_3410_2000001011 | Human | Colorectum | AD | 1.44e-25 | -7.16e-01 | 0.0155 |
| 55286 | C4orf19 | HTA11_2951_2000001011 | Human | Colorectum | AD | 4.51e-02 | -6.77e-01 | 0.0216 |
| 55286 | C4orf19 | HTA11_347_2000001011 | Human | Colorectum | AD | 1.98e-04 | 4.95e-01 | -0.1954 |
| 55286 | C4orf19 | HTA11_3361_2000001011 | Human | Colorectum | AD | 7.70e-06 | -5.86e-01 | -0.1207 |
| 55286 | C4orf19 | HTA11_9341_2000001011 | Human | Colorectum | SER | 4.24e-02 | -5.82e-01 | -0.00410000000000005 |
| 55286 | C4orf19 | HTA11_866_3004761011 | Human | Colorectum | AD | 5.91e-12 | -5.80e-01 | 0.096 |
| 55286 | C4orf19 | HTA11_8622_2000001021 | Human | Colorectum | SER | 7.67e-04 | -6.20e-01 | 0.0528 |
| 55286 | C4orf19 | HTA11_10711_2000001011 | Human | Colorectum | AD | 1.20e-06 | -5.09e-01 | 0.0338 |
| 55286 | C4orf19 | HTA11_7696_3000711011 | Human | Colorectum | AD | 4.15e-10 | -5.38e-01 | 0.0674 |
| 55286 | C4orf19 | HTA11_99999970781_79442 | Human | Colorectum | MSS | 4.50e-26 | -6.83e-01 | 0.294 |
| 55286 | C4orf19 | HTA11_99999971662_82457 | Human | Colorectum | MSS | 3.63e-18 | -6.26e-01 | 0.3859 |
| 55286 | C4orf19 | HTA11_99999973899_84307 | Human | Colorectum | MSS | 4.41e-12 | -8.30e-01 | 0.2585 |
| 55286 | C4orf19 | HTA11_99999974143_84620 | Human | Colorectum | MSS | 1.32e-36 | -8.89e-01 | 0.3005 |
| 55286 | C4orf19 | F007 | Human | Colorectum | FAP | 8.48e-04 | -3.24e-01 | 0.1176 |
| 55286 | C4orf19 | A001-C-207 | Human | Colorectum | FAP | 1.35e-09 | -4.36e-01 | 0.1278 |
| 55286 | C4orf19 | A015-C-203 | Human | Colorectum | FAP | 8.75e-30 | -3.84e-01 | -0.1294 |
| 55286 | C4orf19 | A015-C-204 | Human | Colorectum | FAP | 3.40e-12 | -5.05e-01 | -0.0228 |
| 55286 | C4orf19 | A014-C-040 | Human | Colorectum | FAP | 5.25e-06 | -2.81e-01 | -0.1184 |
| 55286 | C4orf19 | A002-C-201 | Human | Colorectum | FAP | 4.55e-20 | -4.76e-01 | 0.0324 |
| 55286 | C4orf19 | A002-C-203 | Human | Colorectum | FAP | 1.71e-02 | -1.94e-01 | 0.2786 |
| Page: 1 2 3 4 5 6 7 |
| Tissue | Expression Dynamics | Abbreviation |
| Colorectum (GSE201348) |  | FAP: Familial adenomatous polyposis |
| CRC: Colorectal cancer | ||
| Colorectum (HTA11) | 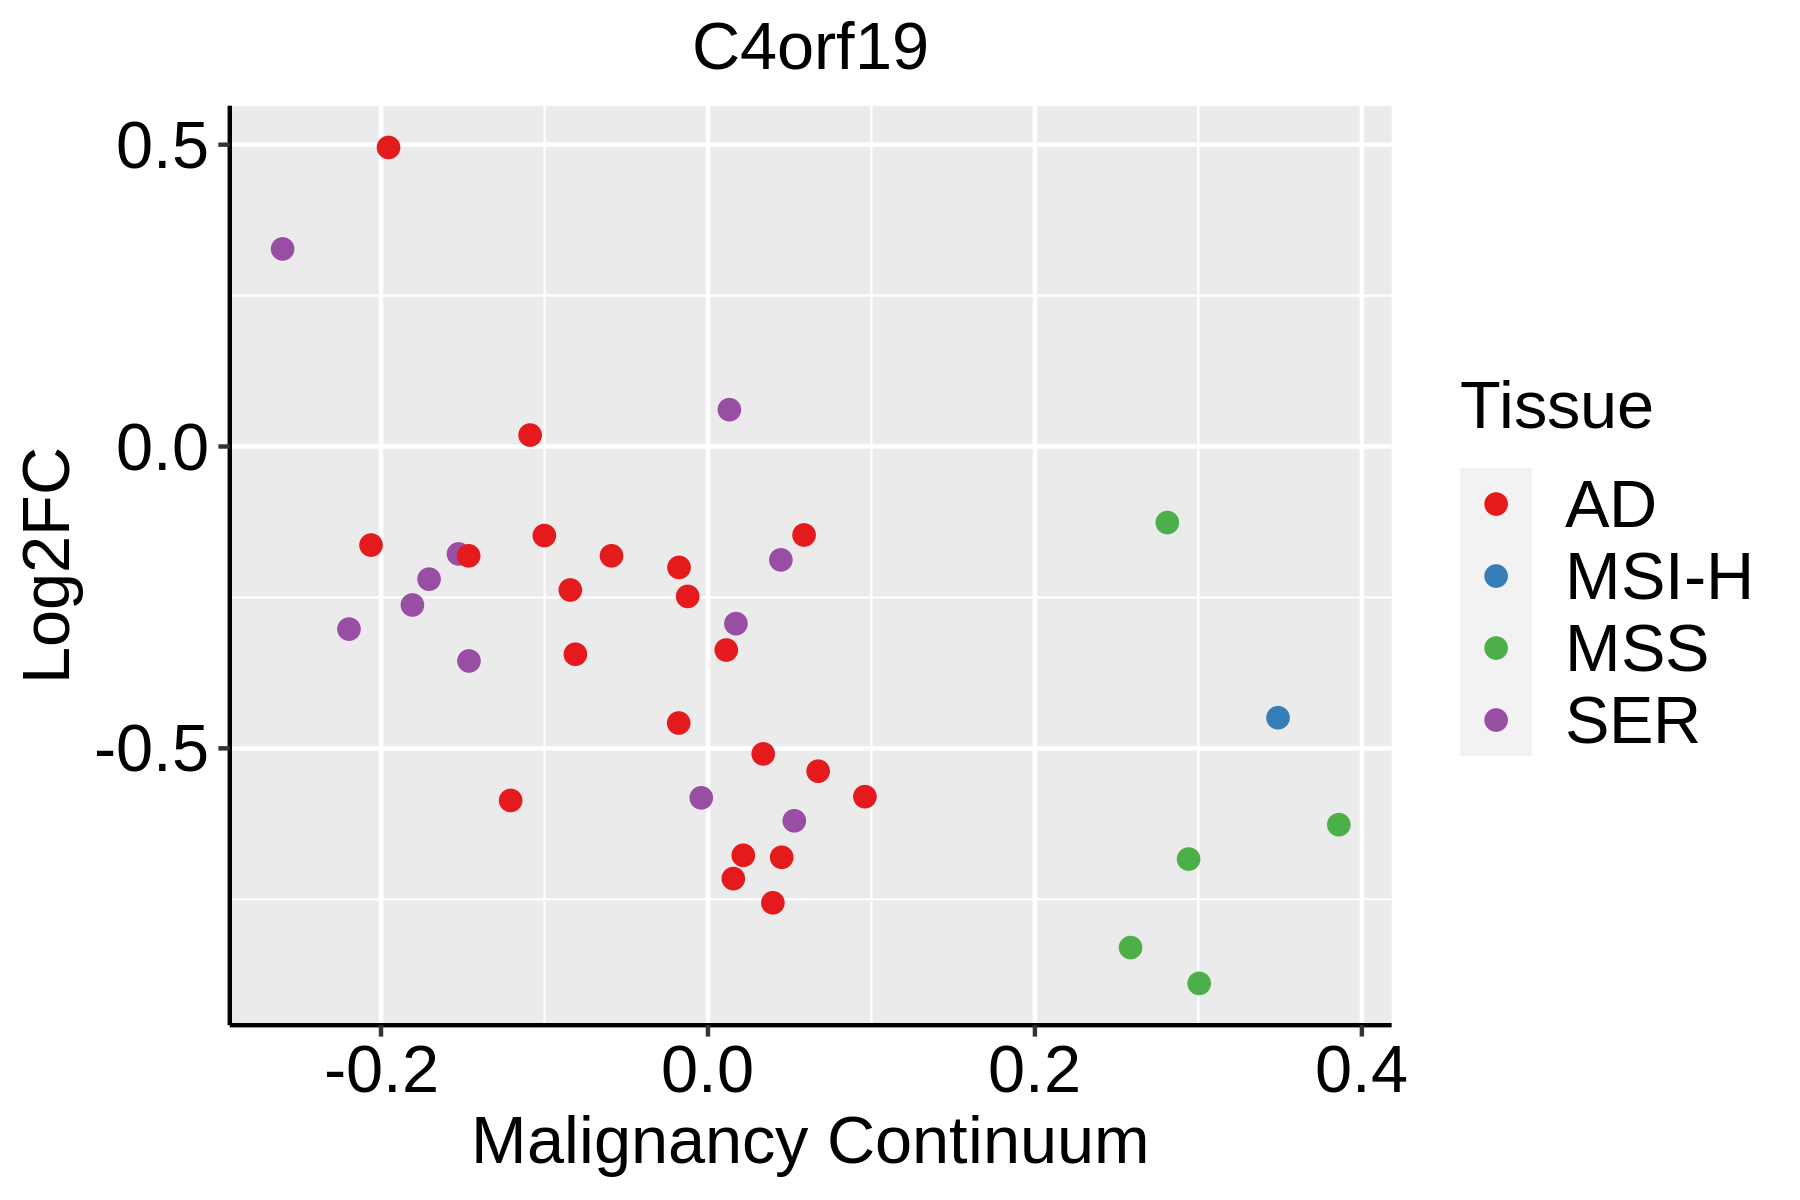 | AD: Adenomas |
| SER: Sessile serrated lesions | ||
| MSI-H: Microsatellite-high colorectal cancer | ||
| MSS: Microsatellite stable colorectal cancer | ||
| Endometrium | 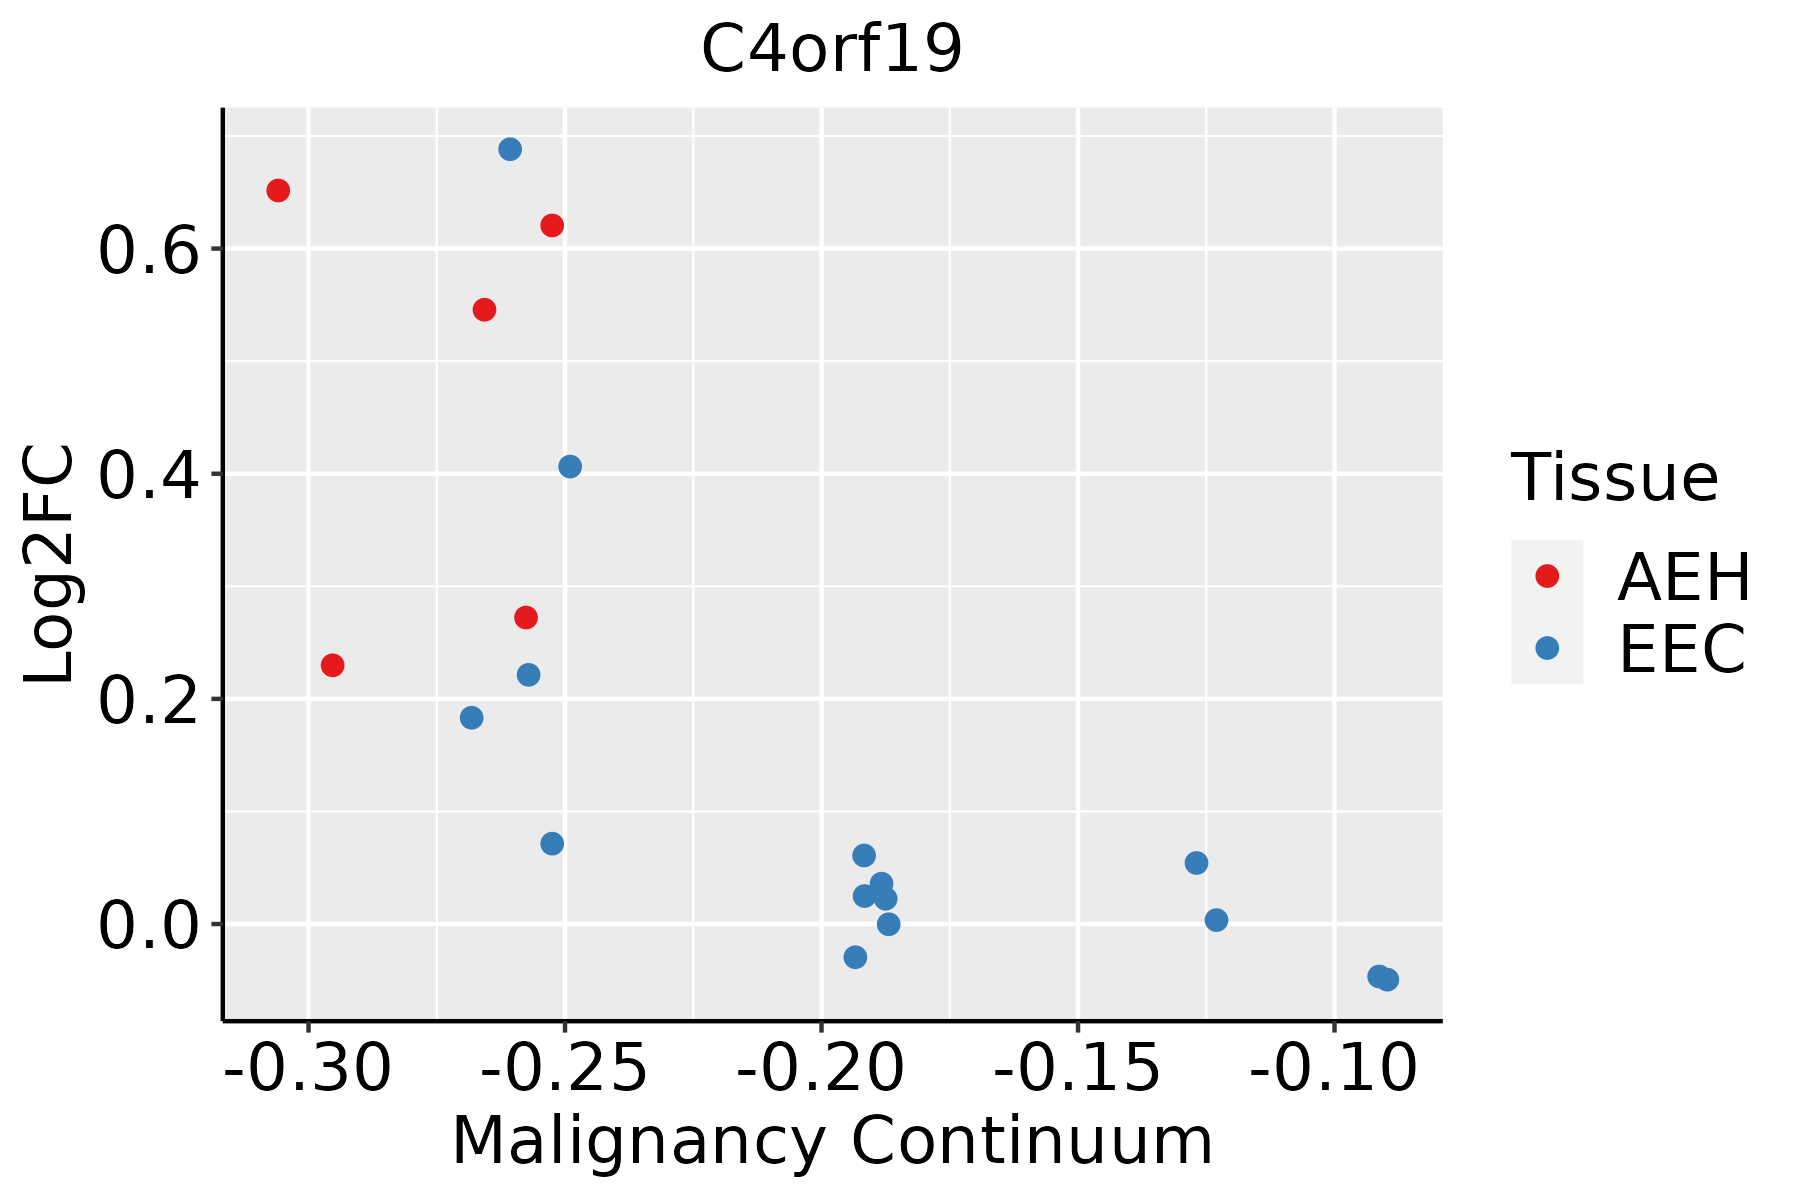 | AEH: Atypical endometrial hyperplasia |
| EEC: Endometrioid Cancer | ||
| Esophagus |  | ESCC: Esophageal squamous cell carcinoma |
| HGIN: High-grade intraepithelial neoplasias | ||
| LGIN: Low-grade intraepithelial neoplasias | ||
| GC |  | CAG: Chronic atrophic gastritis |
| CAG with IM: Chronic atrophic gastritis with intestinal metaplasia | ||
| CSG: Chronic superficial gastritis | ||
| GC: Gastric cancer | ||
| SIM: Severe intestinal metaplasia | ||
| WIM: Wild intestinal metaplasia | ||
| Liver | 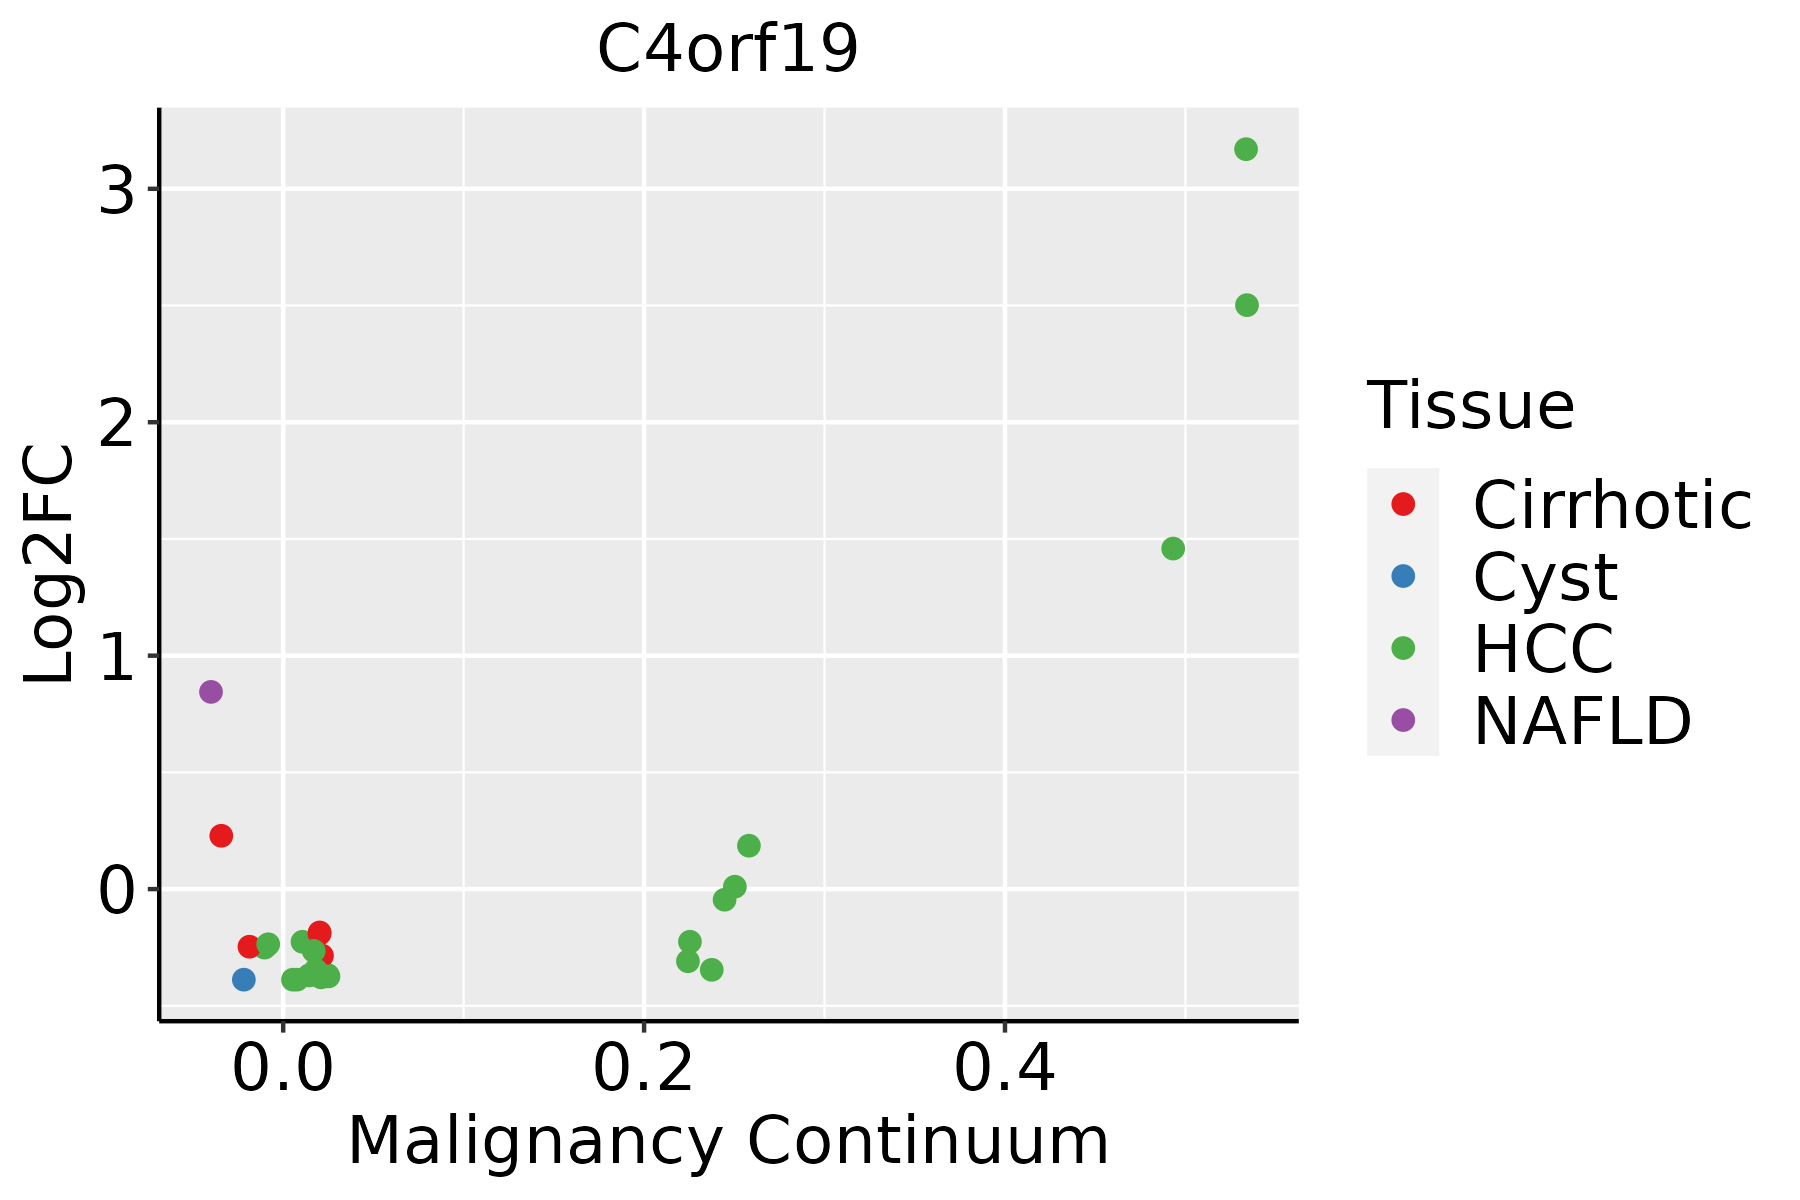 | HCC: Hepatocellular carcinoma |
| NAFLD: Non-alcoholic fatty liver disease | ||
| Lung | 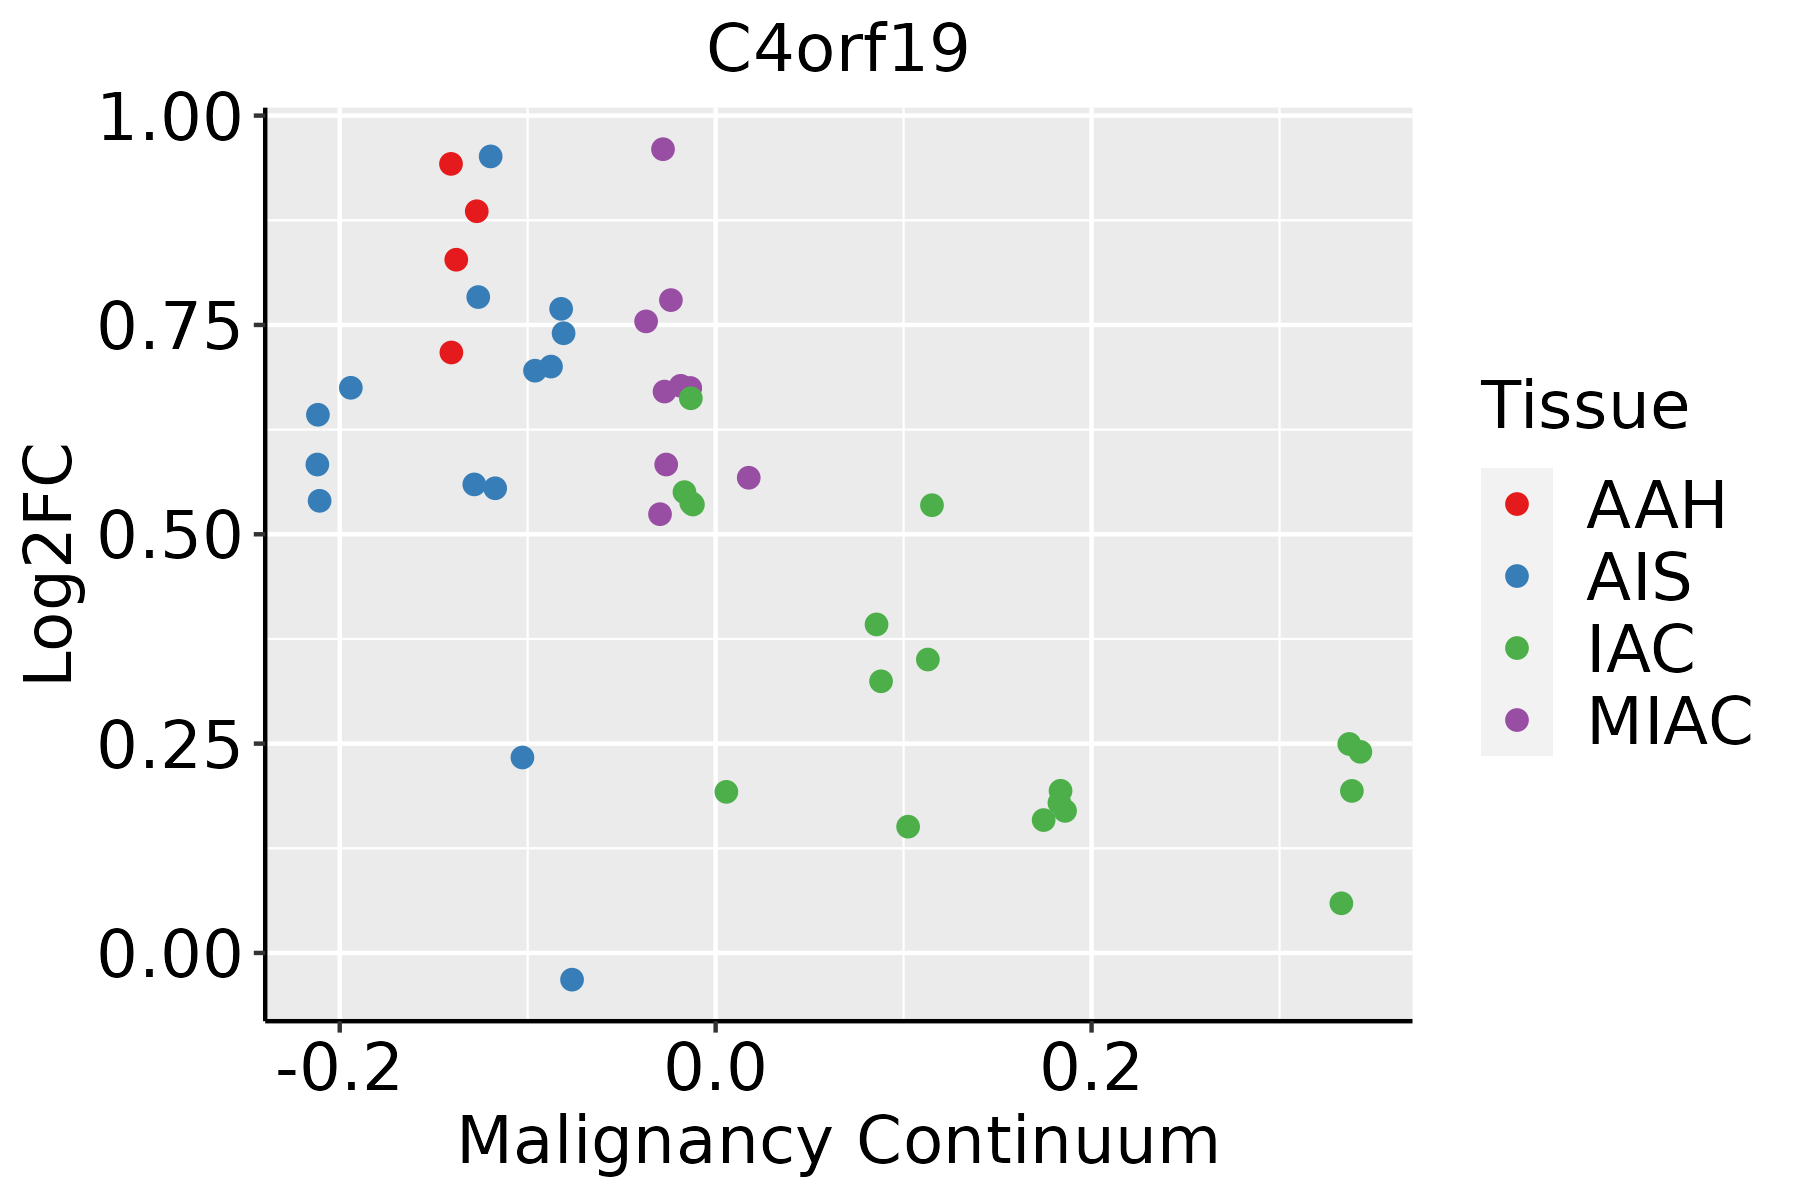 | AAH: Atypical adenomatous hyperplasia |
| AIS: Adenocarcinoma in situ | ||
| IAC: Invasive lung adenocarcinoma | ||
| MIA: Minimally invasive adenocarcinoma |
| ∗log2FC in expression of this searched gene in stem-like cells from each diseased tissue sample relative to stem-like cells in normal samples in each tissue plotted against the malignancy continuum. Samples are colored based on if they are from different disease stage. |
Top |
Malignant transformation related pathway analysis |
| Find out the enriched GO biological processes and KEGG pathways involved in transition from healthy to precancer to cancer |
| Tissue | Disease Stage | Enriched GO biological Processes |
| Colorectum | AD |  |
| Colorectum | SER |  |
| Colorectum | MSS |  |
| Colorectum | MSI-H |  |
| Colorectum | FAP |  |
| ∗Top 15 enriched GO BP terms are showed in the bar plot of each disease state in each tissue. Each row represents a significant GO biological process which is colored according to the -log10(p.adjust). |
| Page: 1 2 3 4 5 6 7 8 9 |
| GO ID | Tissue | Disease Stage | Description | Gene Ratio | Bg Ratio | pvalue | p.adjust | Count |
| Page: 1 |
| Pathway ID | Tissue | Disease Stage | Description | Gene Ratio | Bg Ratio | pvalue | p.adjust | qvalue | Count |
| Page: 1 |
Top |
Cell-cell communication analysis |
| Identification of potential cell-cell interactions between two cell types and their ligand-receptor pairs for different disease states |
| Ligand | Receptor | LRpair | Pathway | Tissue | Disease Stage |
| Page: 1 |
Top |
Single-cell gene regulatory network inference analysis |
| Find out the significant the regulons (TFs) and the target genes of each regulon across cell types for different disease states |
| TF | Cell Type | Tissue | Disease Stage | Target Gene | RSS | Regulon Activity |
| ∗The dot plots of a searched regulon are shown for all cell subpopulations in each disease state of each tissue based on the regulon specific score inferred using pySCENIC and by calculating the average expression. |
| Page: 1 |
Top |
Somatic mutation of malignant transformation related genes |
| Annotation of somatic variants for genes involved in malignant transformation |
| Hugo Symbol | Variant Class | Variant Classification | dbSNP RS | HGVSc | HGVSp | HGVSp Short | SWISSPROT | BIOTYPE | SIFT | PolyPhen | Tumor Sample Barcode | Tissue | Histology | Sex | Age | Stage | Therapy Types | Drugs | Outcome |
| C4orf19 | SNV | Missense_Mutation | c.103G>A | p.Glu35Lys | p.E35K | Q8IY42 | protein_coding | deleterious(0.01) | probably_damaging(0.984) | TCGA-A8-A093-01 | Breast | breast invasive carcinoma | Female | <65 | I/II | Hormone Therapy | tamoxiphen | SD | |
| C4orf19 | SNV | Missense_Mutation | c.470N>A | p.Val157Asp | p.V157D | Q8IY42 | protein_coding | deleterious(0.04) | benign(0.067) | TCGA-EK-A2PG-01 | Cervix | cervical & endocervical cancer | Female | >=65 | I/II | Unknown | Unknown | SD | |
| C4orf19 | SNV | Missense_Mutation | rs768318711 | c.687G>C | p.Leu229Phe | p.L229F | Q8IY42 | protein_coding | deleterious(0.02) | possibly_damaging(0.66) | TCGA-Q1-A73O-01 | Cervix | cervical & endocervical cancer | Female | <65 | I/II | Chemotherapy | cisplatin | CR |
| C4orf19 | SNV | Missense_Mutation | novel | c.538G>T | p.Val180Phe | p.V180F | Q8IY42 | protein_coding | tolerated(0.11) | possibly_damaging(0.79) | TCGA-AA-A02R-01 | Colorectum | colon adenocarcinoma | Female | >=65 | I/II | Unknown | Unknown | PD |
| C4orf19 | deletion | Frame_Shift_Del | c.391delN | p.Pro132GlnfsTer27 | p.P132Qfs*27 | Q8IY42 | protein_coding | TCGA-A6-6780-01 | Colorectum | colon adenocarcinoma | Male | >=65 | I/II | Unknown | Unknown | SD | |||
| C4orf19 | SNV | Missense_Mutation | novel | c.266C>A | p.Ala89Asp | p.A89D | Q8IY42 | protein_coding | tolerated(0.54) | benign(0.019) | TCGA-A5-A0G1-01 | Endometrium | uterine corpus endometrioid carcinoma | Female | >=65 | I/II | Unknown | Unknown | SD |
| C4orf19 | SNV | Missense_Mutation | novel | c.701N>A | p.Ser234Tyr | p.S234Y | Q8IY42 | protein_coding | deleterious(0.01) | possibly_damaging(0.838) | TCGA-A5-A1OF-01 | Endometrium | uterine corpus endometrioid carcinoma | Female | <65 | I/II | Unknown | Unknown | SD |
| C4orf19 | SNV | Missense_Mutation | novel | c.43N>T | p.Asp15Tyr | p.D15Y | Q8IY42 | protein_coding | deleterious(0) | probably_damaging(1) | TCGA-A5-A2K5-01 | Endometrium | uterine corpus endometrioid carcinoma | Female | >=65 | I/II | Unknown | Unknown | SD |
| C4orf19 | SNV | Missense_Mutation | rs777330778 | c.884N>T | p.Ala295Val | p.A295V | Q8IY42 | protein_coding | deleterious(0.03) | probably_damaging(1) | TCGA-AP-A056-01 | Endometrium | uterine corpus endometrioid carcinoma | Female | <65 | I/II | Unknown | Unknown | SD |
| C4orf19 | SNV | Missense_Mutation | rs768230851 | c.785N>G | p.His262Arg | p.H262R | Q8IY42 | protein_coding | tolerated(0.64) | benign(0.005) | TCGA-B5-A11Y-01 | Endometrium | uterine corpus endometrioid carcinoma | Female | <65 | I/II | Unknown | Unknown | SD |
| Page: 1 2 3 |
Top |
Related drugs of malignant transformation related genes |
| Identification of chemicals and drugs interact with genes involved in malignant transfromation |
| (DGIdb 4.0) |
| Entrez ID | Symbol | Category | Interaction Types | Drug Claim Name | Drug Name | PMIDs |
| Page: 1 |

Copyright 2023-Present -The University of Texas Health Science Center at Houston |