
|
|||||
|
 | |
| |
| |
| |
| |
| |
|
Gene: C4BPB |
Gene summary for C4BPB |
| Gene information | Species | Human | Gene symbol | C4BPB | Gene ID | 725 |
| Gene name | complement component 4 binding protein beta | |
| Gene Alias | C4BP | |
| Cytomap | 1q32.1 | |
| Gene Type | protein-coding | GO ID | GO:0002250 | UniProtAcc | P20851 |
Top |
Malignant transformation analysis |
| Identification of the aberrant gene expression in precancerous and cancerous lesions by comparing the gene expression of stem-like cells in diseased tissues with normal stem cells |
| Entrez ID | Symbol | Replicates | Species | Organ | Tissue | Adj P-value | Log2FC | Malignancy |
| 725 | C4BPB | NAFLD1 | Human | Liver | NAFLD | 5.50e-08 | 9.54e-01 | -0.04 |
| 725 | C4BPB | S43 | Human | Liver | Cirrhotic | 1.05e-14 | -3.91e-01 | -0.0187 |
| 725 | C4BPB | HCC1_Meng | Human | Liver | HCC | 1.06e-85 | 1.85e-01 | 0.0246 |
| 725 | C4BPB | HCC2_Meng | Human | Liver | HCC | 2.25e-14 | -3.79e-01 | 0.0107 |
| 725 | C4BPB | cirrhotic1 | Human | Liver | Cirrhotic | 4.22e-09 | -1.54e-01 | 0.0202 |
| 725 | C4BPB | cirrhotic2 | Human | Liver | Cirrhotic | 5.53e-08 | -1.90e-01 | 0.0201 |
| 725 | C4BPB | cirrhotic3 | Human | Liver | Cirrhotic | 4.75e-04 | -2.83e-01 | 0.0215 |
| 725 | C4BPB | HCC1 | Human | Liver | HCC | 1.71e-07 | 3.40e+00 | 0.5336 |
| 725 | C4BPB | HCC2 | Human | Liver | HCC | 7.69e-16 | 3.76e+00 | 0.5341 |
| 725 | C4BPB | Pt13.a | Human | Liver | HCC | 2.00e-13 | 3.59e-01 | 0.021 |
| 725 | C4BPB | Pt13.b | Human | Liver | HCC | 3.55e-30 | 2.74e-01 | 0.0251 |
| 725 | C4BPB | Pt14.b | Human | Liver | HCC | 1.06e-09 | 1.34e-01 | 0.018 |
| 725 | C4BPB | Pt14.d | Human | Liver | HCC | 2.78e-03 | 9.84e-02 | 0.0143 |
| 725 | C4BPB | S016 | Human | Liver | HCC | 3.40e-05 | -4.05e-01 | 0.2243 |
| 725 | C4BPB | S027 | Human | Liver | HCC | 3.16e-14 | 1.58e+00 | 0.2446 |
| 725 | C4BPB | S028 | Human | Liver | HCC | 6.19e-25 | 1.35e+00 | 0.2503 |
| 725 | C4BPB | S029 | Human | Liver | HCC | 4.26e-33 | 2.05e+00 | 0.2581 |
| Page: 1 |
| Tissue | Expression Dynamics | Abbreviation |
| Liver | 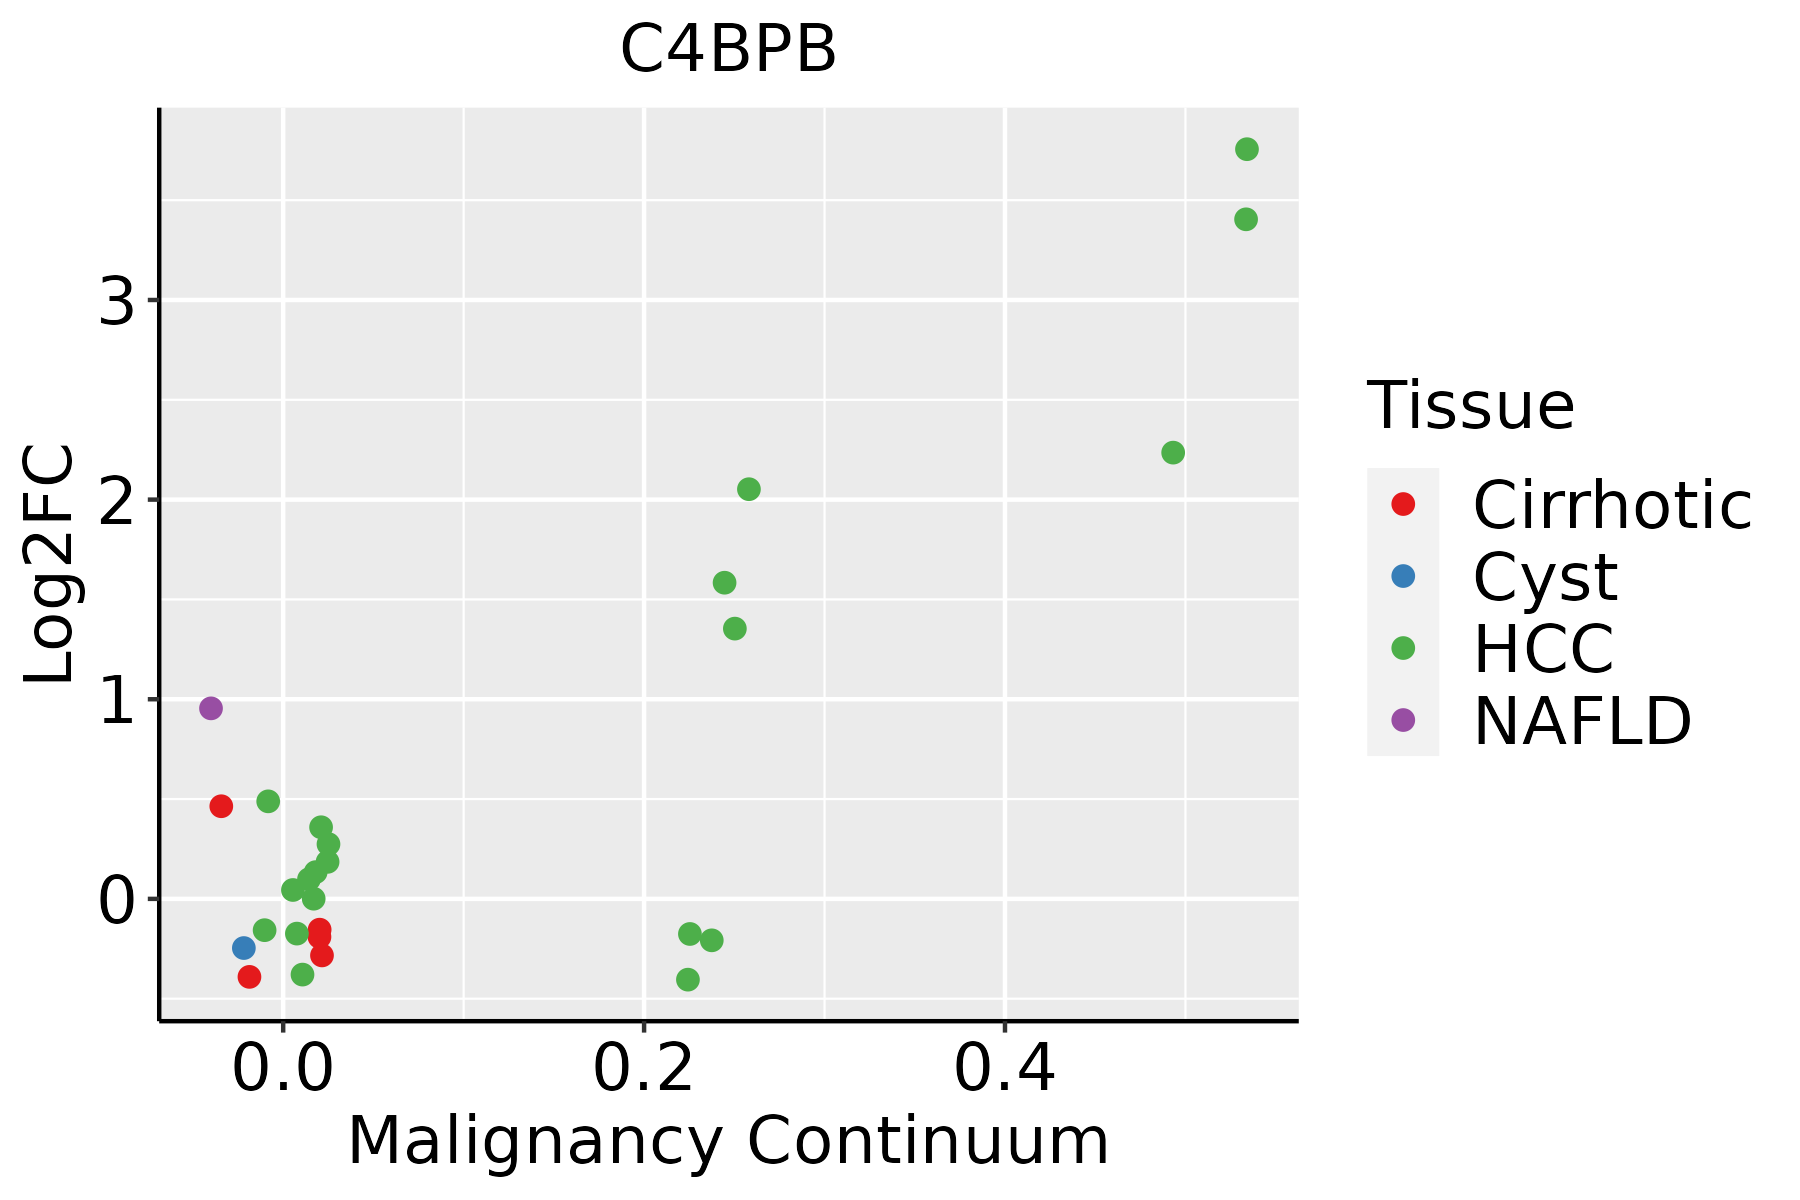 | HCC: Hepatocellular carcinoma |
| NAFLD: Non-alcoholic fatty liver disease |
| ∗log2FC in expression of this searched gene in stem-like cells from each diseased tissue sample relative to stem-like cells in normal samples in each tissue plotted against the malignancy continuum. Samples are colored based on if they are from different disease stage. |
Top |
Malignant transformation related pathway analysis |
| Find out the enriched GO biological processes and KEGG pathways involved in transition from healthy to precancer to cancer |
| Tissue | Disease Stage | Enriched GO biological Processes |
| Colorectum | AD |  |
| Colorectum | SER |  |
| Colorectum | MSS |  |
| Colorectum | MSI-H |  |
| Colorectum | FAP |  |
| ∗Top 15 enriched GO BP terms are showed in the bar plot of each disease state in each tissue. Each row represents a significant GO biological process which is colored according to the -log10(p.adjust). |
| Page: 1 2 3 4 5 6 7 8 9 |
| GO ID | Tissue | Disease Stage | Description | Gene Ratio | Bg Ratio | pvalue | p.adjust | Count |
| GO:00098967 | Liver | NAFLD | positive regulation of catabolic process | 108/1882 | 492/18723 | 2.68e-15 | 3.14e-12 | 108 |
| GO:00421767 | Liver | NAFLD | regulation of protein catabolic process | 83/1882 | 391/18723 | 2.94e-11 | 1.01e-08 | 83 |
| GO:00420607 | Liver | NAFLD | wound healing | 84/1882 | 422/18723 | 6.56e-10 | 1.37e-07 | 84 |
| GO:00075994 | Liver | NAFLD | hemostasis | 49/1882 | 222/18723 | 9.23e-08 | 7.59e-06 | 49 |
| GO:00075964 | Liver | NAFLD | blood coagulation | 48/1882 | 217/18723 | 1.16e-07 | 8.81e-06 | 48 |
| GO:00508174 | Liver | NAFLD | coagulation | 48/1882 | 222/18723 | 2.40e-07 | 1.61e-05 | 48 |
| GO:00457327 | Liver | NAFLD | positive regulation of protein catabolic process | 48/1882 | 231/18723 | 8.22e-07 | 4.45e-05 | 48 |
| GO:00508787 | Liver | NAFLD | regulation of body fluid levels | 60/1882 | 379/18723 | 2.61e-04 | 4.23e-03 | 60 |
| GO:0045916 | Liver | NAFLD | negative regulation of complement activation | 6/1882 | 12/18723 | 5.54e-04 | 7.46e-03 | 6 |
| GO:0030449 | Liver | NAFLD | regulation of complement activation | 8/1882 | 21/18723 | 6.29e-04 | 8.21e-03 | 8 |
| GO:0002921 | Liver | NAFLD | negative regulation of humoral immune response | 6/1882 | 16/18723 | 3.37e-03 | 2.93e-02 | 6 |
| GO:004217612 | Liver | Cirrhotic | regulation of protein catabolic process | 181/4634 | 391/18723 | 7.94e-21 | 2.77e-18 | 181 |
| GO:000989612 | Liver | Cirrhotic | positive regulation of catabolic process | 215/4634 | 492/18723 | 1.13e-20 | 3.56e-18 | 215 |
| GO:004573212 | Liver | Cirrhotic | positive regulation of protein catabolic process | 112/4634 | 231/18723 | 3.89e-15 | 4.21e-13 | 112 |
| GO:004206012 | Liver | Cirrhotic | wound healing | 155/4634 | 422/18723 | 2.12e-08 | 7.56e-07 | 155 |
| GO:000759611 | Liver | Cirrhotic | blood coagulation | 79/4634 | 217/18723 | 8.06e-05 | 8.81e-04 | 79 |
| GO:000759911 | Liver | Cirrhotic | hemostasis | 80/4634 | 222/18723 | 1.08e-04 | 1.10e-03 | 80 |
| GO:005081711 | Liver | Cirrhotic | coagulation | 79/4634 | 222/18723 | 1.90e-04 | 1.76e-03 | 79 |
| GO:005087812 | Liver | Cirrhotic | regulation of body fluid levels | 118/4634 | 379/18723 | 2.65e-03 | 1.55e-02 | 118 |
| GO:000989622 | Liver | HCC | positive regulation of catabolic process | 335/7958 | 492/18723 | 3.83e-31 | 1.87e-28 | 335 |
| Page: 1 2 |
| Pathway ID | Tissue | Disease Stage | Description | Gene Ratio | Bg Ratio | pvalue | p.adjust | qvalue | Count |
| hsa04610 | Liver | NAFLD | Complement and coagulation cascades | 35/1043 | 86/8465 | 2.48e-11 | 2.04e-09 | 1.64e-09 | 35 |
| hsa046101 | Liver | NAFLD | Complement and coagulation cascades | 35/1043 | 86/8465 | 2.48e-11 | 2.04e-09 | 1.64e-09 | 35 |
| hsa046102 | Liver | Cirrhotic | Complement and coagulation cascades | 48/2530 | 86/8465 | 4.41e-07 | 5.44e-06 | 3.35e-06 | 48 |
| hsa05133 | Liver | Cirrhotic | Pertussis | 37/2530 | 76/8465 | 4.17e-04 | 2.57e-03 | 1.58e-03 | 37 |
| hsa046103 | Liver | Cirrhotic | Complement and coagulation cascades | 48/2530 | 86/8465 | 4.41e-07 | 5.44e-06 | 3.35e-06 | 48 |
| hsa051331 | Liver | Cirrhotic | Pertussis | 37/2530 | 76/8465 | 4.17e-04 | 2.57e-03 | 1.58e-03 | 37 |
| hsa046104 | Liver | HCC | Complement and coagulation cascades | 57/4020 | 86/8465 | 3.19e-04 | 1.45e-03 | 8.04e-04 | 57 |
| hsa051332 | Liver | HCC | Pertussis | 48/4020 | 76/8465 | 4.17e-03 | 1.27e-02 | 7.06e-03 | 48 |
| hsa046105 | Liver | HCC | Complement and coagulation cascades | 57/4020 | 86/8465 | 3.19e-04 | 1.45e-03 | 8.04e-04 | 57 |
| hsa051333 | Liver | HCC | Pertussis | 48/4020 | 76/8465 | 4.17e-03 | 1.27e-02 | 7.06e-03 | 48 |
| Page: 1 |
Top |
Cell-cell communication analysis |
| Identification of potential cell-cell interactions between two cell types and their ligand-receptor pairs for different disease states |
| Ligand | Receptor | LRpair | Pathway | Tissue | Disease Stage |
| Page: 1 |
Top |
Single-cell gene regulatory network inference analysis |
| Find out the significant the regulons (TFs) and the target genes of each regulon across cell types for different disease states |
| TF | Cell Type | Tissue | Disease Stage | Target Gene | RSS | Regulon Activity |
| ∗The dot plots of a searched regulon are shown for all cell subpopulations in each disease state of each tissue based on the regulon specific score inferred using pySCENIC and by calculating the average expression. |
| Page: 1 |
Top |
Somatic mutation of malignant transformation related genes |
| Annotation of somatic variants for genes involved in malignant transformation |
| Hugo Symbol | Variant Class | Variant Classification | dbSNP RS | HGVSc | HGVSp | HGVSp Short | SWISSPROT | BIOTYPE | SIFT | PolyPhen | Tumor Sample Barcode | Tissue | Histology | Sex | Age | Stage | Therapy Types | Drugs | Outcome |
| C4BPB | SNV | Missense_Mutation | novel | c.208G>T | p.Asp70Tyr | p.D70Y | P20851 | protein_coding | deleterious(0.01) | possibly_damaging(0.776) | TCGA-A2-A25A-01 | Breast | breast invasive carcinoma | Female | <65 | I/II | Unspecific | Cytoxan | SD |
| C4BPB | SNV | Missense_Mutation | c.357N>G | p.Ser119Arg | p.S119R | P20851 | protein_coding | deleterious(0.01) | probably_damaging(0.999) | TCGA-A8-A07R-01 | Breast | breast invasive carcinoma | Female | >=65 | III/IV | Ancillary | zoledronic | SD | |
| C4BPB | SNV | Missense_Mutation | novel | c.461A>C | p.Asn154Thr | p.N154T | P20851 | protein_coding | tolerated(0.09) | benign(0.006) | TCGA-F5-6814-01 | Colorectum | rectum adenocarcinoma | Male | <65 | I/II | Unknown | Unknown | SD |
| C4BPB | SNV | Missense_Mutation | novel | c.126N>T | p.Gln42His | p.Q42H | P20851 | protein_coding | tolerated(0.12) | benign(0.262) | TCGA-A5-A0G2-01 | Endometrium | uterine corpus endometrioid carcinoma | Female | <65 | III/IV | Unknown | Unknown | SD |
| C4BPB | SNV | Missense_Mutation | novel | c.95N>A | p.Ser32Asn | p.S32N | P20851 | protein_coding | deleterious(0.01) | possibly_damaging(0.595) | TCGA-AJ-A3EL-01 | Endometrium | uterine corpus endometrioid carcinoma | Female | <65 | I/II | Unknown | Unknown | SD |
| C4BPB | SNV | Missense_Mutation | c.74A>G | p.Glu25Gly | p.E25G | P20851 | protein_coding | deleterious(0.01) | possibly_damaging(0.847) | TCGA-AP-A056-01 | Endometrium | uterine corpus endometrioid carcinoma | Female | <65 | I/II | Unknown | Unknown | SD | |
| C4BPB | SNV | Missense_Mutation | c.306A>C | p.Lys102Asn | p.K102N | P20851 | protein_coding | tolerated(0.35) | benign(0.081) | TCGA-AP-A056-01 | Endometrium | uterine corpus endometrioid carcinoma | Female | <65 | I/II | Unknown | Unknown | SD | |
| C4BPB | SNV | Missense_Mutation | rs769703116 | c.353N>A | p.Arg118Gln | p.R118Q | P20851 | protein_coding | tolerated(0.11) | benign(0.044) | TCGA-AX-A063-01 | Endometrium | uterine corpus endometrioid carcinoma | Female | <65 | I/II | Unknown | Unknown | SD |
| C4BPB | SNV | Missense_Mutation | novel | c.383N>T | p.Ala128Val | p.A128V | P20851 | protein_coding | tolerated(0.41) | benign(0.007) | TCGA-AX-A0J1-01 | Endometrium | uterine corpus endometrioid carcinoma | Female | >=65 | I/II | Unknown | Unknown | SD |
| C4BPB | SNV | Missense_Mutation | novel | c.443G>A | p.Gly148Asp | p.G148D | P20851 | protein_coding | deleterious(0) | possibly_damaging(0.574) | TCGA-AX-A1CE-01 | Endometrium | uterine corpus endometrioid carcinoma | Female | <65 | I/II | Unspecific | Paclitaxel | SD |
| Page: 1 2 3 |
Top |
Related drugs of malignant transformation related genes |
| Identification of chemicals and drugs interact with genes involved in malignant transfromation |
| (DGIdb 4.0) |
| Entrez ID | Symbol | Category | Interaction Types | Drug Claim Name | Drug Name | PMIDs |
| Page: 1 |

Copyright 2023-Present -The University of Texas Health Science Center at Houston |