
|
|||||
|
 | |
| |
| |
| |
| |
| |
|
Gene: C4BPA |
Gene summary for C4BPA |
| Gene information | Species | Human | Gene symbol | C4BPA | Gene ID | 722 |
| Gene name | complement component 4 binding protein alpha | |
| Gene Alias | C4BP | |
| Cytomap | 1q32.2 | |
| Gene Type | protein-coding | GO ID | GO:0002250 | UniProtAcc | P04003 |
Top |
Malignant transformation analysis |
| Identification of the aberrant gene expression in precancerous and cancerous lesions by comparing the gene expression of stem-like cells in diseased tissues with normal stem cells |
| Entrez ID | Symbol | Replicates | Species | Organ | Tissue | Adj P-value | Log2FC | Malignancy |
| 722 | C4BPA | NAFLD1 | Human | Liver | NAFLD | 7.85e-12 | 7.29e-01 | -0.04 |
| 722 | C4BPA | S43 | Human | Liver | Cirrhotic | 8.38e-03 | -1.83e-01 | -0.0187 |
| 722 | C4BPA | HCC1_Meng | Human | Liver | HCC | 2.88e-91 | -2.36e-01 | 0.0246 |
| 722 | C4BPA | HCC2_Meng | Human | Liver | HCC | 9.38e-18 | -4.39e-01 | 0.0107 |
| 722 | C4BPA | cirrhotic1 | Human | Liver | Cirrhotic | 7.78e-14 | -4.17e-01 | 0.0202 |
| 722 | C4BPA | cirrhotic2 | Human | Liver | Cirrhotic | 7.32e-13 | -4.10e-01 | 0.0201 |
| 722 | C4BPA | cirrhotic3 | Human | Liver | Cirrhotic | 2.29e-04 | -4.20e-01 | 0.0215 |
| 722 | C4BPA | HCC1 | Human | Liver | HCC | 1.25e-20 | 5.01e+00 | 0.5336 |
| 722 | C4BPA | HCC2 | Human | Liver | HCC | 6.19e-11 | 3.73e+00 | 0.5341 |
| 722 | C4BPA | Pt13.a | Human | Liver | HCC | 3.76e-27 | 1.88e-01 | 0.021 |
| 722 | C4BPA | Pt13.b | Human | Liver | HCC | 9.07e-38 | 2.43e-01 | 0.0251 |
| 722 | C4BPA | Pt14.d | Human | Liver | HCC | 5.10e-10 | -1.94e-01 | 0.0143 |
| 722 | C4BPA | S016 | Human | Liver | HCC | 3.67e-07 | -4.82e-01 | 0.2243 |
| 722 | C4BPA | S027 | Human | Liver | HCC | 4.22e-17 | 1.89e+00 | 0.2446 |
| 722 | C4BPA | S028 | Human | Liver | HCC | 4.27e-33 | 1.67e+00 | 0.2503 |
| 722 | C4BPA | S029 | Human | Liver | HCC | 1.66e-43 | 2.63e+00 | 0.2581 |
| 722 | C4BPA | TD9 | Human | Lung | IAC | 2.13e-03 | -4.97e-01 | 0.088 |
| 722 | C4BPA | RNA-P17T-P17T-2 | Human | Lung | IAC | 2.10e-06 | -1.10e+00 | 0.3371 |
| 722 | C4BPA | RNA-P17T-P17T-4 | Human | Lung | IAC | 8.48e-04 | -1.17e+00 | 0.343 |
| 722 | C4BPA | RNA-P17T-P17T-6 | Human | Lung | IAC | 1.13e-05 | -9.19e-01 | 0.3385 |
| Page: 1 2 |
| Tissue | Expression Dynamics | Abbreviation |
| Liver | 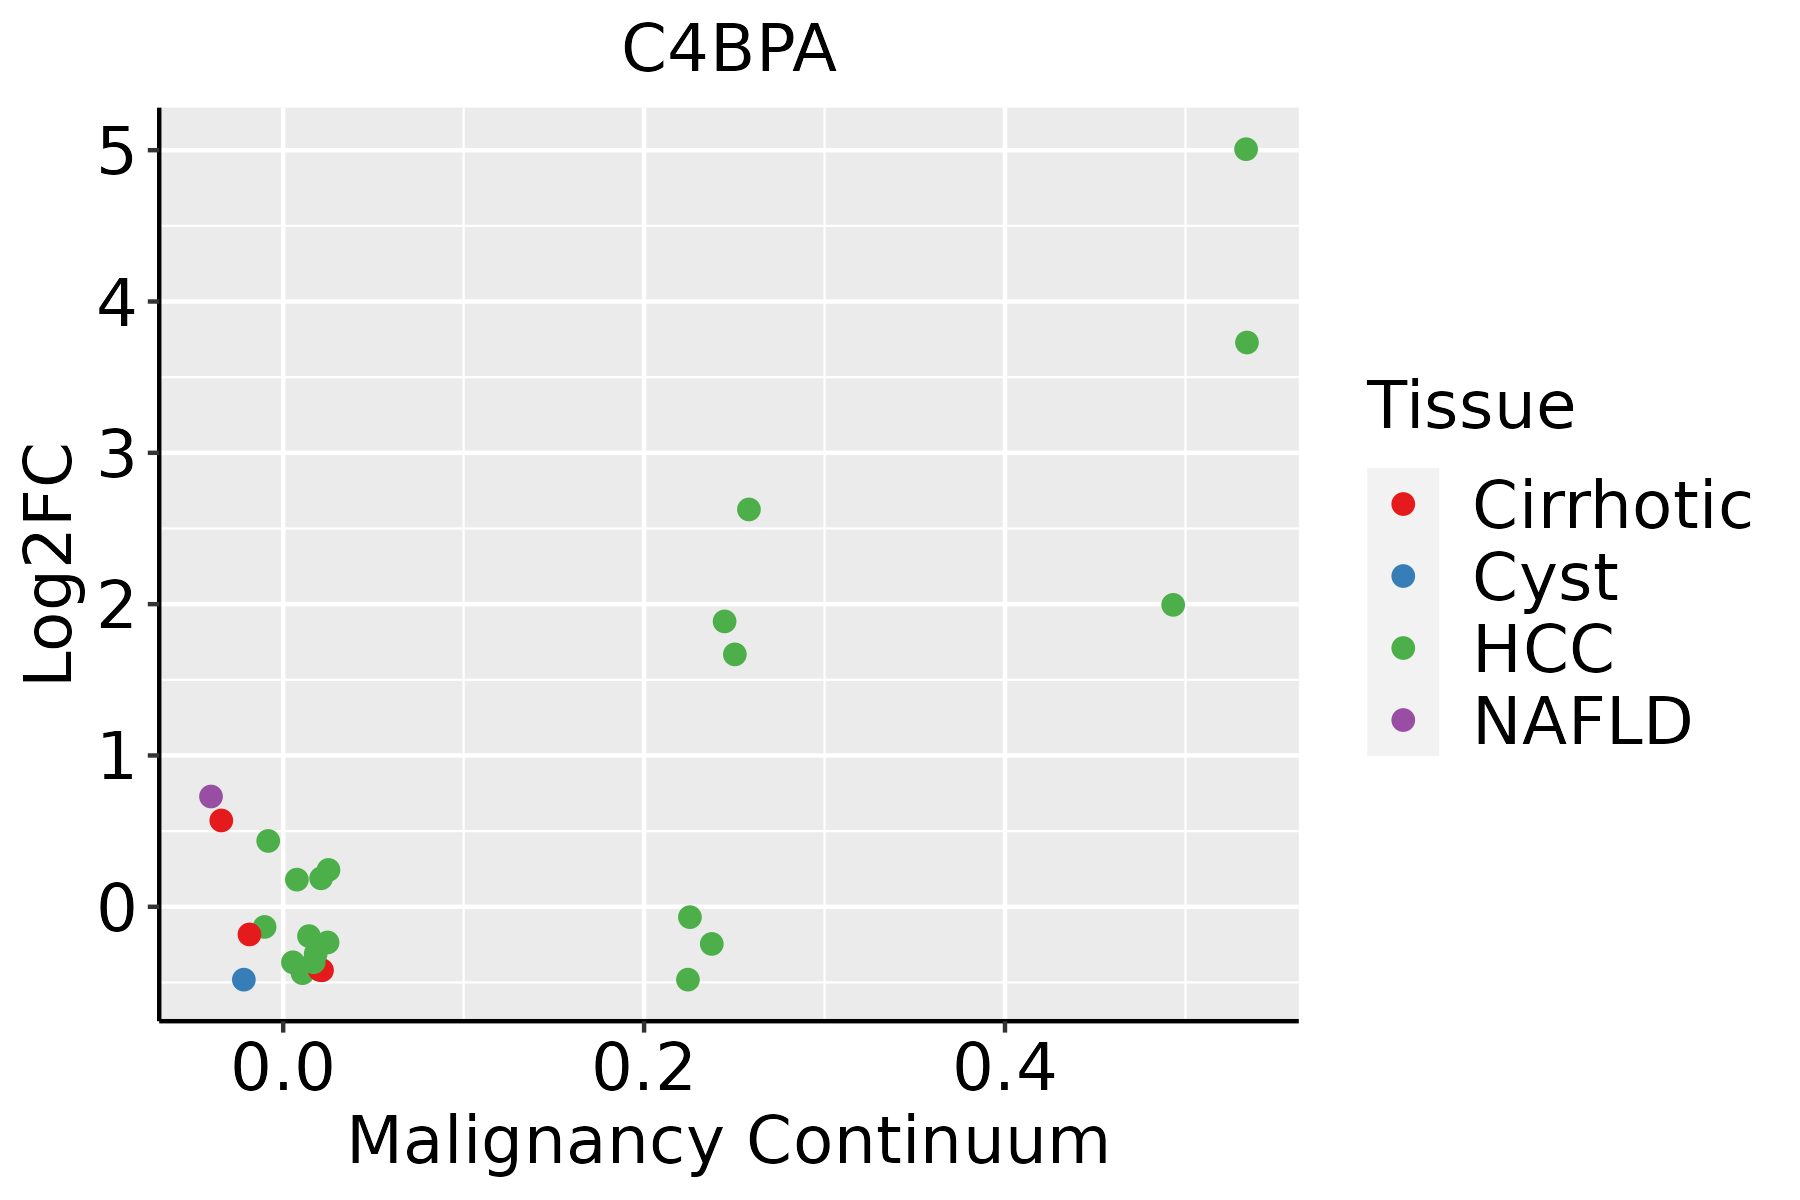 | HCC: Hepatocellular carcinoma |
| NAFLD: Non-alcoholic fatty liver disease | ||
| Lung |  | AAH: Atypical adenomatous hyperplasia |
| AIS: Adenocarcinoma in situ | ||
| IAC: Invasive lung adenocarcinoma | ||
| MIA: Minimally invasive adenocarcinoma |
| ∗log2FC in expression of this searched gene in stem-like cells from each diseased tissue sample relative to stem-like cells in normal samples in each tissue plotted against the malignancy continuum. Samples are colored based on if they are from different disease stage. |
Top |
Malignant transformation related pathway analysis |
| Find out the enriched GO biological processes and KEGG pathways involved in transition from healthy to precancer to cancer |
| Tissue | Disease Stage | Enriched GO biological Processes |
| Colorectum | AD |  |
| Colorectum | SER |  |
| Colorectum | MSS |  |
| Colorectum | MSI-H |  |
| Colorectum | FAP |  |
| ∗Top 15 enriched GO BP terms are showed in the bar plot of each disease state in each tissue. Each row represents a significant GO biological process which is colored according to the -log10(p.adjust). |
| Page: 1 2 3 4 5 6 7 8 9 |
| GO ID | Tissue | Disease Stage | Description | Gene Ratio | Bg Ratio | pvalue | p.adjust | Count |
| GO:00098967 | Liver | NAFLD | positive regulation of catabolic process | 108/1882 | 492/18723 | 2.68e-15 | 3.14e-12 | 108 |
| GO:00421767 | Liver | NAFLD | regulation of protein catabolic process | 83/1882 | 391/18723 | 2.94e-11 | 1.01e-08 | 83 |
| GO:00457327 | Liver | NAFLD | positive regulation of protein catabolic process | 48/1882 | 231/18723 | 8.22e-07 | 4.45e-05 | 48 |
| GO:0045916 | Liver | NAFLD | negative regulation of complement activation | 6/1882 | 12/18723 | 5.54e-04 | 7.46e-03 | 6 |
| GO:0030449 | Liver | NAFLD | regulation of complement activation | 8/1882 | 21/18723 | 6.29e-04 | 8.21e-03 | 8 |
| GO:0002921 | Liver | NAFLD | negative regulation of humoral immune response | 6/1882 | 16/18723 | 3.37e-03 | 2.93e-02 | 6 |
| GO:004217612 | Liver | Cirrhotic | regulation of protein catabolic process | 181/4634 | 391/18723 | 7.94e-21 | 2.77e-18 | 181 |
| GO:000989612 | Liver | Cirrhotic | positive regulation of catabolic process | 215/4634 | 492/18723 | 1.13e-20 | 3.56e-18 | 215 |
| GO:004573212 | Liver | Cirrhotic | positive regulation of protein catabolic process | 112/4634 | 231/18723 | 3.89e-15 | 4.21e-13 | 112 |
| GO:000989622 | Liver | HCC | positive regulation of catabolic process | 335/7958 | 492/18723 | 3.83e-31 | 1.87e-28 | 335 |
| GO:004217622 | Liver | HCC | regulation of protein catabolic process | 267/7958 | 391/18723 | 2.45e-25 | 7.38e-23 | 267 |
| GO:004573222 | Liver | HCC | positive regulation of protein catabolic process | 163/7958 | 231/18723 | 4.00e-18 | 4.69e-16 | 163 |
| GO:0050777 | Liver | HCC | negative regulation of immune response | 101/7958 | 194/18723 | 4.40e-03 | 1.90e-02 | 101 |
| GO:00098968 | Lung | IAC | positive regulation of catabolic process | 114/2061 | 492/18723 | 4.93e-15 | 1.25e-11 | 114 |
| GO:00421768 | Lung | IAC | regulation of protein catabolic process | 97/2061 | 391/18723 | 6.32e-15 | 1.25e-11 | 97 |
| GO:00457328 | Lung | IAC | positive regulation of protein catabolic process | 61/2061 | 231/18723 | 4.44e-11 | 1.39e-08 | 61 |
| GO:004217613 | Lung | AIS | regulation of protein catabolic process | 92/1849 | 391/18723 | 1.34e-15 | 3.91e-12 | 92 |
| GO:000989613 | Lung | AIS | positive regulation of catabolic process | 103/1849 | 492/18723 | 9.59e-14 | 1.86e-10 | 103 |
| GO:004573213 | Lung | AIS | positive regulation of protein catabolic process | 60/1849 | 231/18723 | 1.47e-12 | 2.14e-09 | 60 |
| GO:004217633 | Lung | MIAC | regulation of protein catabolic process | 47/967 | 391/18723 | 6.27e-08 | 2.15e-05 | 47 |
| Page: 1 2 |
| Pathway ID | Tissue | Disease Stage | Description | Gene Ratio | Bg Ratio | pvalue | p.adjust | qvalue | Count |
| hsa04610 | Liver | NAFLD | Complement and coagulation cascades | 35/1043 | 86/8465 | 2.48e-11 | 2.04e-09 | 1.64e-09 | 35 |
| hsa046101 | Liver | NAFLD | Complement and coagulation cascades | 35/1043 | 86/8465 | 2.48e-11 | 2.04e-09 | 1.64e-09 | 35 |
| hsa046102 | Liver | Cirrhotic | Complement and coagulation cascades | 48/2530 | 86/8465 | 4.41e-07 | 5.44e-06 | 3.35e-06 | 48 |
| hsa05133 | Liver | Cirrhotic | Pertussis | 37/2530 | 76/8465 | 4.17e-04 | 2.57e-03 | 1.58e-03 | 37 |
| hsa046103 | Liver | Cirrhotic | Complement and coagulation cascades | 48/2530 | 86/8465 | 4.41e-07 | 5.44e-06 | 3.35e-06 | 48 |
| hsa051331 | Liver | Cirrhotic | Pertussis | 37/2530 | 76/8465 | 4.17e-04 | 2.57e-03 | 1.58e-03 | 37 |
| hsa046104 | Liver | HCC | Complement and coagulation cascades | 57/4020 | 86/8465 | 3.19e-04 | 1.45e-03 | 8.04e-04 | 57 |
| hsa051332 | Liver | HCC | Pertussis | 48/4020 | 76/8465 | 4.17e-03 | 1.27e-02 | 7.06e-03 | 48 |
| hsa046105 | Liver | HCC | Complement and coagulation cascades | 57/4020 | 86/8465 | 3.19e-04 | 1.45e-03 | 8.04e-04 | 57 |
| hsa051333 | Liver | HCC | Pertussis | 48/4020 | 76/8465 | 4.17e-03 | 1.27e-02 | 7.06e-03 | 48 |
| Page: 1 |
Top |
Cell-cell communication analysis |
| Identification of potential cell-cell interactions between two cell types and their ligand-receptor pairs for different disease states |
| Ligand | Receptor | LRpair | Pathway | Tissue | Disease Stage |
| Page: 1 |
Top |
Single-cell gene regulatory network inference analysis |
| Find out the significant the regulons (TFs) and the target genes of each regulon across cell types for different disease states |
| TF | Cell Type | Tissue | Disease Stage | Target Gene | RSS | Regulon Activity |
| ∗The dot plots of a searched regulon are shown for all cell subpopulations in each disease state of each tissue based on the regulon specific score inferred using pySCENIC and by calculating the average expression. |
| Page: 1 |
Top |
Somatic mutation of malignant transformation related genes |
| Annotation of somatic variants for genes involved in malignant transformation |
| Hugo Symbol | Variant Class | Variant Classification | dbSNP RS | HGVSc | HGVSp | HGVSp Short | SWISSPROT | BIOTYPE | SIFT | PolyPhen | Tumor Sample Barcode | Tissue | Histology | Sex | Age | Stage | Therapy Types | Drugs | Outcome |
| C4BPA | SNV | Missense_Mutation | novel | c.1453N>T | p.Arg485Trp | p.R485W | P04003 | protein_coding | tolerated(0.19) | possibly_damaging(0.67) | TCGA-A1-A0SN-01 | Breast | breast invasive carcinoma | Female | <65 | I/II | Chemotherapy | ac | SD |
| C4BPA | SNV | Missense_Mutation | rs868450380 | c.1180G>A | p.Glu394Lys | p.E394K | P04003 | protein_coding | tolerated(0.86) | benign(0.013) | TCGA-A7-A0CG-01 | Breast | breast invasive carcinoma | Female | >=65 | I/II | Unknown | Unknown | SD |
| C4BPA | SNV | Missense_Mutation | c.1507N>C | p.Glu503Gln | p.E503Q | P04003 | protein_coding | tolerated(0.1) | possibly_damaging(0.596) | TCGA-AN-A0XW-01 | Breast | breast invasive carcinoma | Female | <65 | III/IV | Unknown | Unknown | SD | |
| C4BPA | SNV | Missense_Mutation | c.352N>C | p.Glu118Gln | p.E118Q | P04003 | protein_coding | deleterious(0.01) | possibly_damaging(0.616) | TCGA-AR-A1AL-01 | Breast | breast invasive carcinoma | Female | <65 | III/IV | Hormone Therapy | anastrozole | SD | |
| C4BPA | SNV | Missense_Mutation | rs867500835 | c.359N>A | p.Arg120His | p.R120H | P04003 | protein_coding | tolerated(0.17) | benign(0) | TCGA-E2-A1LS-01 | Breast | breast invasive carcinoma | Female | <65 | I/II | Unspecific | Cyclophosphamide | SD |
| C4BPA | SNV | Missense_Mutation | rs764249458 | c.1172A>G | p.Tyr391Cys | p.Y391C | P04003 | protein_coding | deleterious(0.01) | probably_damaging(0.975) | TCGA-EK-A2PG-01 | Cervix | cervical & endocervical cancer | Female | >=65 | I/II | Unknown | Unknown | SD |
| C4BPA | SNV | Missense_Mutation | rs762693425 | c.1298C>T | p.Ala433Val | p.A433V | P04003 | protein_coding | tolerated(0.16) | possibly_damaging(0.734) | TCGA-A6-6781-01 | Colorectum | colon adenocarcinoma | Male | <65 | III/IV | Chemotherapy | oxaliplatin | SD |
| C4BPA | SNV | Missense_Mutation | c.1598C>A | p.Pro533Gln | p.P533Q | P04003 | protein_coding | deleterious(0) | probably_damaging(1) | TCGA-AD-6964-01 | Colorectum | colon adenocarcinoma | Male | <65 | III/IV | Chemotherapy | folfox | PD | |
| C4BPA | SNV | Missense_Mutation | rs867500835 | c.359G>A | p.Arg120His | p.R120H | P04003 | protein_coding | tolerated(0.17) | benign(0) | TCGA-NH-A8F7-06 | Colorectum | NA | NA | NA | NA | NA | NA | NA |
| C4BPA | SNV | Missense_Mutation | c.503C>A | p.Pro168Gln | p.P168Q | P04003 | protein_coding | deleterious(0) | probably_damaging(1) | TCGA-AG-3726-01 | Colorectum | rectum adenocarcinoma | Female | <65 | I/II | Unknown | Unknown | SD |
| Page: 1 2 3 4 5 6 7 |
Top |
Related drugs of malignant transformation related genes |
| Identification of chemicals and drugs interact with genes involved in malignant transfromation |
| (DGIdb 4.0) |
| Entrez ID | Symbol | Category | Interaction Types | Drug Claim Name | Drug Name | PMIDs |
| Page: 1 |

Copyright 2023-Present -The University of Texas Health Science Center at Houston |