
|
|||||
|
 | |
| |
| |
| |
| |
| |
|
Gene: C3orf58 |
Gene summary for C3ORF58 |
| Gene information | Species | Human | Gene symbol | C3orf58 | Gene ID | 205428 |
| Gene name | divergent protein kinase domain 2A | |
| Gene Alias | C3orf58 | |
| Cytomap | 3q24 | |
| Gene Type | protein-coding | GO ID | GO:0001932 | UniProtAcc | B3KTD4 |
Top |
Malignant transformation analysis |
| Identification of the aberrant gene expression in precancerous and cancerous lesions by comparing the gene expression of stem-like cells in diseased tissues with normal stem cells |
| Entrez ID | Symbol | Replicates | Species | Organ | Tissue | Adj P-value | Log2FC | Malignancy |
| 205428 | C3orf58 | P1T-E | Human | Esophagus | ESCC | 7.92e-14 | 1.02e+00 | 0.0875 |
| 205428 | C3orf58 | P2T-E | Human | Esophagus | ESCC | 7.43e-52 | 1.29e+00 | 0.1177 |
| 205428 | C3orf58 | P4T-E | Human | Esophagus | ESCC | 1.13e-28 | 8.92e-01 | 0.1323 |
| 205428 | C3orf58 | P5T-E | Human | Esophagus | ESCC | 4.00e-15 | 3.31e-01 | 0.1327 |
| 205428 | C3orf58 | P8T-E | Human | Esophagus | ESCC | 1.07e-22 | 6.72e-01 | 0.0889 |
| 205428 | C3orf58 | P9T-E | Human | Esophagus | ESCC | 4.23e-24 | 6.93e-01 | 0.1131 |
| 205428 | C3orf58 | P10T-E | Human | Esophagus | ESCC | 1.08e-57 | 1.17e+00 | 0.116 |
| 205428 | C3orf58 | P11T-E | Human | Esophagus | ESCC | 1.29e-04 | 3.64e-01 | 0.1426 |
| 205428 | C3orf58 | P12T-E | Human | Esophagus | ESCC | 1.44e-51 | 1.27e+00 | 0.1122 |
| 205428 | C3orf58 | P15T-E | Human | Esophagus | ESCC | 6.92e-55 | 1.38e+00 | 0.1149 |
| 205428 | C3orf58 | P16T-E | Human | Esophagus | ESCC | 1.56e-17 | 4.82e-01 | 0.1153 |
| 205428 | C3orf58 | P20T-E | Human | Esophagus | ESCC | 9.14e-14 | 4.11e-01 | 0.1124 |
| 205428 | C3orf58 | P21T-E | Human | Esophagus | ESCC | 3.86e-10 | -1.82e-02 | 0.1617 |
| 205428 | C3orf58 | P22T-E | Human | Esophagus | ESCC | 9.29e-16 | 3.17e-01 | 0.1236 |
| 205428 | C3orf58 | P23T-E | Human | Esophagus | ESCC | 1.13e-17 | 5.84e-01 | 0.108 |
| 205428 | C3orf58 | P24T-E | Human | Esophagus | ESCC | 3.00e-02 | 4.91e-02 | 0.1287 |
| 205428 | C3orf58 | P26T-E | Human | Esophagus | ESCC | 4.32e-49 | 9.51e-01 | 0.1276 |
| 205428 | C3orf58 | P27T-E | Human | Esophagus | ESCC | 3.11e-42 | 9.51e-01 | 0.1055 |
| 205428 | C3orf58 | P28T-E | Human | Esophagus | ESCC | 2.80e-22 | 5.69e-01 | 0.1149 |
| 205428 | C3orf58 | P30T-E | Human | Esophagus | ESCC | 6.02e-36 | 1.35e+00 | 0.137 |
| Page: 1 2 3 4 |
| Tissue | Expression Dynamics | Abbreviation |
| Esophagus | 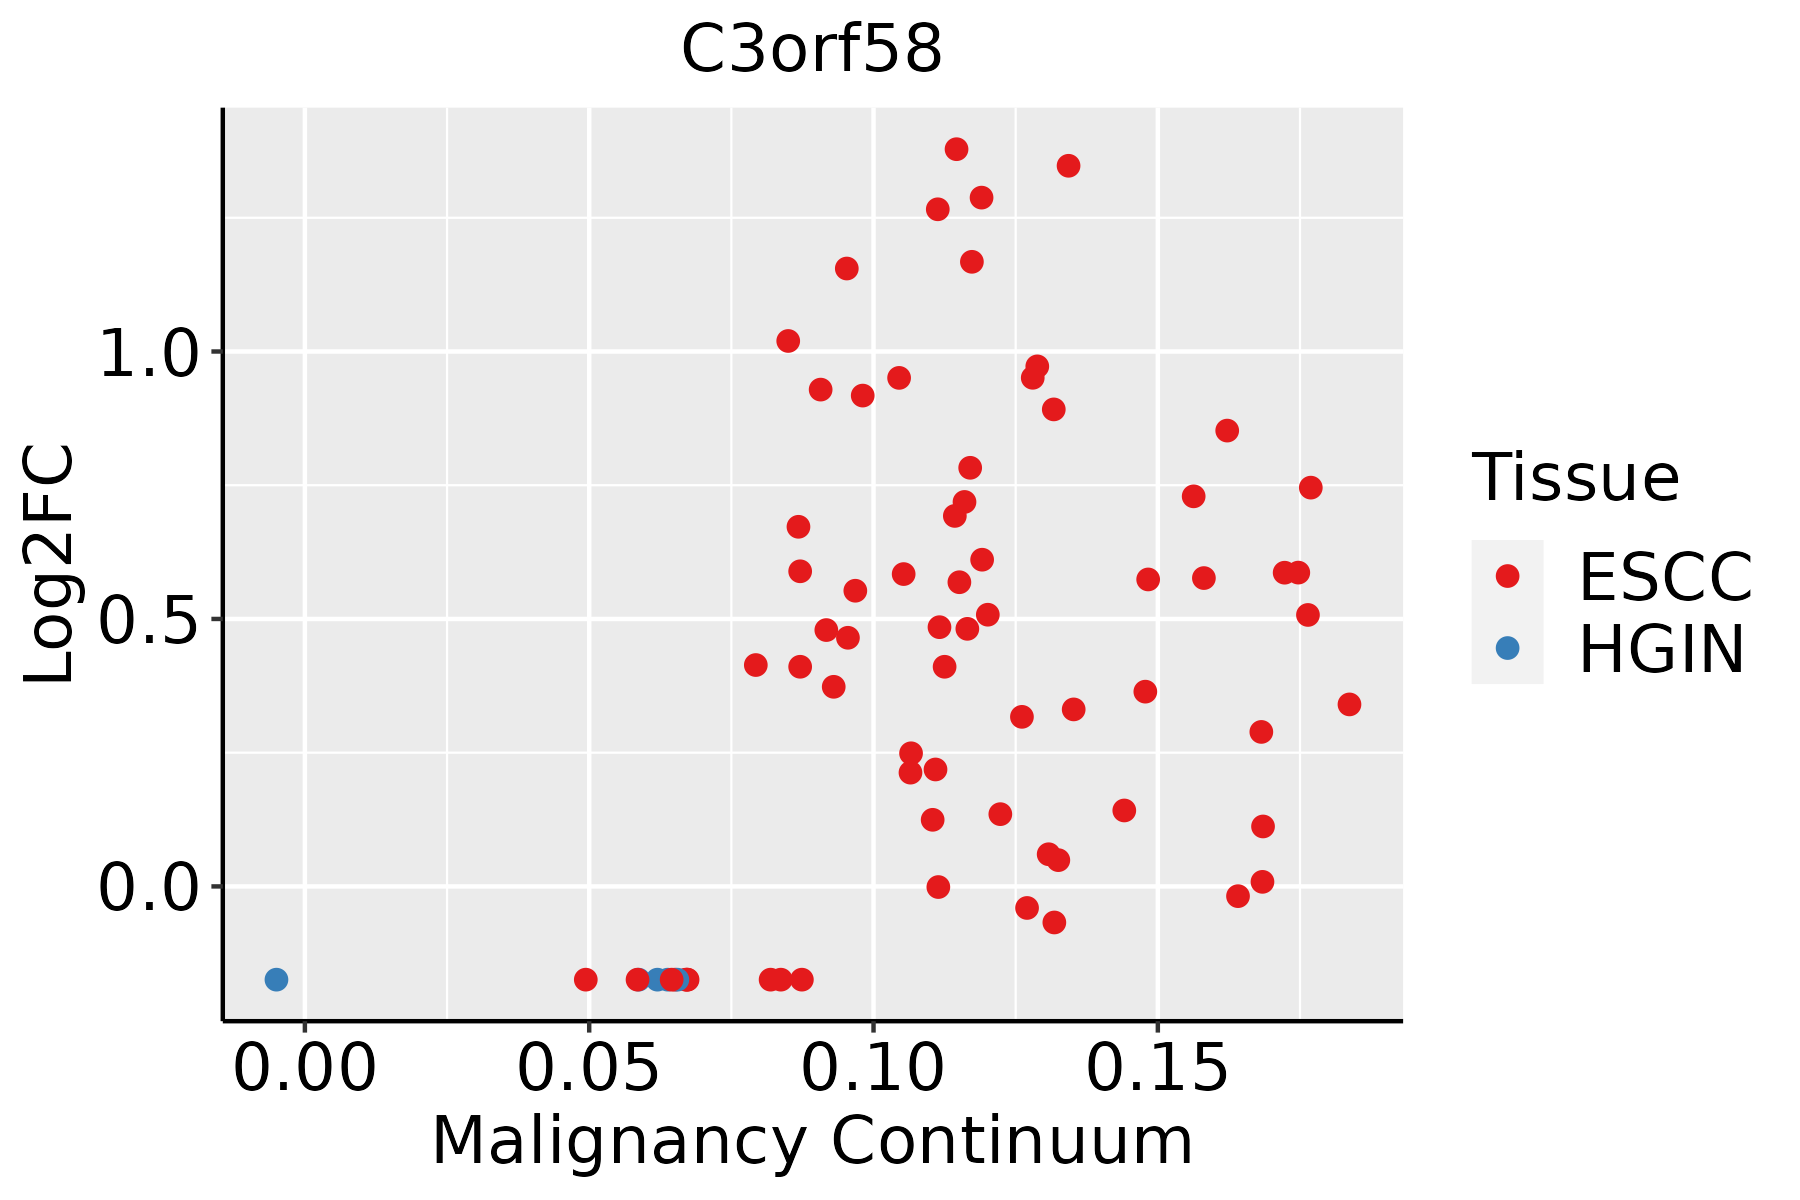 | ESCC: Esophageal squamous cell carcinoma |
| HGIN: High-grade intraepithelial neoplasias | ||
| LGIN: Low-grade intraepithelial neoplasias | ||
| Liver | 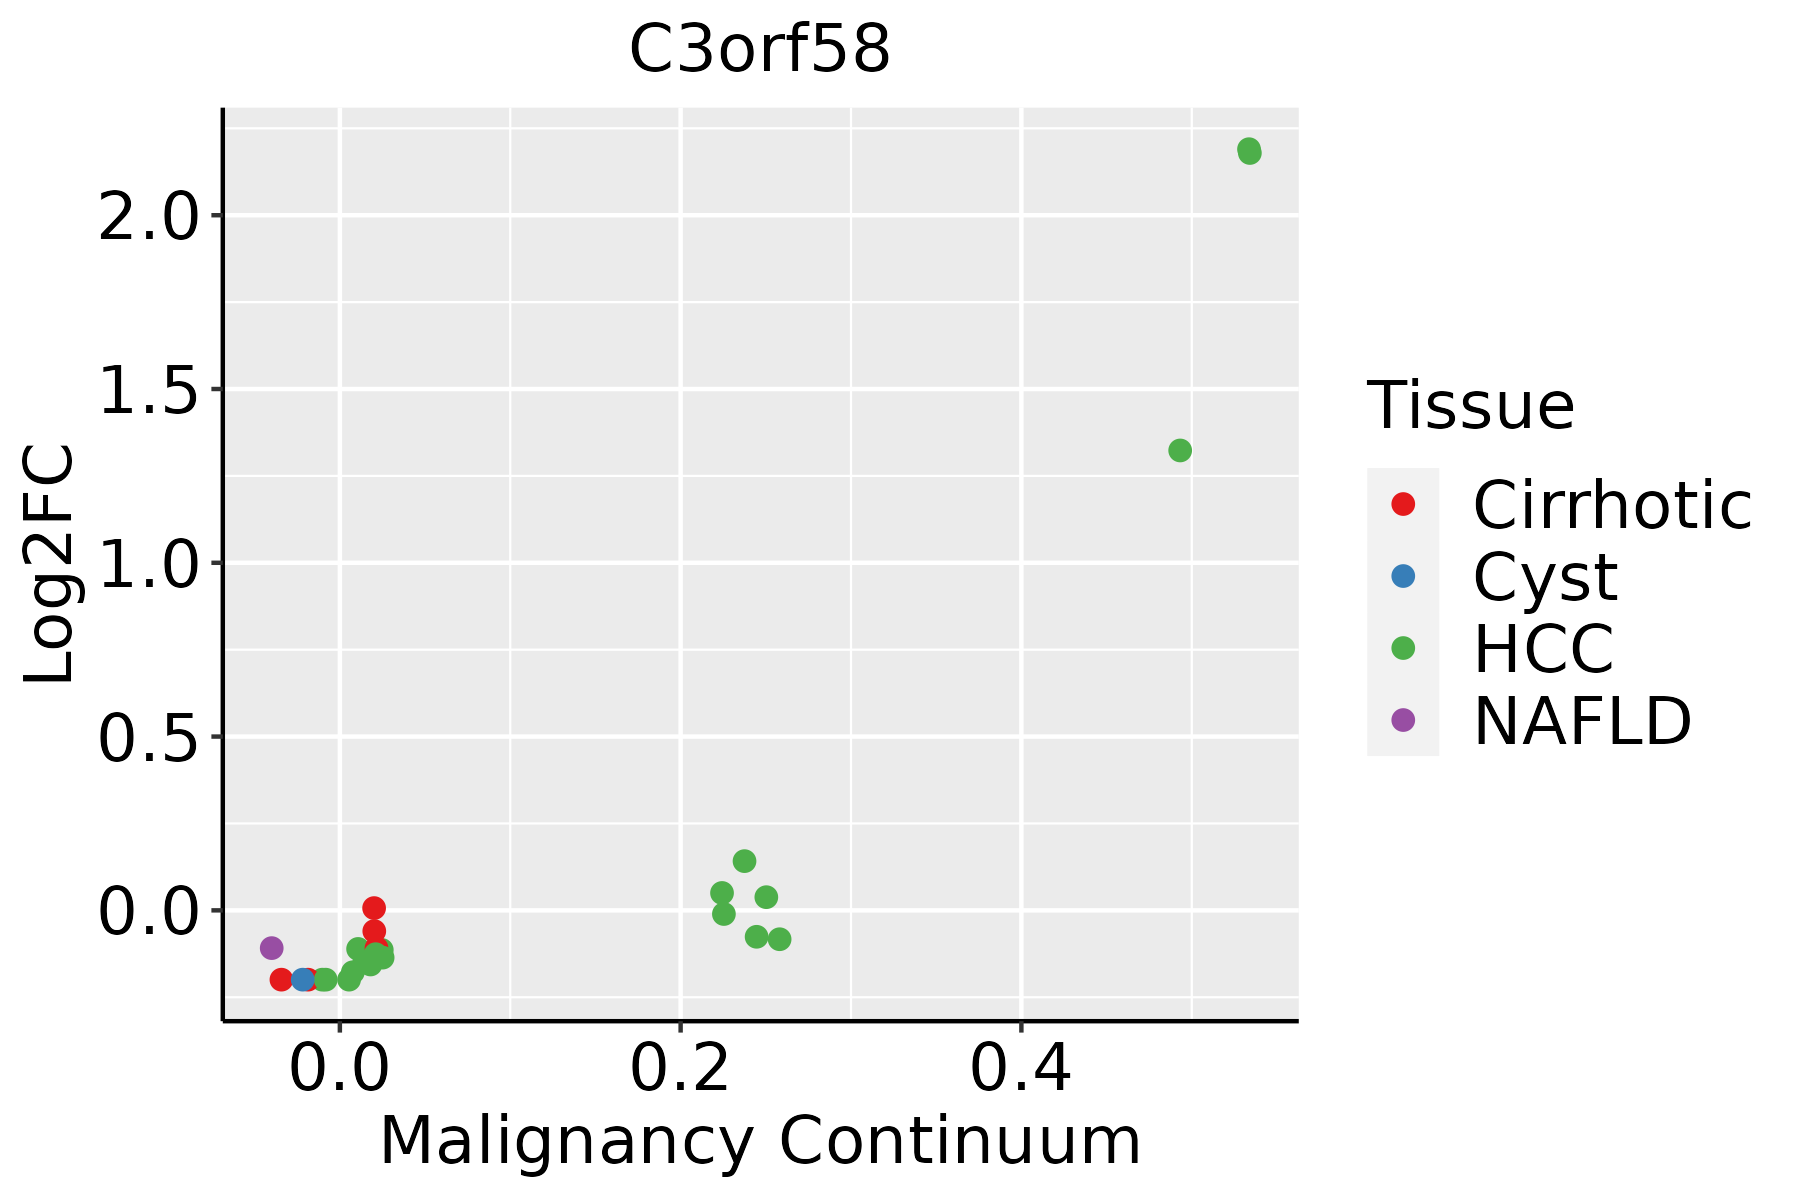 | HCC: Hepatocellular carcinoma |
| NAFLD: Non-alcoholic fatty liver disease | ||
| Oral Cavity | 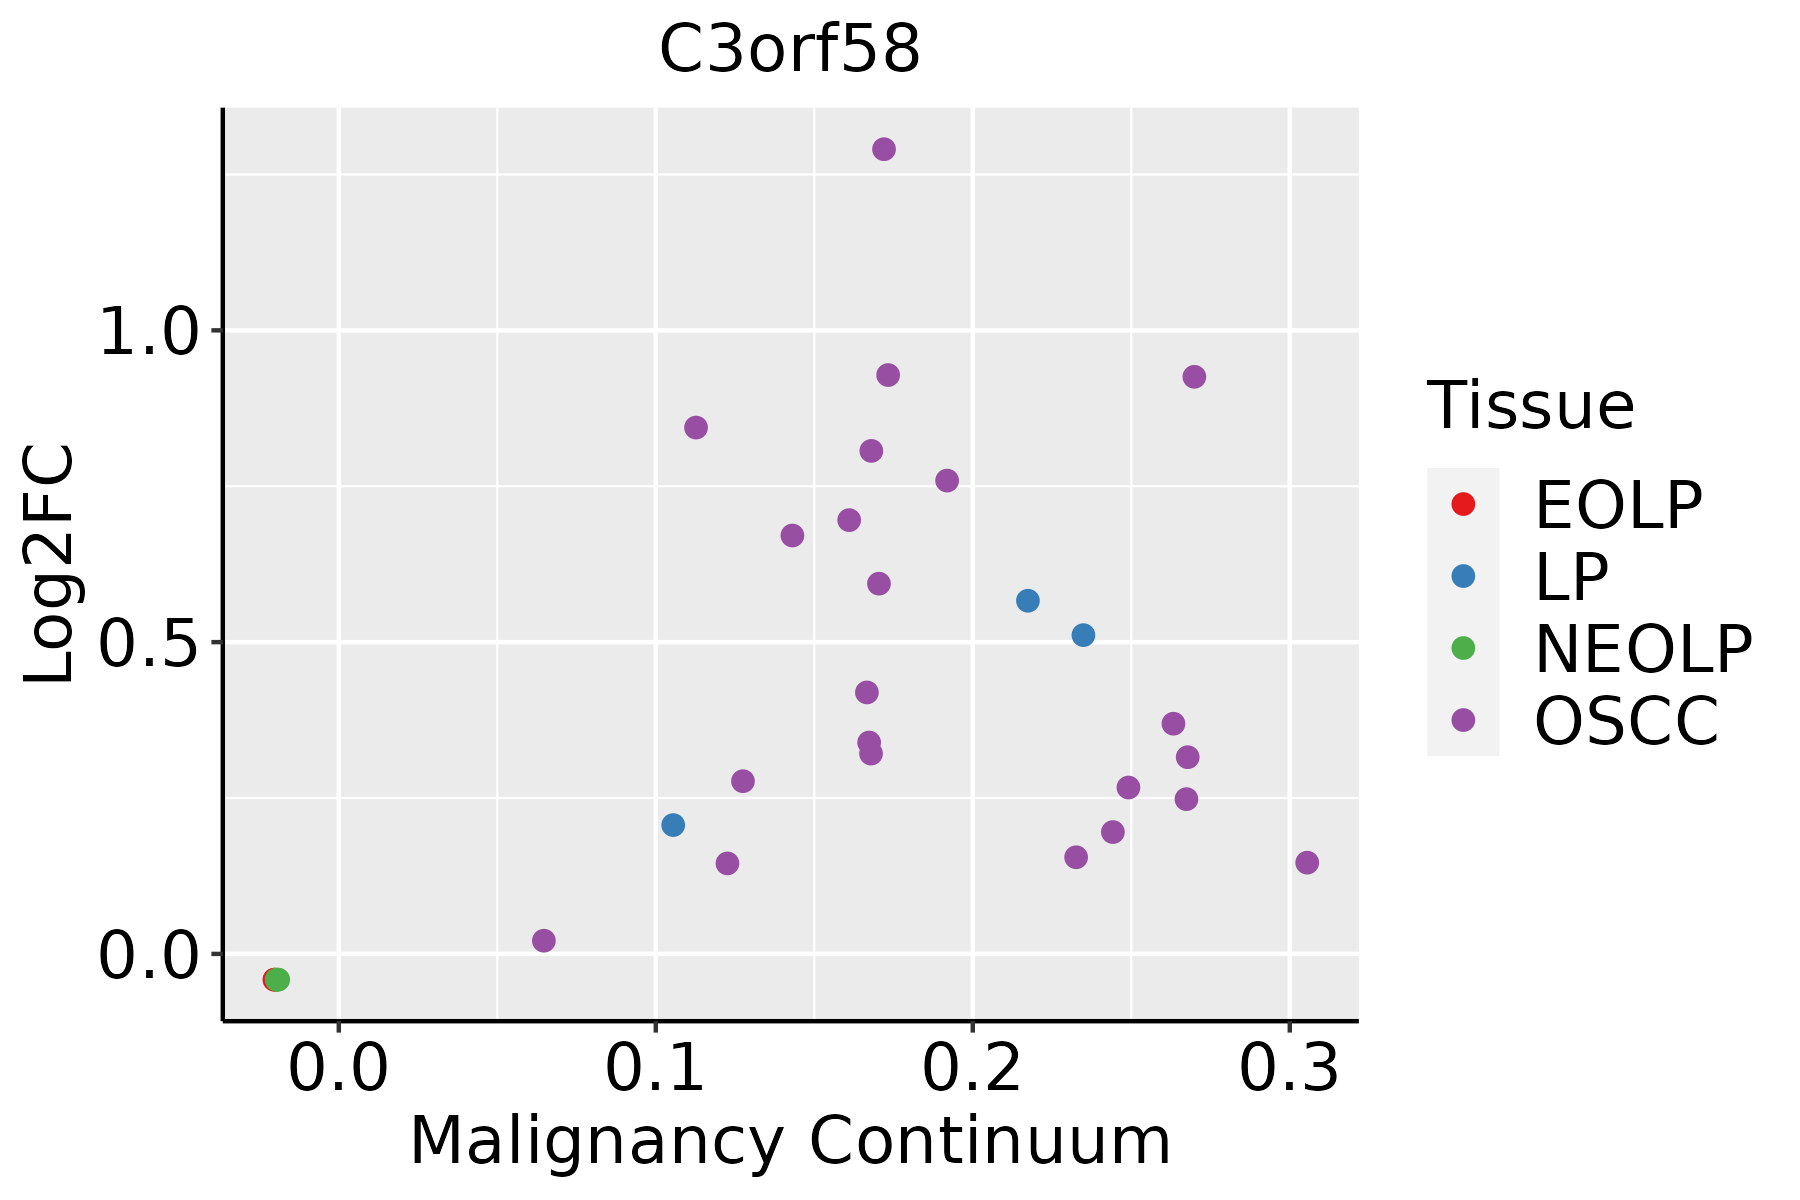 | EOLP: Erosive Oral lichen planus |
| LP: leukoplakia | ||
| NEOLP: Non-erosive oral lichen planus | ||
| OSCC: Oral squamous cell carcinoma |
| ∗log2FC in expression of this searched gene in stem-like cells from each diseased tissue sample relative to stem-like cells in normal samples in each tissue plotted against the malignancy continuum. Samples are colored based on if they are from different disease stage. |
Top |
Malignant transformation related pathway analysis |
| Find out the enriched GO biological processes and KEGG pathways involved in transition from healthy to precancer to cancer |
| Tissue | Disease Stage | Enriched GO biological Processes |
| Colorectum | AD |  |
| Colorectum | SER |  |
| Colorectum | MSS |  |
| Colorectum | MSI-H |  |
| Colorectum | FAP |  |
| ∗Top 15 enriched GO BP terms are showed in the bar plot of each disease state in each tissue. Each row represents a significant GO biological process which is colored according to the -log10(p.adjust). |
| Page: 1 2 3 4 5 6 7 8 9 |
| GO ID | Tissue | Disease Stage | Description | Gene Ratio | Bg Ratio | pvalue | p.adjust | Count |
| Page: 1 |
| Pathway ID | Tissue | Disease Stage | Description | Gene Ratio | Bg Ratio | pvalue | p.adjust | qvalue | Count |
| Page: 1 |
Top |
Cell-cell communication analysis |
| Identification of potential cell-cell interactions between two cell types and their ligand-receptor pairs for different disease states |
| Ligand | Receptor | LRpair | Pathway | Tissue | Disease Stage |
| Page: 1 |
Top |
Single-cell gene regulatory network inference analysis |
| Find out the significant the regulons (TFs) and the target genes of each regulon across cell types for different disease states |
| TF | Cell Type | Tissue | Disease Stage | Target Gene | RSS | Regulon Activity |
| ∗The dot plots of a searched regulon are shown for all cell subpopulations in each disease state of each tissue based on the regulon specific score inferred using pySCENIC and by calculating the average expression. |
| Page: 1 |
Top |
Somatic mutation of malignant transformation related genes |
| Annotation of somatic variants for genes involved in malignant transformation |
| Hugo Symbol | Variant Class | Variant Classification | dbSNP RS | HGVSc | HGVSp | HGVSp Short | SWISSPROT | BIOTYPE | SIFT | PolyPhen | Tumor Sample Barcode | Tissue | Histology | Sex | Age | Stage | Therapy Types | Drugs | Outcome |
| C3orf58 | SNV | Missense_Mutation | c.1183N>T | p.Leu395Phe | p.L395F | Q8NDZ4 | protein_coding | deleterious(0.01) | probably_damaging(0.991) | TCGA-BH-A0HF-01 | Breast | breast invasive carcinoma | Female | >=65 | I/II | Hormone Therapy | arimidex | SD | |
| C3orf58 | SNV | Missense_Mutation | rs746257836 | c.954T>G | p.Ile318Met | p.I318M | Q8NDZ4 | protein_coding | deleterious(0) | benign(0.221) | TCGA-C8-A12V-01 | Breast | breast invasive carcinoma | Female | <65 | I/II | Unknown | Unknown | SD |
| C3orf58 | deletion | Frame_Shift_Del | novel | c.1245delN | p.Glu417AsnfsTer6 | p.E417Nfs*6 | Q8NDZ4 | protein_coding | TCGA-EW-A2FV-01 | Breast | breast invasive carcinoma | Female | <65 | III/IV | Chemotherapy | docetaxel | SD | ||
| C3orf58 | SNV | Missense_Mutation | c.583N>T | p.Arg195Cys | p.R195C | Q8NDZ4 | protein_coding | deleterious(0) | possibly_damaging(0.556) | TCGA-JW-A5VL-01 | Cervix | cervical & endocervical cancer | Female | <65 | I/II | Unknown | Unknown | SD | |
| C3orf58 | SNV | Missense_Mutation | novel | c.1031C>T | p.Ser344Leu | p.S344L | Q8NDZ4 | protein_coding | deleterious(0.04) | probably_damaging(0.943) | TCGA-VS-A8QM-01 | Cervix | cervical & endocervical cancer | Female | <65 | I/II | Chemotherapy | cisplatin | PD |
| C3orf58 | SNV | Missense_Mutation | rs199668779 | c.1180N>T | p.Arg394Trp | p.R394W | Q8NDZ4 | protein_coding | deleterious(0.01) | possibly_damaging(0.742) | TCGA-A6-2686-01 | Colorectum | colon adenocarcinoma | Female | >=65 | I/II | Unknown | Unknown | SD |
| C3orf58 | SNV | Missense_Mutation | novel | c.947N>T | p.Arg316Ile | p.R316I | Q8NDZ4 | protein_coding | tolerated(0.06) | benign(0.208) | TCGA-AA-3984-01 | Colorectum | colon adenocarcinoma | Female | <65 | I/II | Unknown | Unknown | SD |
| C3orf58 | SNV | Missense_Mutation | novel | c.638N>T | p.Pro213Leu | p.P213L | Q8NDZ4 | protein_coding | deleterious(0.01) | benign(0.251) | TCGA-AD-6895-01 | Colorectum | colon adenocarcinoma | Male | >=65 | III/IV | Unknown | Unknown | SD |
| C3orf58 | SNV | Missense_Mutation | novel | c.1048N>T | p.Leu350Phe | p.L350F | Q8NDZ4 | protein_coding | deleterious(0.01) | probably_damaging(0.986) | TCGA-AM-5820-01 | Colorectum | colon adenocarcinoma | Female | <65 | I/II | Unknown | Unknown | SD |
| C3orf58 | SNV | Missense_Mutation | c.970G>A | p.Glu324Lys | p.E324K | Q8NDZ4 | protein_coding | tolerated(1) | probably_damaging(0.953) | TCGA-D5-6928-01 | Colorectum | colon adenocarcinoma | Male | >=65 | I/II | Unknown | Unknown | SD |
| Page: 1 2 3 4 5 |
Top |
Related drugs of malignant transformation related genes |
| Identification of chemicals and drugs interact with genes involved in malignant transfromation |
| (DGIdb 4.0) |
| Entrez ID | Symbol | Category | Interaction Types | Drug Claim Name | Drug Name | PMIDs |
| Page: 1 |

Copyright 2023-Present -The University of Texas Health Science Center at Houston |