
|
|||||
|
 | |
| |
| |
| |
| |
| |
|
Gene: C3orf52 |
Gene summary for C3ORF52 |
| Gene information | Species | Human | Gene symbol | C3orf52 | Gene ID | 79669 |
| Gene name | chromosome 3 open reading frame 52 | |
| Gene Alias | TTMP | |
| Cytomap | 3q13.2 | |
| Gene Type | protein-coding | GO ID | GO:0005575 | UniProtAcc | Q5BVD1 |
Top |
Malignant transformation analysis |
| Identification of the aberrant gene expression in precancerous and cancerous lesions by comparing the gene expression of stem-like cells in diseased tissues with normal stem cells |
| Entrez ID | Symbol | Replicates | Species | Organ | Tissue | Adj P-value | Log2FC | Malignancy |
| 79669 | C3orf52 | CCI_1 | Human | Cervix | CC | 2.06e-04 | 5.24e-01 | 0.528 |
| 79669 | C3orf52 | CCI_2 | Human | Cervix | CC | 1.35e-11 | 7.92e-01 | 0.5249 |
| 79669 | C3orf52 | CCI_3 | Human | Cervix | CC | 1.32e-14 | 6.43e-01 | 0.516 |
| 79669 | C3orf52 | sample1 | Human | Cervix | CC | 6.50e-09 | 3.78e-01 | 0.0959 |
| 79669 | C3orf52 | sample3 | Human | Cervix | CC | 1.14e-06 | 2.09e-01 | 0.1387 |
| 79669 | C3orf52 | T1 | Human | Cervix | CC | 2.87e-19 | 4.44e-01 | 0.0918 |
| 79669 | C3orf52 | T3 | Human | Cervix | CC | 2.49e-08 | 2.38e-01 | 0.1389 |
| 79669 | C3orf52 | HTA11_1938_2000001011 | Human | Colorectum | AD | 5.95e-04 | 3.16e-01 | -0.0811 |
| 79669 | C3orf52 | A002-C-205 | Human | Colorectum | FAP | 1.06e-03 | -1.98e-01 | -0.1236 |
| 79669 | C3orf52 | A015-C-104 | Human | Colorectum | FAP | 3.35e-03 | -1.34e-01 | -0.1899 |
| 79669 | C3orf52 | A002-C-116 | Human | Colorectum | FAP | 3.11e-02 | -6.49e-02 | -0.0452 |
| 79669 | C3orf52 | LZE4T | Human | Esophagus | ESCC | 1.33e-10 | 3.76e-01 | 0.0811 |
| 79669 | C3orf52 | LZE5T | Human | Esophagus | ESCC | 2.36e-05 | 2.78e-02 | 0.0514 |
| 79669 | C3orf52 | LZE7T | Human | Esophagus | ESCC | 3.66e-02 | 2.07e-01 | 0.0667 |
| 79669 | C3orf52 | LZE8T | Human | Esophagus | ESCC | 4.11e-11 | 3.01e-01 | 0.067 |
| 79669 | C3orf52 | LZE24T | Human | Esophagus | ESCC | 1.88e-11 | 6.95e-01 | 0.0596 |
| 79669 | C3orf52 | P1T-E | Human | Esophagus | ESCC | 3.26e-07 | 4.18e-01 | 0.0875 |
| 79669 | C3orf52 | P2T-E | Human | Esophagus | ESCC | 4.50e-09 | -1.32e-01 | 0.1177 |
| 79669 | C3orf52 | P4T-E | Human | Esophagus | ESCC | 9.10e-05 | 2.42e-02 | 0.1323 |
| 79669 | C3orf52 | P5T-E | Human | Esophagus | ESCC | 1.75e-10 | 3.04e-01 | 0.1327 |
| Page: 1 2 3 4 5 6 |
| Tissue | Expression Dynamics | Abbreviation |
| Cervix | 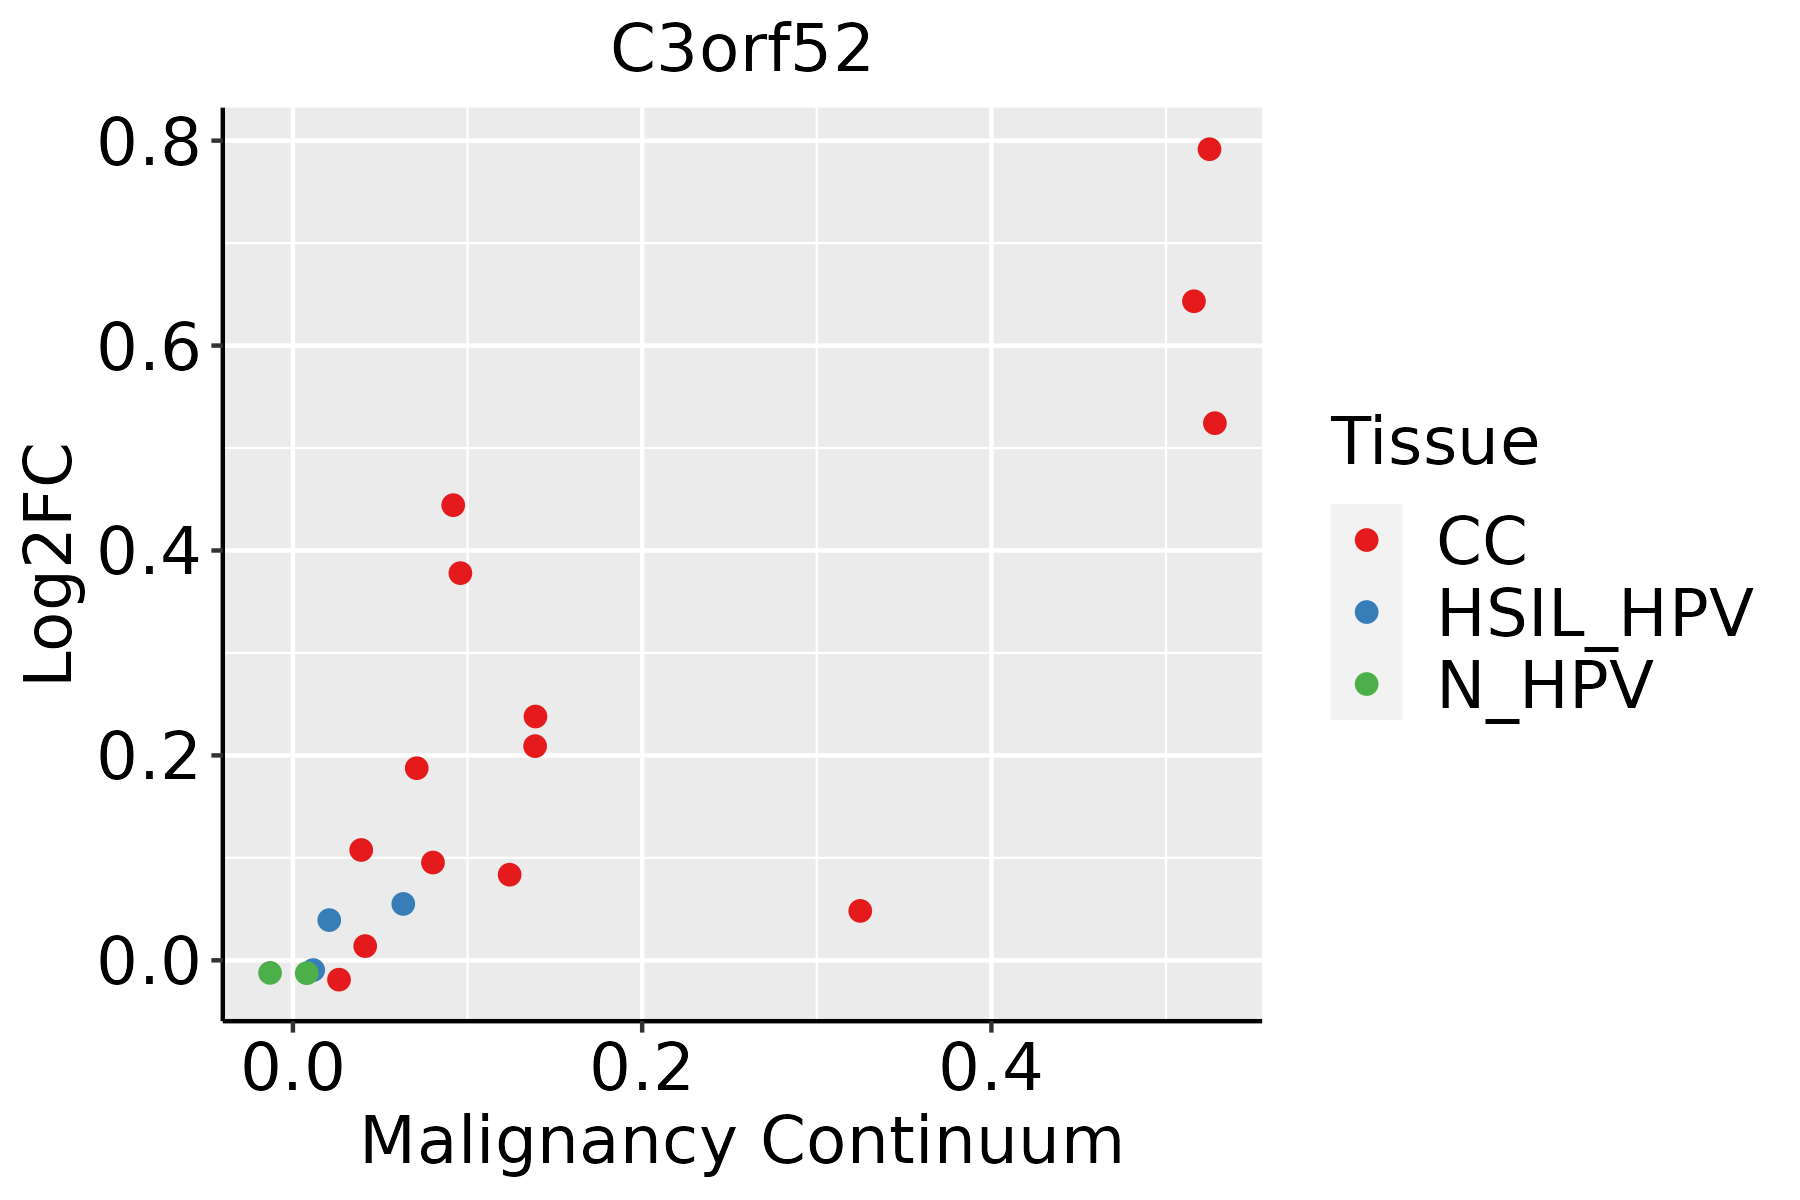 | CC: Cervix cancer |
| HSIL_HPV: HPV-infected high-grade squamous intraepithelial lesions | ||
| N_HPV: HPV-infected normal cervix | ||
| Colorectum (GSE201348) |  | FAP: Familial adenomatous polyposis |
| CRC: Colorectal cancer | ||
| Colorectum (HTA11) |  | AD: Adenomas |
| SER: Sessile serrated lesions | ||
| MSI-H: Microsatellite-high colorectal cancer | ||
| MSS: Microsatellite stable colorectal cancer | ||
| Esophagus | 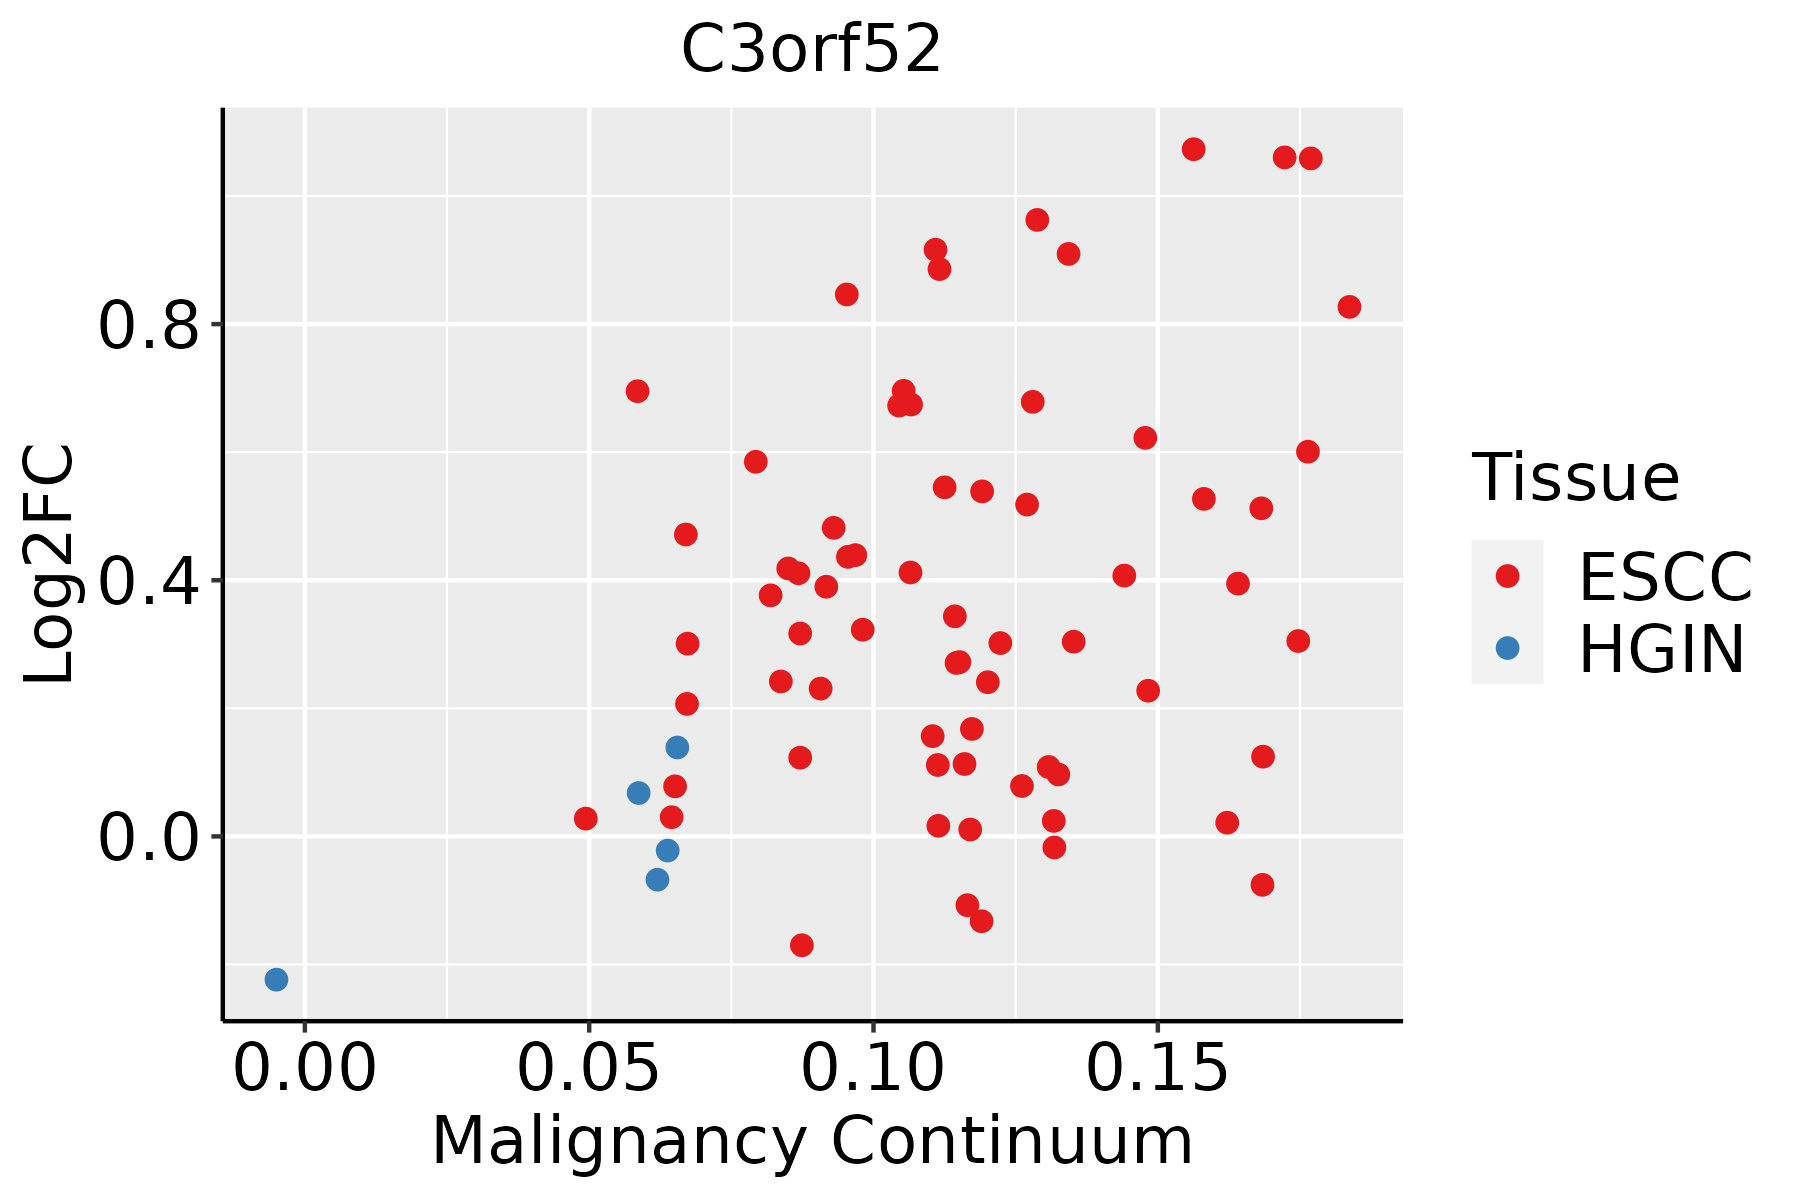 | ESCC: Esophageal squamous cell carcinoma |
| HGIN: High-grade intraepithelial neoplasias | ||
| LGIN: Low-grade intraepithelial neoplasias | ||
| Lung |  | AAH: Atypical adenomatous hyperplasia |
| AIS: Adenocarcinoma in situ | ||
| IAC: Invasive lung adenocarcinoma | ||
| MIA: Minimally invasive adenocarcinoma | ||
| Oral Cavity | 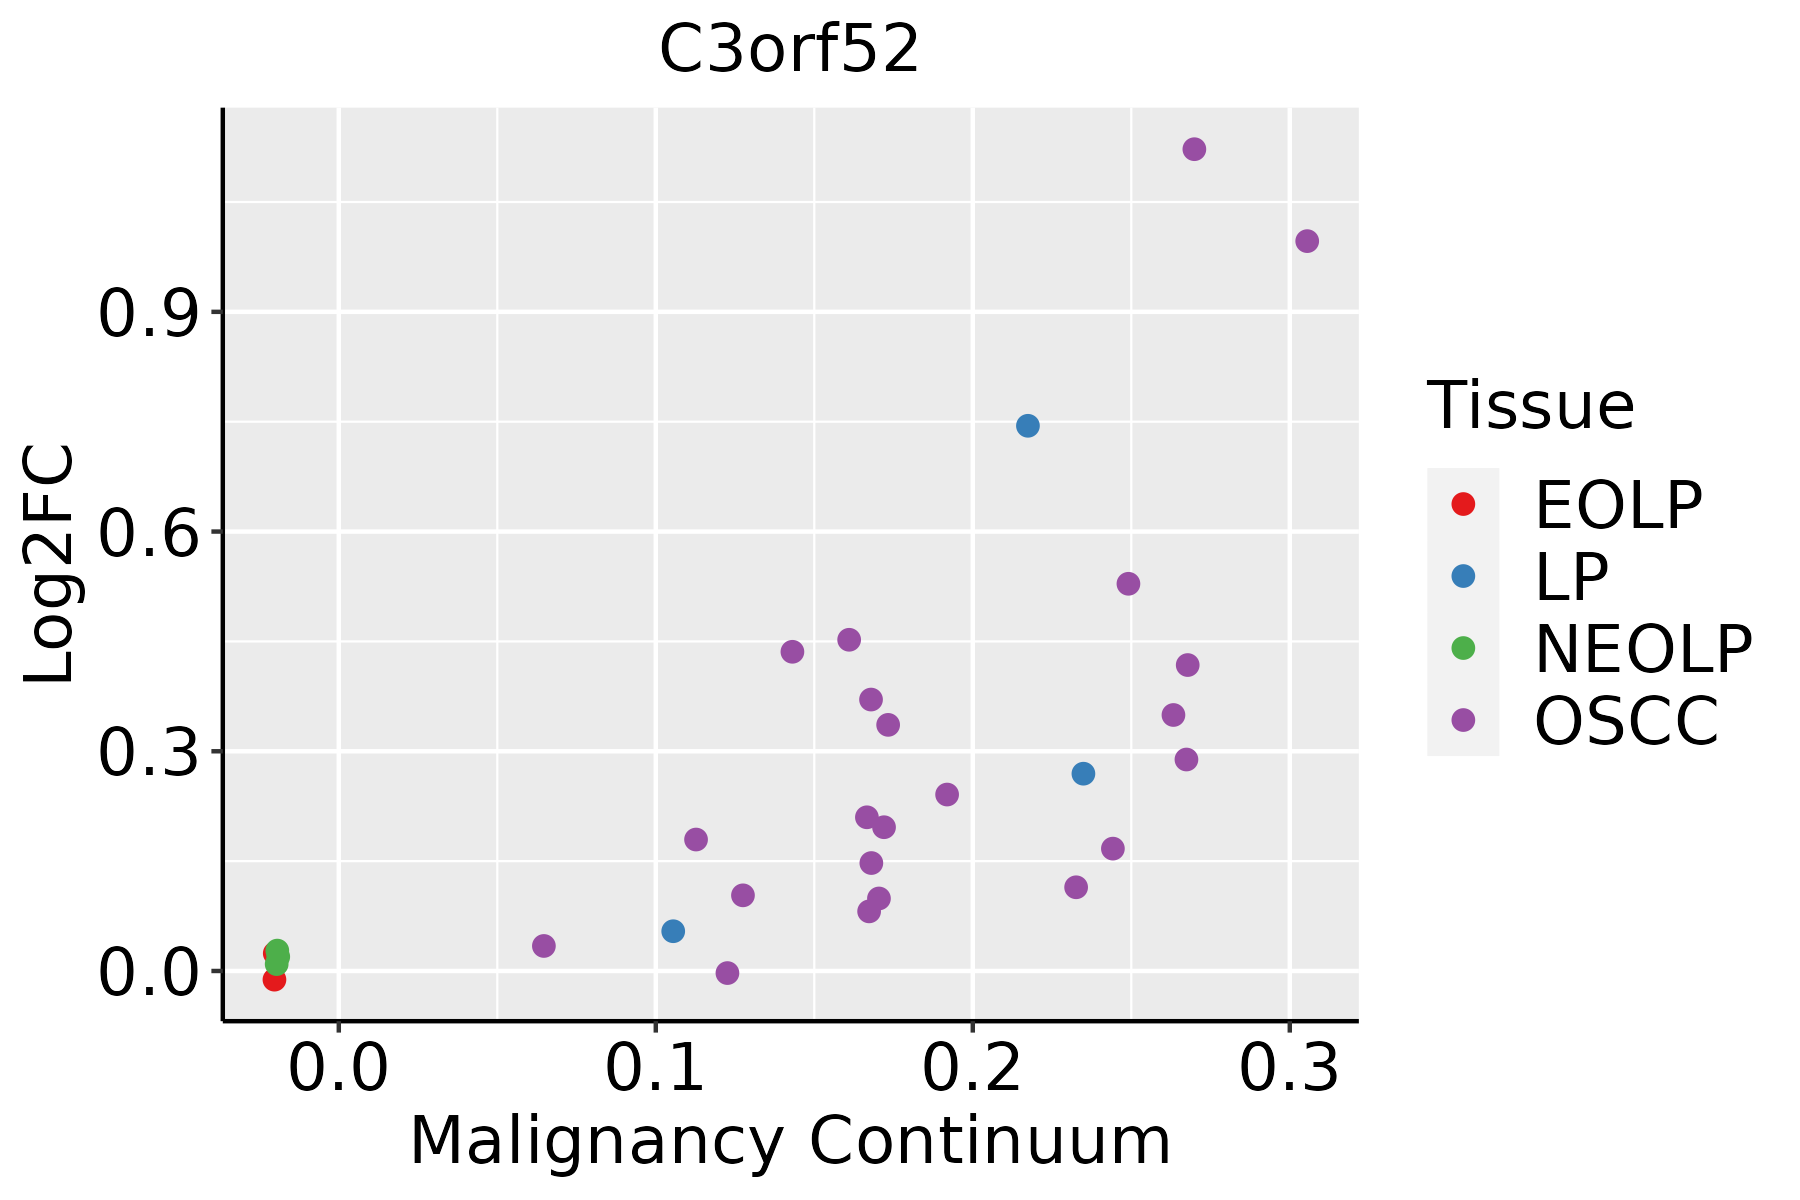 | EOLP: Erosive Oral lichen planus |
| LP: leukoplakia | ||
| NEOLP: Non-erosive oral lichen planus | ||
| OSCC: Oral squamous cell carcinoma | ||
| Prostate | 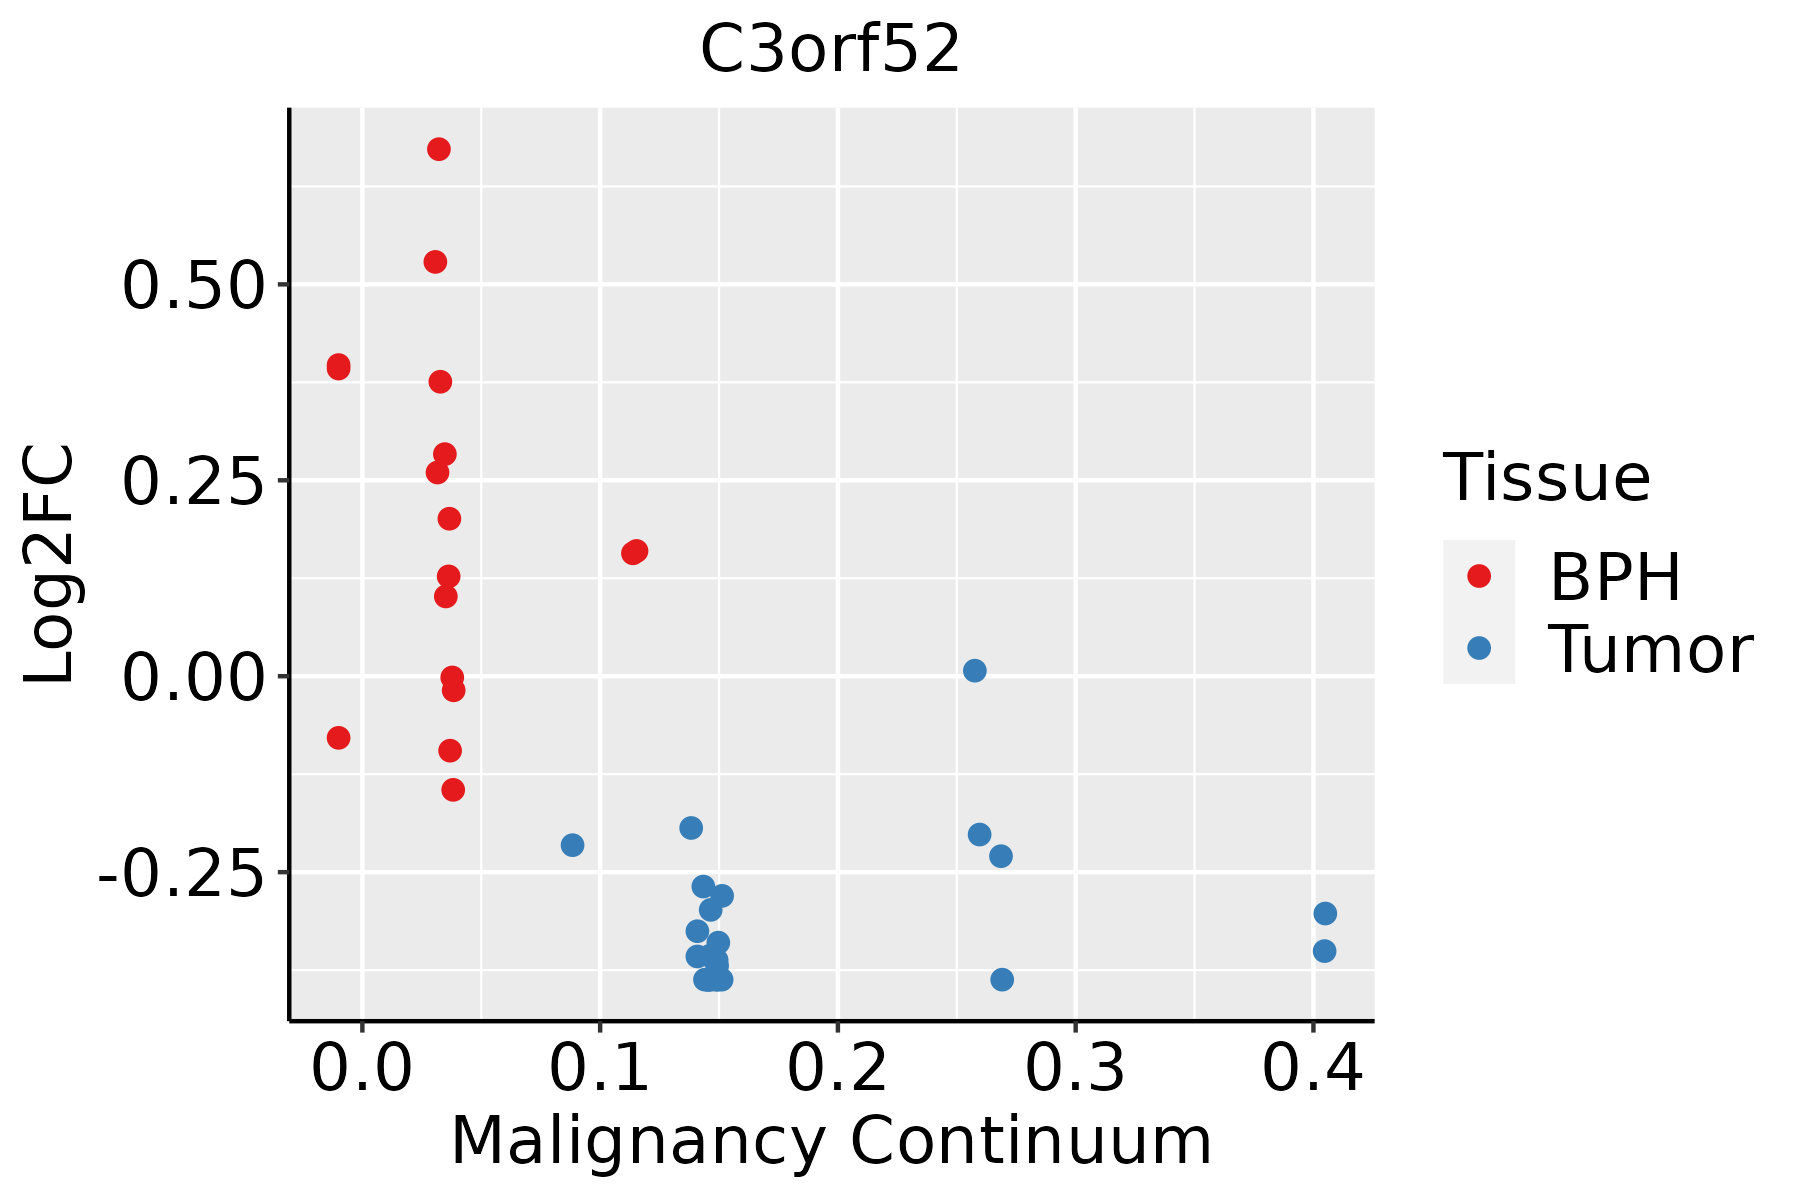 | BPH: Benign Prostatic Hyperplasia |
| ∗log2FC in expression of this searched gene in stem-like cells from each diseased tissue sample relative to stem-like cells in normal samples in each tissue plotted against the malignancy continuum. Samples are colored based on if they are from different disease stage. |
Top |
Malignant transformation related pathway analysis |
| Find out the enriched GO biological processes and KEGG pathways involved in transition from healthy to precancer to cancer |
| Tissue | Disease Stage | Enriched GO biological Processes |
| Colorectum | AD |  |
| Colorectum | SER |  |
| Colorectum | MSS |  |
| Colorectum | MSI-H |  |
| Colorectum | FAP |  |
| ∗Top 15 enriched GO BP terms are showed in the bar plot of each disease state in each tissue. Each row represents a significant GO biological process which is colored according to the -log10(p.adjust). |
| Page: 1 2 3 4 5 6 7 8 9 |
| GO ID | Tissue | Disease Stage | Description | Gene Ratio | Bg Ratio | pvalue | p.adjust | Count |
| Page: 1 |
| Pathway ID | Tissue | Disease Stage | Description | Gene Ratio | Bg Ratio | pvalue | p.adjust | qvalue | Count |
| Page: 1 |
Top |
Cell-cell communication analysis |
| Identification of potential cell-cell interactions between two cell types and their ligand-receptor pairs for different disease states |
| Ligand | Receptor | LRpair | Pathway | Tissue | Disease Stage |
| Page: 1 |
Top |
Single-cell gene regulatory network inference analysis |
| Find out the significant the regulons (TFs) and the target genes of each regulon across cell types for different disease states |
| TF | Cell Type | Tissue | Disease Stage | Target Gene | RSS | Regulon Activity |
| ∗The dot plots of a searched regulon are shown for all cell subpopulations in each disease state of each tissue based on the regulon specific score inferred using pySCENIC and by calculating the average expression. |
| Page: 1 |
Top |
Somatic mutation of malignant transformation related genes |
| Annotation of somatic variants for genes involved in malignant transformation |
| Hugo Symbol | Variant Class | Variant Classification | dbSNP RS | HGVSc | HGVSp | HGVSp Short | SWISSPROT | BIOTYPE | SIFT | PolyPhen | Tumor Sample Barcode | Tissue | Histology | Sex | Age | Stage | Therapy Types | Drugs | Outcome |
| C3orf52 | SNV | Missense_Mutation | c.370N>A | p.Glu124Lys | p.E124K | Q5BVD1 | protein_coding | tolerated_low_confidence(0.06) | benign(0.189) | TCGA-A2-A0EV-01 | Breast | breast invasive carcinoma | Female | >=65 | I/II | Unknown | Unknown | SD | |
| C3orf52 | SNV | Missense_Mutation | novel | c.16C>T | p.Pro6Ser | p.P6S | Q5BVD1 | protein_coding | tolerated_low_confidence(0.15) | benign(0.019) | TCGA-A7-A4SC-01 | Breast | breast invasive carcinoma | Female | <65 | I/II | Hormone Therapy | tamoxiphen | SD |
| C3orf52 | SNV | Missense_Mutation | c.118G>A | p.Glu40Lys | p.E40K | Q5BVD1 | protein_coding | deleterious_low_confidence(0.04) | possibly_damaging(0.745) | TCGA-BH-A0W7-01 | Breast | breast invasive carcinoma | Female | <65 | I/II | Chemotherapy | taxotere | CR | |
| C3orf52 | SNV | Missense_Mutation | c.599C>T | p.Ser200Leu | p.S200L | Q5BVD1 | protein_coding | benign(0.01) | TCGA-EW-A1OV-01 | Breast | breast invasive carcinoma | Female | <65 | I/II | Chemotherapy | epirubicin | SD | ||
| C3orf52 | SNV | Missense_Mutation | rs746731235 | c.391G>A | p.Glu131Lys | p.E131K | Q5BVD1 | protein_coding | tolerated_low_confidence(0.39) | benign(0.001) | TCGA-2W-A8YY-01 | Cervix | cervical & endocervical cancer | Female | <65 | I/II | Chemotherapy | cisplatin | CR |
| C3orf52 | SNV | Missense_Mutation | novel | c.37C>G | p.Leu13Val | p.L13V | Q5BVD1 | protein_coding | deleterious_low_confidence(0.01) | benign(0.319) | TCGA-AA-3949-01 | Colorectum | colon adenocarcinoma | Female | >=65 | III/IV | Unknown | Unknown | SD |
| C3orf52 | SNV | Missense_Mutation | novel | c.482N>C | p.Lys161Thr | p.K161T | Q5BVD1 | protein_coding | benign(0.224) | TCGA-A5-A0G2-01 | Endometrium | uterine corpus endometrioid carcinoma | Female | <65 | III/IV | Unknown | Unknown | SD | |
| C3orf52 | SNV | Missense_Mutation | c.583N>A | p.Leu195Ile | p.L195I | Q5BVD1 | protein_coding | benign(0.282) | TCGA-AP-A059-01 | Endometrium | uterine corpus endometrioid carcinoma | Female | >=65 | I/II | Unknown | Unknown | SD | ||
| C3orf52 | SNV | Missense_Mutation | rs746731235 | c.391N>A | p.Glu131Lys | p.E131K | Q5BVD1 | protein_coding | tolerated_low_confidence(0.39) | benign(0.001) | TCGA-AX-A05Z-01 | Endometrium | uterine corpus endometrioid carcinoma | Female | <65 | III/IV | Chemotherapy | adriamycin | SD |
| C3orf52 | SNV | Missense_Mutation | c.271N>C | p.Thr91Pro | p.T91P | Q5BVD1 | protein_coding | deleterious_low_confidence(0.02) | probably_damaging(0.953) | TCGA-B5-A11N-01 | Endometrium | uterine corpus endometrioid carcinoma | Female | >=65 | I/II | Unknown | Unknown | SD |
| Page: 1 2 |
Top |
Related drugs of malignant transformation related genes |
| Identification of chemicals and drugs interact with genes involved in malignant transfromation |
| (DGIdb 4.0) |
| Entrez ID | Symbol | Category | Interaction Types | Drug Claim Name | Drug Name | PMIDs |
| Page: 1 |

Copyright 2023-Present -The University of Texas Health Science Center at Houston |