
|
|||||
|
 | |
| |
| |
| |
| |
| |
|
Gene: C3 |
Gene summary for C3 |
| Gene information | Species | Human | Gene symbol | C3 | Gene ID | 718 |
| Gene name | complement C3 | |
| Gene Alias | AHUS5 | |
| Cytomap | 19p13.3 | |
| Gene Type | protein-coding | GO ID | GO:0000003 | UniProtAcc | B4DR57 |
Top |
Malignant transformation analysis |
| Identification of the aberrant gene expression in precancerous and cancerous lesions by comparing the gene expression of stem-like cells in diseased tissues with normal stem cells |
| Entrez ID | Symbol | Replicates | Species | Organ | Tissue | Adj P-value | Log2FC | Malignancy |
| 718 | C3 | CA_HPV_1 | Human | Cervix | CC | 2.81e-16 | -6.77e-01 | 0.0264 |
| 718 | C3 | CA_HPV_2 | Human | Cervix | CC | 5.69e-14 | -6.93e-01 | 0.0391 |
| 718 | C3 | CA_HPV_3 | Human | Cervix | CC | 1.59e-11 | -6.38e-01 | 0.0414 |
| 718 | C3 | HSIL_HPV_2 | Human | Cervix | HSIL_HPV | 1.15e-05 | -3.77e-01 | 0.0208 |
| 718 | C3 | N_HPV_1 | Human | Cervix | N_HPV | 5.84e-08 | -5.69e-01 | 0.0079 |
| 718 | C3 | N_HPV_2 | Human | Cervix | N_HPV | 7.40e-09 | -5.13e-01 | -0.0131 |
| 718 | C3 | CCI_1 | Human | Cervix | CC | 4.72e-05 | -7.56e-01 | 0.528 |
| 718 | C3 | CCI_2 | Human | Cervix | CC | 2.04e-06 | -7.76e-01 | 0.5249 |
| 718 | C3 | CCII_1 | Human | Cervix | CC | 1.08e-10 | -7.53e-01 | 0.3249 |
| 718 | C3 | Tumor | Human | Cervix | CC | 2.51e-17 | -6.99e-01 | 0.1241 |
| 718 | C3 | sample1 | Human | Cervix | CC | 1.27e-03 | -8.83e-02 | 0.0959 |
| 718 | C3 | sample3 | Human | Cervix | CC | 1.11e-15 | -6.38e-01 | 0.1387 |
| 718 | C3 | L1 | Human | Cervix | CC | 5.63e-10 | -7.17e-01 | 0.0802 |
| 718 | C3 | T1 | Human | Cervix | CC | 7.61e-07 | 3.87e-02 | 0.0918 |
| 718 | C3 | T3 | Human | Cervix | CC | 1.15e-14 | -6.42e-01 | 0.1389 |
| 718 | C3 | AEH-subject1 | Human | Endometrium | AEH | 7.07e-65 | 1.25e+00 | -0.3059 |
| 718 | C3 | AEH-subject2 | Human | Endometrium | AEH | 1.57e-48 | 1.18e+00 | -0.2525 |
| 718 | C3 | AEH-subject3 | Human | Endometrium | AEH | 1.88e-35 | 8.97e-01 | -0.2576 |
| 718 | C3 | AEH-subject4 | Human | Endometrium | AEH | 1.17e-22 | 7.89e-01 | -0.2657 |
| 718 | C3 | EEC-subject2 | Human | Endometrium | EEC | 2.38e-40 | 1.01e+00 | -0.2607 |
| Page: 1 2 3 4 5 6 7 |
| Tissue | Expression Dynamics | Abbreviation |
| Cervix |  | CC: Cervix cancer |
| HSIL_HPV: HPV-infected high-grade squamous intraepithelial lesions | ||
| N_HPV: HPV-infected normal cervix | ||
| Endometrium | 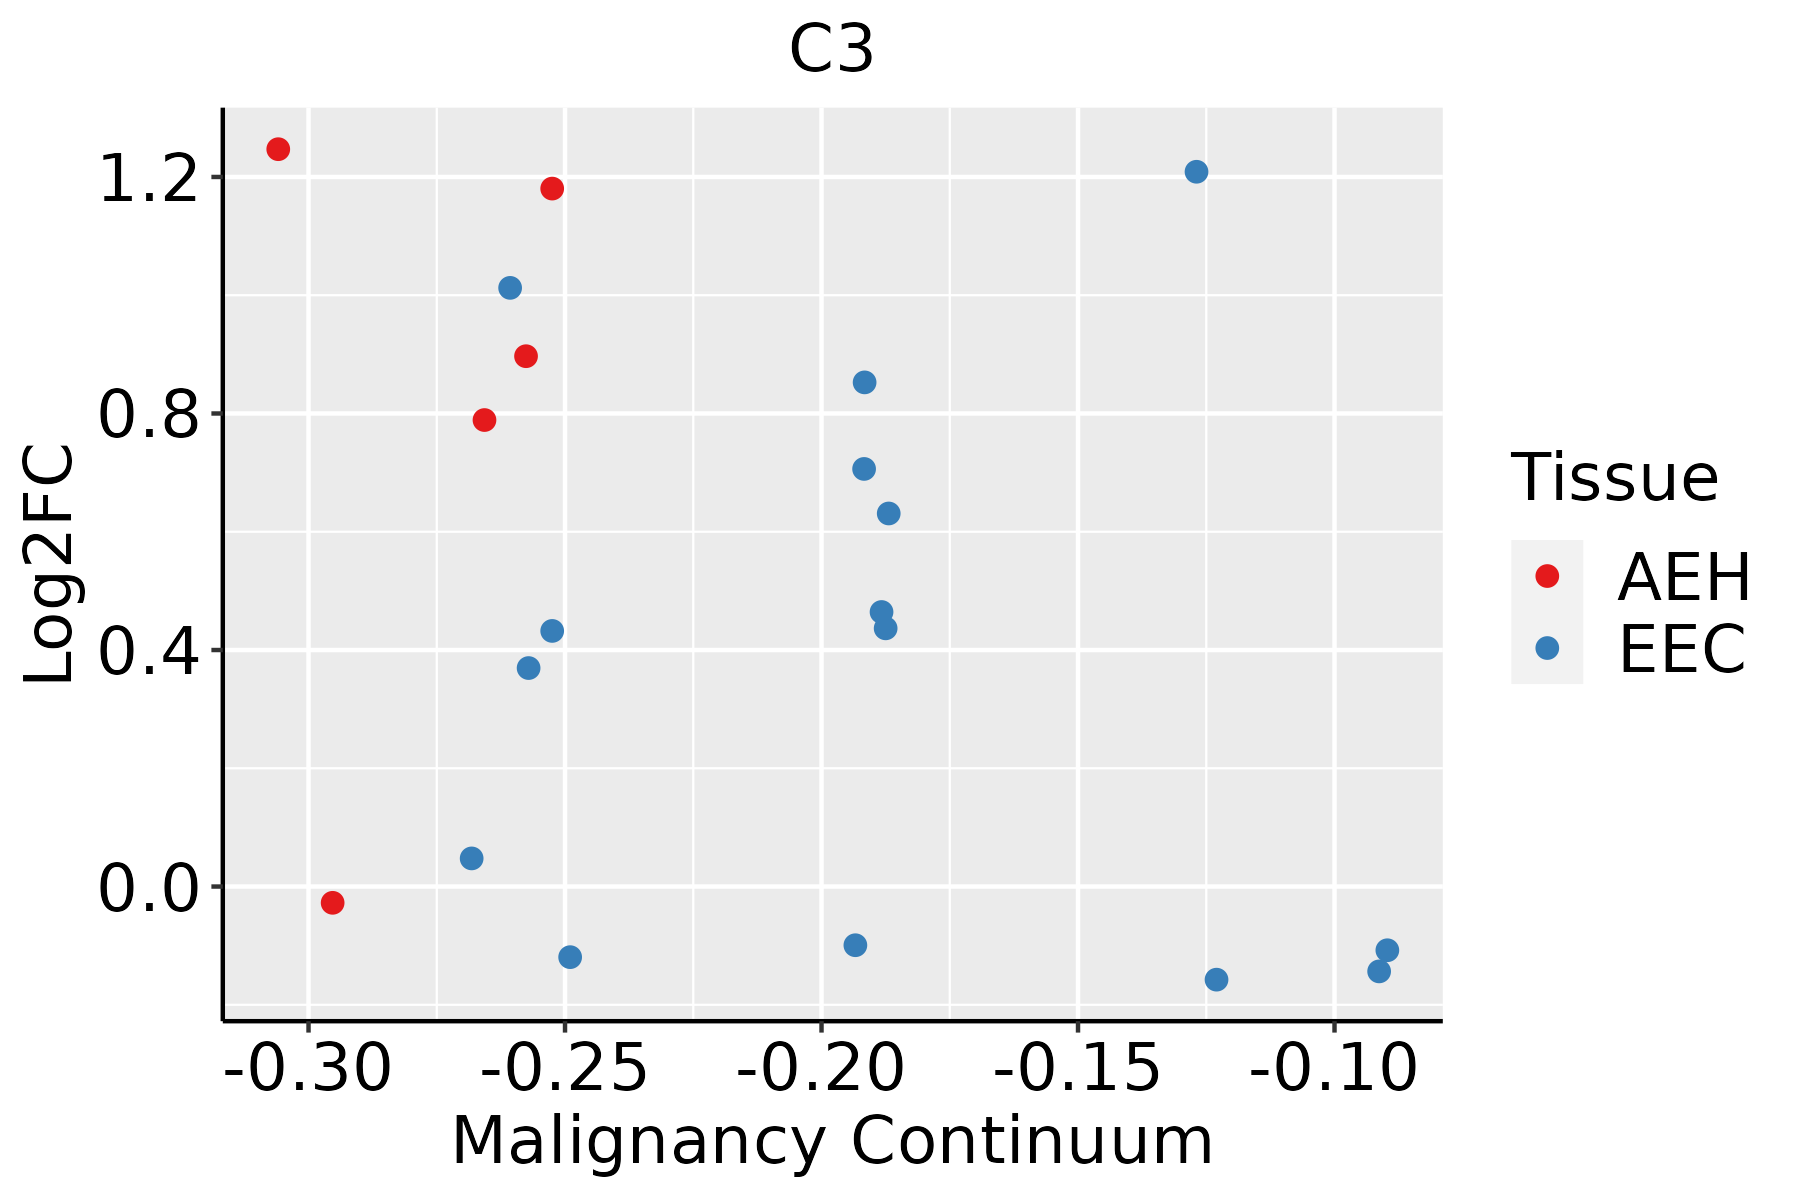 | AEH: Atypical endometrial hyperplasia |
| EEC: Endometrioid Cancer | ||
| Esophagus |  | ESCC: Esophageal squamous cell carcinoma |
| HGIN: High-grade intraepithelial neoplasias | ||
| LGIN: Low-grade intraepithelial neoplasias | ||
| Liver | 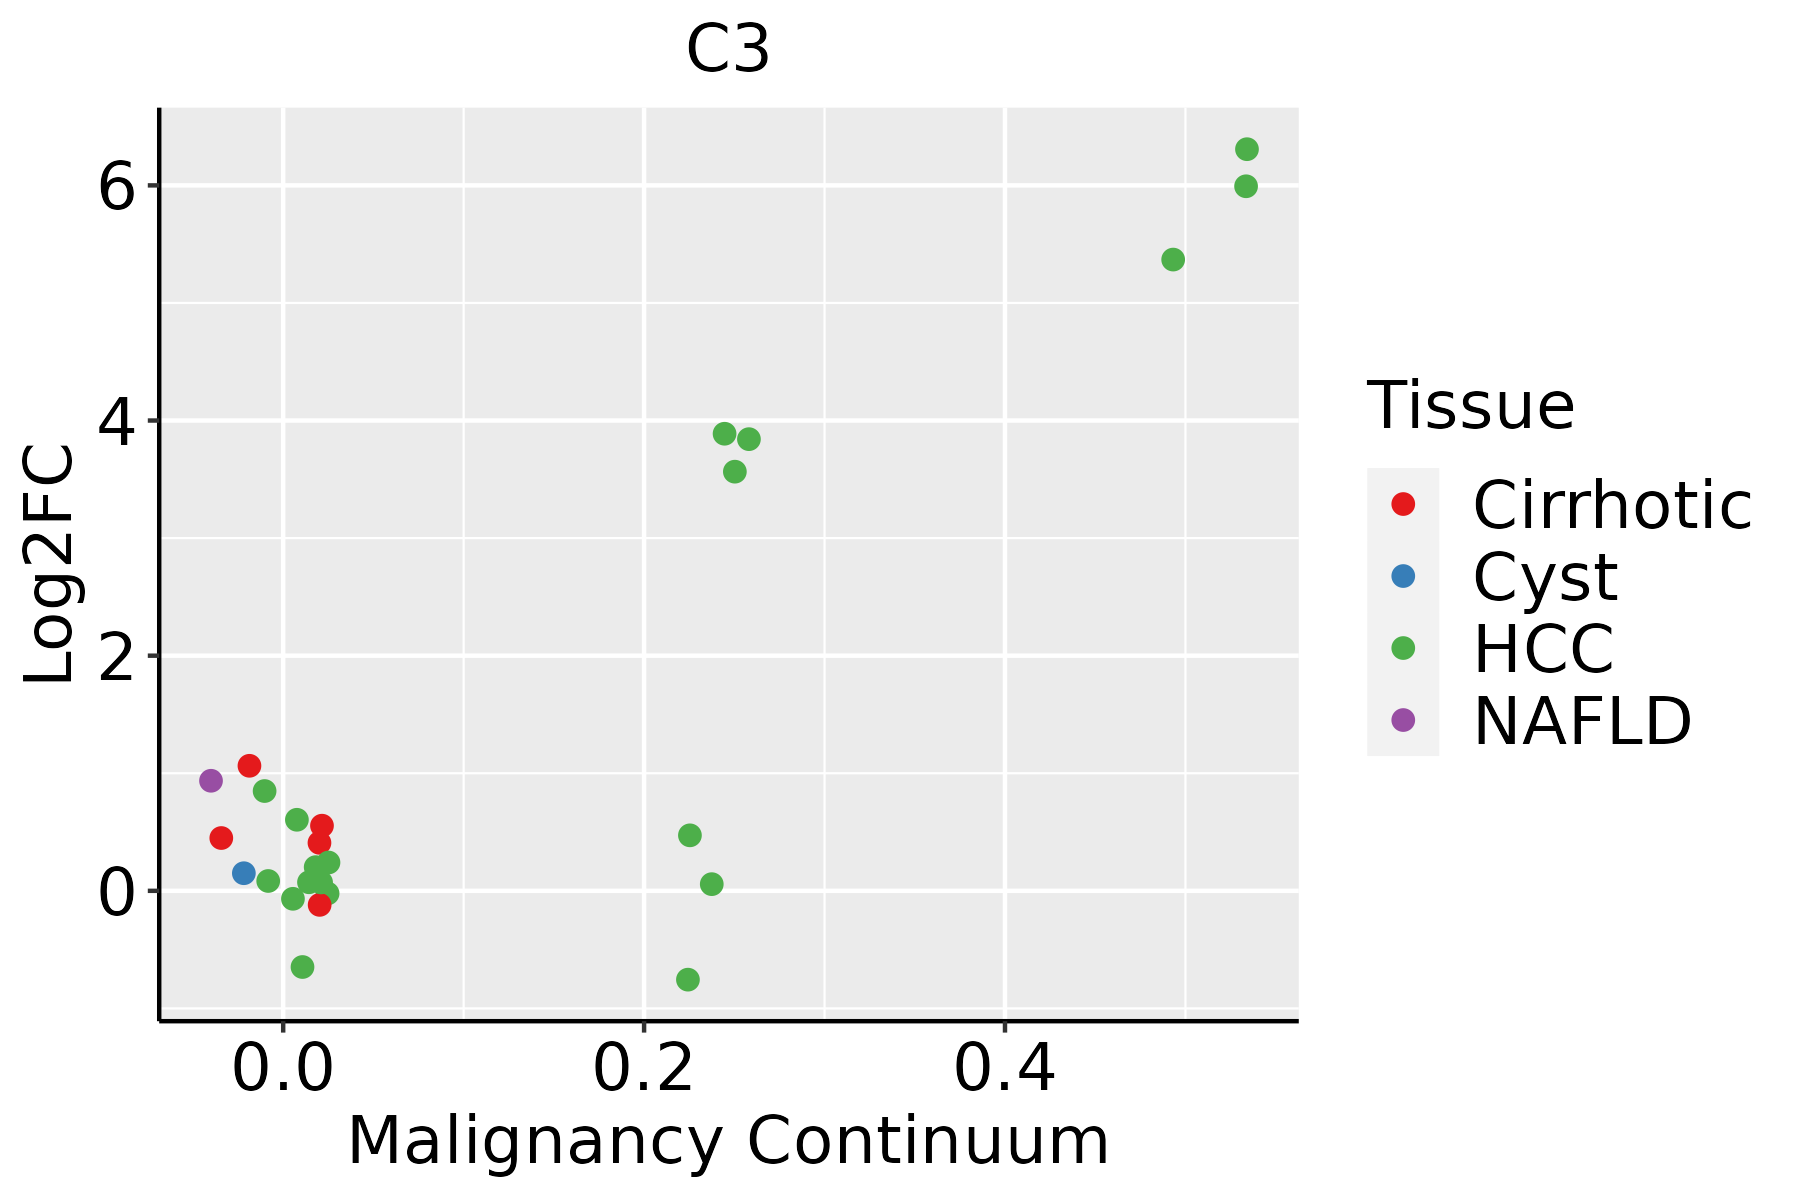 | HCC: Hepatocellular carcinoma |
| NAFLD: Non-alcoholic fatty liver disease | ||
| Lung | 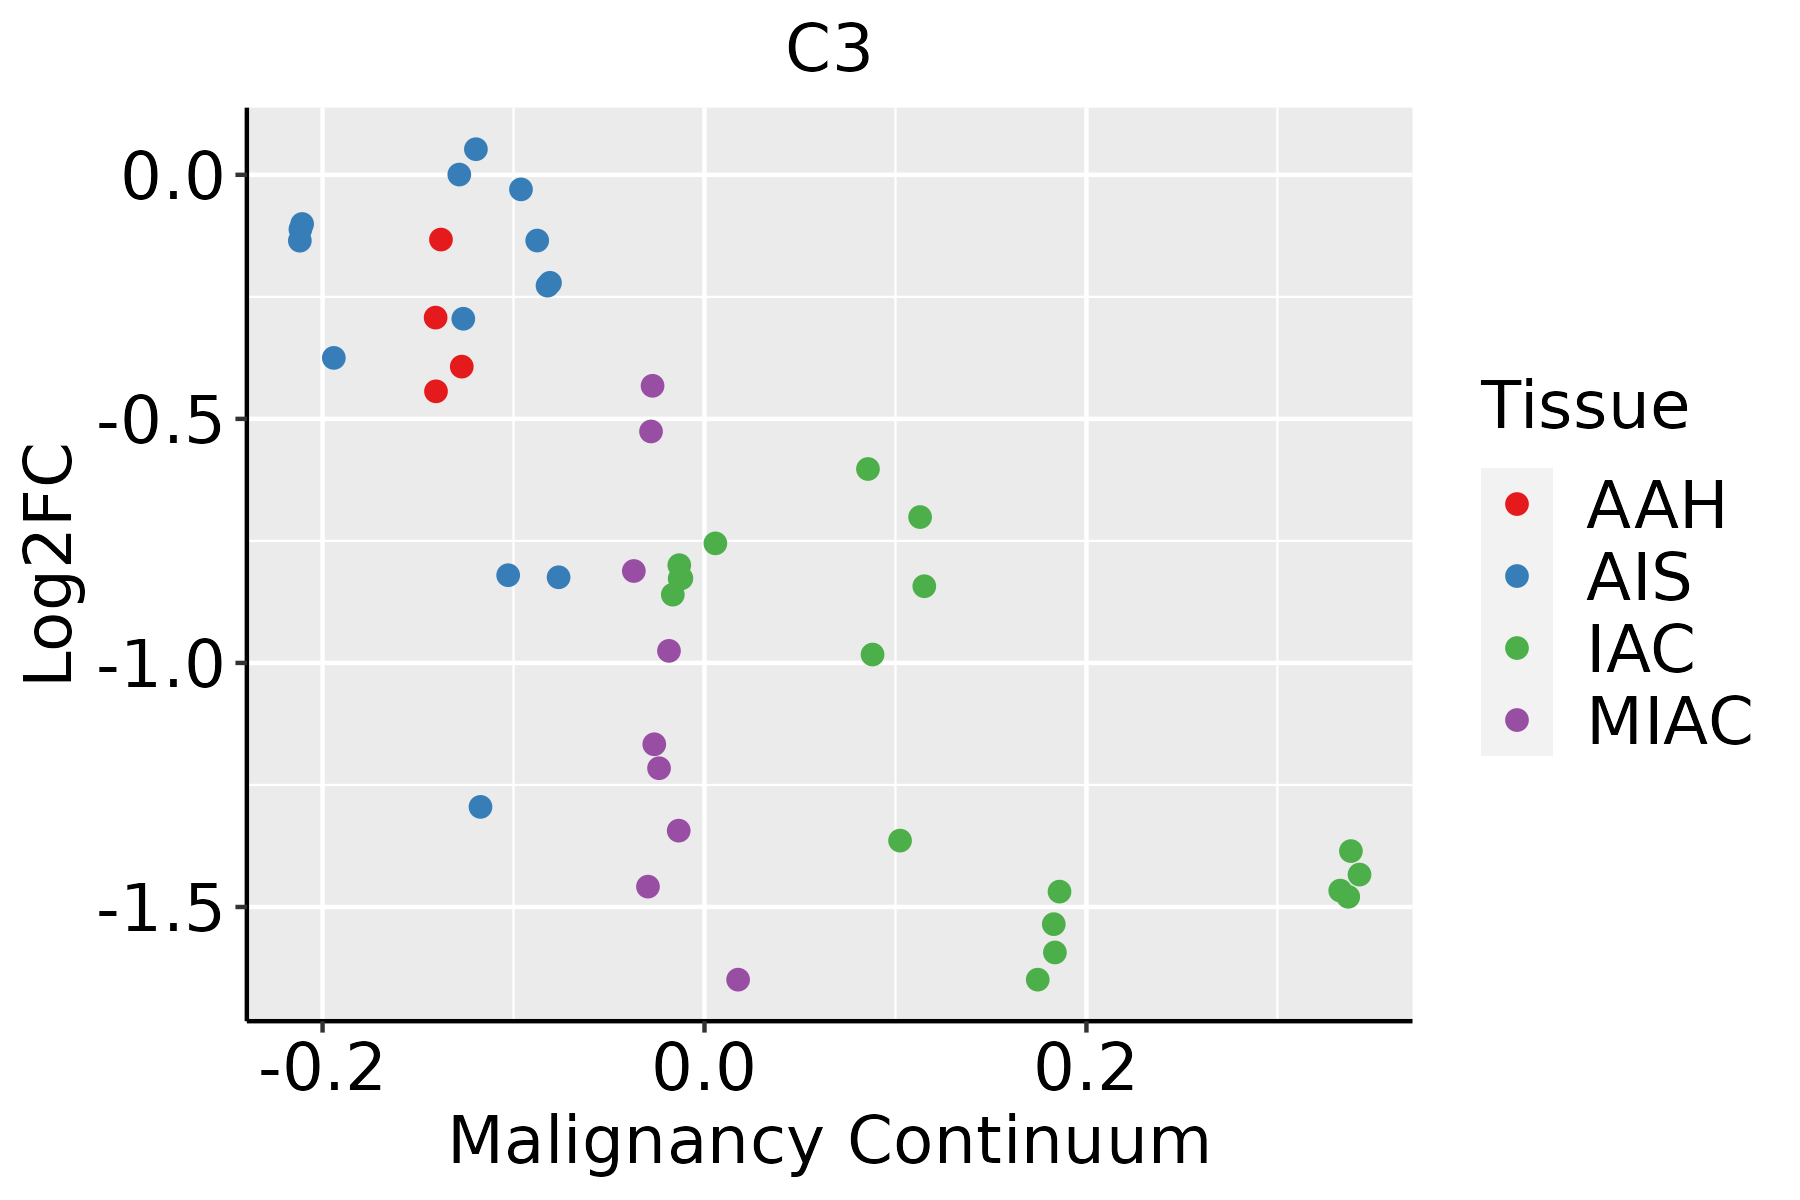 | AAH: Atypical adenomatous hyperplasia |
| AIS: Adenocarcinoma in situ | ||
| IAC: Invasive lung adenocarcinoma | ||
| MIA: Minimally invasive adenocarcinoma | ||
| Oral Cavity | 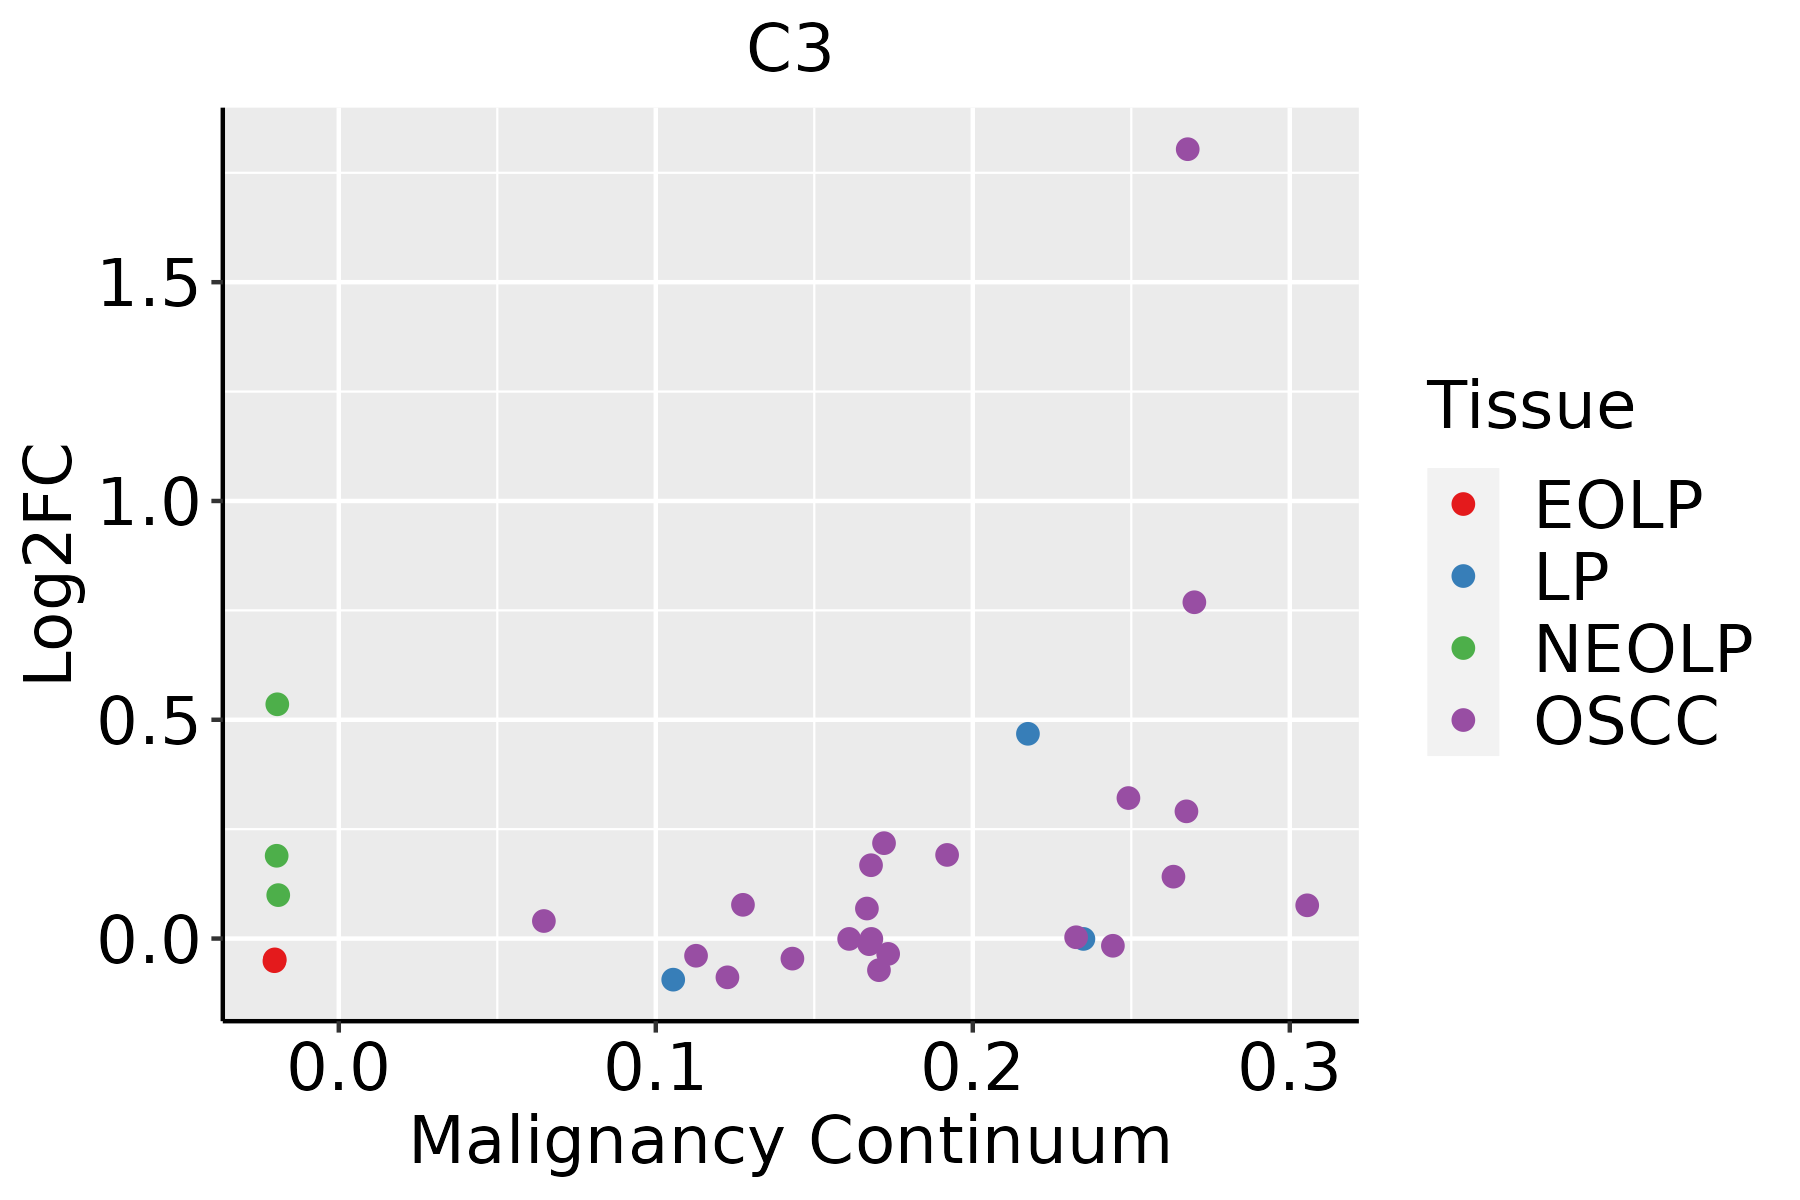 | EOLP: Erosive Oral lichen planus |
| LP: leukoplakia | ||
| NEOLP: Non-erosive oral lichen planus | ||
| OSCC: Oral squamous cell carcinoma | ||
| Skin | 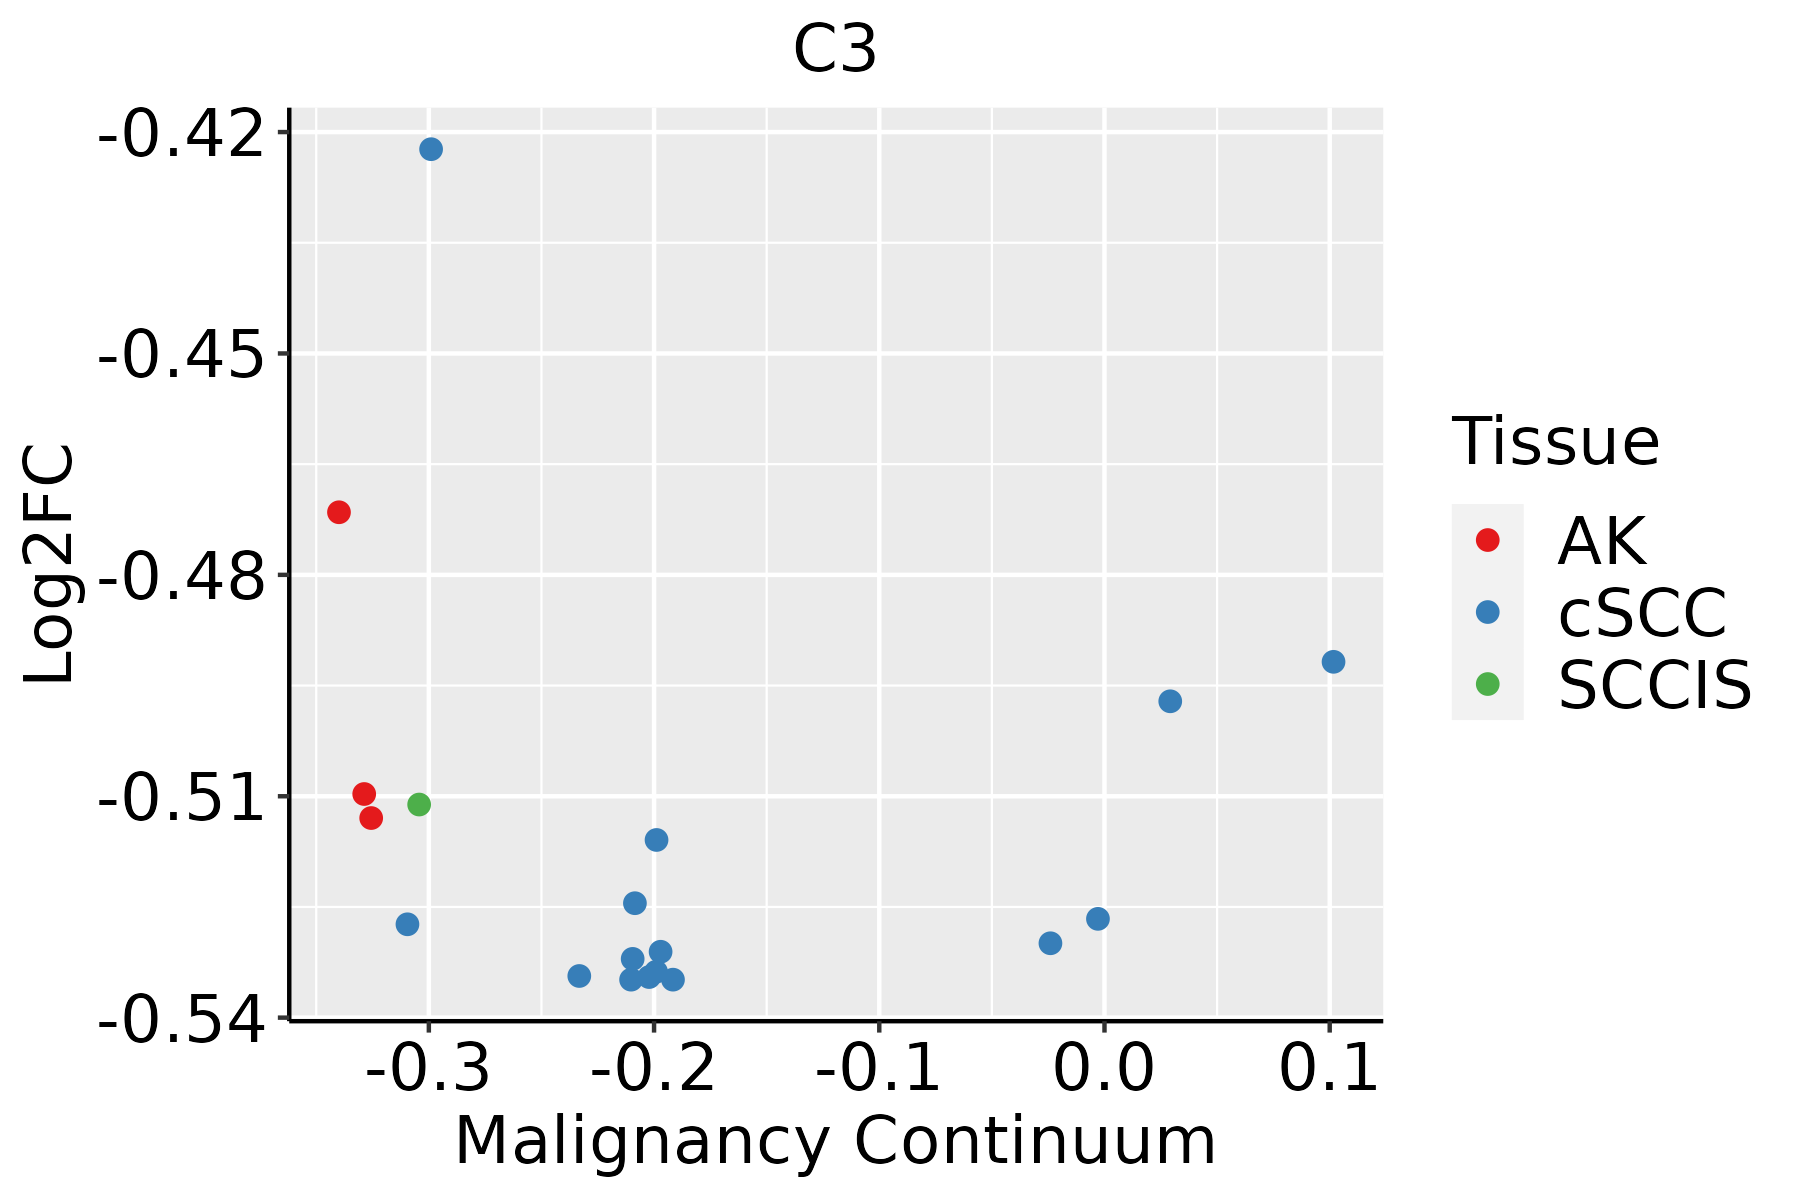 | AK: Actinic keratosis |
| cSCC: Cutaneous squamous cell carcinoma | ||
| SCCIS:squamous cell carcinoma in situ | ||
| Thyroid |  | ATC: Anaplastic thyroid cancer |
| HT: Hashimoto's thyroiditis | ||
| PTC: Papillary thyroid cancer |
| ∗log2FC in expression of this searched gene in stem-like cells from each diseased tissue sample relative to stem-like cells in normal samples in each tissue plotted against the malignancy continuum. Samples are colored based on if they are from different disease stage. |
Top |
Malignant transformation related pathway analysis |
| Find out the enriched GO biological processes and KEGG pathways involved in transition from healthy to precancer to cancer |
| Tissue | Disease Stage | Enriched GO biological Processes |
| Colorectum | AD |  |
| Colorectum | SER |  |
| Colorectum | MSS |  |
| Colorectum | MSI-H |  |
| Colorectum | FAP |  |
| ∗Top 15 enriched GO BP terms are showed in the bar plot of each disease state in each tissue. Each row represents a significant GO biological process which is colored according to the -log10(p.adjust). |
| Page: 1 2 3 4 5 6 7 8 9 |
| GO ID | Tissue | Disease Stage | Description | Gene Ratio | Bg Ratio | pvalue | p.adjust | Count |
| GO:00460349 | Breast | Precancer | ATP metabolic process | 82/1080 | 277/18723 | 1.94e-36 | 5.19e-33 | 82 |
| GO:00971939 | Breast | Precancer | intrinsic apoptotic signaling pathway | 59/1080 | 288/18723 | 8.07e-18 | 3.60e-15 | 59 |
| GO:20012339 | Breast | Precancer | regulation of apoptotic signaling pathway | 65/1080 | 356/18723 | 7.70e-17 | 3.17e-14 | 65 |
| GO:20012429 | Breast | Precancer | regulation of intrinsic apoptotic signaling pathway | 41/1080 | 164/18723 | 6.48e-16 | 2.31e-13 | 41 |
| GO:19026008 | Breast | Precancer | proton transmembrane transport | 39/1080 | 157/18723 | 4.18e-15 | 1.18e-12 | 39 |
| GO:00069799 | Breast | Precancer | response to oxidative stress | 70/1080 | 446/18723 | 1.59e-14 | 4.26e-12 | 70 |
| GO:00525479 | Breast | Precancer | regulation of peptidase activity | 71/1080 | 461/18723 | 2.72e-14 | 6.94e-12 | 71 |
| GO:00159857 | Breast | Precancer | energy coupled proton transport, down electrochemical gradient | 16/1080 | 26/18723 | 4.15e-14 | 9.65e-12 | 16 |
| GO:00159867 | Breast | Precancer | ATP synthesis coupled proton transport | 16/1080 | 26/18723 | 4.15e-14 | 9.65e-12 | 16 |
| GO:00525489 | Breast | Precancer | regulation of endopeptidase activity | 67/1080 | 432/18723 | 1.06e-13 | 2.36e-11 | 67 |
| GO:00083809 | Breast | Precancer | RNA splicing | 65/1080 | 434/18723 | 1.27e-12 | 2.53e-10 | 65 |
| GO:00067547 | Breast | Precancer | ATP biosynthetic process | 21/1080 | 57/18723 | 2.31e-12 | 4.26e-10 | 21 |
| GO:00434849 | Breast | Precancer | regulation of RNA splicing | 34/1080 | 148/18723 | 2.66e-12 | 4.75e-10 | 34 |
| GO:20001169 | Breast | Precancer | regulation of cysteine-type endopeptidase activity | 43/1080 | 235/18723 | 1.30e-11 | 1.83e-09 | 43 |
| GO:00068398 | Breast | Precancer | mitochondrial transport | 45/1080 | 254/18723 | 1.37e-11 | 1.88e-09 | 45 |
| GO:00092067 | Breast | Precancer | purine ribonucleoside triphosphate biosynthetic process | 22/1080 | 68/18723 | 1.41e-11 | 1.88e-09 | 22 |
| GO:00432819 | Breast | Precancer | regulation of cysteine-type endopeptidase activity involved in apoptotic process | 40/1080 | 209/18723 | 1.59e-11 | 2.07e-09 | 40 |
| GO:00091457 | Breast | Precancer | purine nucleoside triphosphate biosynthetic process | 22/1080 | 69/18723 | 1.95e-11 | 2.43e-09 | 22 |
| GO:00485459 | Breast | Precancer | response to steroid hormone | 53/1080 | 339/18723 | 3.07e-11 | 3.66e-09 | 53 |
| GO:00092017 | Breast | Precancer | ribonucleoside triphosphate biosynthetic process | 22/1080 | 74/18723 | 9.18e-11 | 1.00e-08 | 22 |
| Pathway ID | Tissue | Disease Stage | Description | Gene Ratio | Bg Ratio | pvalue | p.adjust | qvalue | Count |
| hsa0517120 | Cervix | CC | Coronavirus disease - COVID-19 | 111/1267 | 232/8465 | 1.82e-33 | 5.90e-31 | 3.49e-31 | 111 |
| hsa0513120 | Cervix | CC | Shigellosis | 69/1267 | 247/8465 | 7.64e-08 | 1.03e-06 | 6.10e-07 | 69 |
| hsa0414520 | Cervix | CC | Phagosome | 47/1267 | 152/8465 | 3.95e-07 | 4.26e-06 | 2.52e-06 | 47 |
| hsa0513416 | Cervix | CC | Legionellosis | 20/1267 | 57/8465 | 1.29e-04 | 8.19e-04 | 4.85e-04 | 20 |
| hsa05152 | Cervix | CC | Tuberculosis | 42/1267 | 180/8465 | 1.78e-03 | 7.21e-03 | 4.26e-03 | 42 |
| hsa051337 | Cervix | CC | Pertussis | 21/1267 | 76/8465 | 3.08e-03 | 1.19e-02 | 7.03e-03 | 21 |
| hsa05171110 | Cervix | CC | Coronavirus disease - COVID-19 | 111/1267 | 232/8465 | 1.82e-33 | 5.90e-31 | 3.49e-31 | 111 |
| hsa05131110 | Cervix | CC | Shigellosis | 69/1267 | 247/8465 | 7.64e-08 | 1.03e-06 | 6.10e-07 | 69 |
| hsa04145110 | Cervix | CC | Phagosome | 47/1267 | 152/8465 | 3.95e-07 | 4.26e-06 | 2.52e-06 | 47 |
| hsa0513417 | Cervix | CC | Legionellosis | 20/1267 | 57/8465 | 1.29e-04 | 8.19e-04 | 4.85e-04 | 20 |
| hsa051521 | Cervix | CC | Tuberculosis | 42/1267 | 180/8465 | 1.78e-03 | 7.21e-03 | 4.26e-03 | 42 |
| hsa0513312 | Cervix | CC | Pertussis | 21/1267 | 76/8465 | 3.08e-03 | 1.19e-02 | 7.03e-03 | 21 |
| hsa0517125 | Cervix | HSIL_HPV | Coronavirus disease - COVID-19 | 91/459 | 232/8465 | 2.14e-56 | 3.13e-54 | 2.53e-54 | 91 |
| hsa051504 | Cervix | HSIL_HPV | Staphylococcus aureus infection | 21/459 | 96/8465 | 2.93e-08 | 1.43e-06 | 1.16e-06 | 21 |
| hsa0414523 | Cervix | HSIL_HPV | Phagosome | 27/459 | 152/8465 | 3.58e-08 | 1.50e-06 | 1.21e-06 | 27 |
| hsa0514022 | Cervix | HSIL_HPV | Leishmaniasis | 18/459 | 77/8465 | 9.82e-08 | 3.14e-06 | 2.54e-06 | 18 |
| hsa0513423 | Cervix | HSIL_HPV | Legionellosis | 12/459 | 57/8465 | 4.24e-05 | 6.21e-04 | 5.02e-04 | 12 |
| hsa05322 | Cervix | HSIL_HPV | Systemic lupus erythematosus | 19/459 | 137/8465 | 1.40e-04 | 1.74e-03 | 1.40e-03 | 19 |
| hsa0513125 | Cervix | HSIL_HPV | Shigellosis | 27/459 | 247/8465 | 3.78e-04 | 3.49e-03 | 2.82e-03 | 27 |
| hsa051522 | Cervix | HSIL_HPV | Tuberculosis | 19/459 | 180/8465 | 3.99e-03 | 2.39e-02 | 1.93e-02 | 19 |
| Page: 1 2 3 4 5 6 7 8 |
Top |
Cell-cell communication analysis |
| Identification of potential cell-cell interactions between two cell types and their ligand-receptor pairs for different disease states |
| Ligand | Receptor | LRpair | Pathway | Tissue | Disease Stage |
| C3 | C3AR1 | C3_C3AR1 | COMPLEMENT | Breast | DCIS |
| C3 | ITGAM_ITGB2 | C3_ITGAM_ITGB2 | COMPLEMENT | Breast | DCIS |
| C3 | ITGAX_ITGB2 | C3_ITGAX_ITGB2 | COMPLEMENT | Breast | DCIS |
| PTN | SDC3 | PTN_SDC3 | PTN | Breast | DCIS |
| ANGPTL4 | SDC3 | ANGPTL4_SDC3 | ANGPTL | Breast | DCIS |
| C3 | C3AR1 | C3_C3AR1 | COMPLEMENT | Breast | Healthy |
| C3 | ITGAM_ITGB2 | C3_ITGAM_ITGB2 | COMPLEMENT | Breast | Healthy |
| C3 | ITGAX_ITGB2 | C3_ITGAX_ITGB2 | COMPLEMENT | Breast | Healthy |
| ANGPTL4 | SDC3 | ANGPTL4_SDC3 | ANGPTL | Breast | IDC |
| C3 | C3AR1 | C3_C3AR1 | COMPLEMENT | Breast | IDC |
| C3 | ITGAM_ITGB2 | C3_ITGAM_ITGB2 | COMPLEMENT | Breast | IDC |
| C3 | ITGAX_ITGB2 | C3_ITGAX_ITGB2 | COMPLEMENT | Breast | IDC |
| DSG2 | DSC3 | DSG2_DSC3 | DESMOSOME | Breast | IDC |
| C3 | C3AR1 | C3_C3AR1 | COMPLEMENT | Cervix | ADJ |
| C3 | ITGAM_ITGB2 | C3_ITGAM_ITGB2 | COMPLEMENT | Cervix | ADJ |
| C3 | ITGAX_ITGB2 | C3_ITGAX_ITGB2 | COMPLEMENT | Cervix | ADJ |
| PTN | SDC3 | PTN_SDC3 | PTN | Cervix | CC |
| DSG2 | DSC3 | DSG2_DSC3 | DESMOSOME | Cervix | CC |
| ANGPTL4 | SDC3 | ANGPTL4_SDC3 | ANGPTL | Cervix | CC |
| C3 | C3AR1 | C3_C3AR1 | COMPLEMENT | Cervix | CC |
| Page: 1 2 3 4 5 |
Top |
Single-cell gene regulatory network inference analysis |
| Find out the significant the regulons (TFs) and the target genes of each regulon across cell types for different disease states |
| TF | Cell Type | Tissue | Disease Stage | Target Gene | RSS | Regulon Activity |
| ∗The dot plots of a searched regulon are shown for all cell subpopulations in each disease state of each tissue based on the regulon specific score inferred using pySCENIC and by calculating the average expression. |
| Page: 1 |
Top |
Somatic mutation of malignant transformation related genes |
| Annotation of somatic variants for genes involved in malignant transformation |
| Hugo Symbol | Variant Class | Variant Classification | dbSNP RS | HGVSc | HGVSp | HGVSp Short | SWISSPROT | BIOTYPE | SIFT | PolyPhen | Tumor Sample Barcode | Tissue | Histology | Sex | Age | Stage | Therapy Types | Drugs | Outcome |
| C3 | SNV | Missense_Mutation | novel | c.2800N>C | p.Glu934Gln | p.E934Q | P01024 | protein_coding | deleterious(0) | probably_damaging(0.993) | TCGA-A2-A0CL-01 | Breast | breast invasive carcinoma | Female | <65 | III/IV | Chemotherapy | cytoxan | SD |
| C3 | SNV | Missense_Mutation | c.1052C>T | p.Ser351Phe | p.S351F | P01024 | protein_coding | deleterious(0) | probably_damaging(0.99) | TCGA-A2-A0SY-01 | Breast | breast invasive carcinoma | Female | <65 | III/IV | Hormone Therapy | arimidex | SD | |
| C3 | SNV | Missense_Mutation | rs199911426 | c.4594N>T | p.Arg1532Trp | p.R1532W | P01024 | protein_coding | deleterious(0) | probably_damaging(1) | TCGA-A8-A06P-01 | Breast | breast invasive carcinoma | Female | <65 | III/IV | Unspecific | SD | |
| C3 | SNV | Missense_Mutation | c.4276N>A | p.Asp1426Asn | p.D1426N | P01024 | protein_coding | deleterious(0.01) | probably_damaging(0.929) | TCGA-A8-A0A7-01 | Breast | breast invasive carcinoma | Female | <65 | I/II | Unknown | Unknown | SD | |
| C3 | SNV | Missense_Mutation | c.3803N>G | p.Ser1268Cys | p.S1268C | P01024 | protein_coding | deleterious(0) | probably_damaging(1) | TCGA-AC-A23H-01 | Breast | breast invasive carcinoma | Female | >=65 | I/II | Unknown | Unknown | PD | |
| C3 | SNV | Missense_Mutation | c.1376N>T | p.Ser459Leu | p.S459L | P01024 | protein_coding | tolerated(0.09) | possibly_damaging(0.599) | TCGA-AC-A23H-01 | Breast | breast invasive carcinoma | Female | >=65 | I/II | Unknown | Unknown | PD | |
| C3 | SNV | Missense_Mutation | novel | c.4408N>A | p.Glu1470Lys | p.E1470K | P01024 | protein_coding | deleterious(0) | benign(0.188) | TCGA-AN-A046-01 | Breast | breast invasive carcinoma | Female | >=65 | I/II | Unknown | Unknown | SD |
| C3 | SNV | Missense_Mutation | novel | c.3118G>C | p.Glu1040Gln | p.E1040Q | P01024 | protein_coding | tolerated(0.11) | benign(0.063) | TCGA-AO-A0J9-01 | Breast | breast invasive carcinoma | Female | <65 | III/IV | Chemotherapy | cyclophosphamide | PD |
| C3 | SNV | Missense_Mutation | novel | c.2782N>G | p.Ser928Ala | p.S928A | P01024 | protein_coding | tolerated(0.22) | benign(0.007) | TCGA-BH-A0DG-01 | Breast | breast invasive carcinoma | Female | <65 | I/II | Chemotherapy | taxotere | CR |
| C3 | SNV | Missense_Mutation | c.1452N>T | p.Glu484Asp | p.E484D | P01024 | protein_coding | tolerated(0.52) | benign(0.003) | TCGA-D8-A1XG-01 | Breast | breast invasive carcinoma | Female | >=65 | III/IV | Unknown | Unknown | SD |
| Page: 1 2 3 4 5 6 7 8 9 10 11 12 13 14 15 16 17 18 19 20 21 22 23 |
Top |
Related drugs of malignant transformation related genes |
| Identification of chemicals and drugs interact with genes involved in malignant transfromation |
| (DGIdb 4.0) |
| Entrez ID | Symbol | Category | Interaction Types | Drug Claim Name | Drug Name | PMIDs |
| 718 | C3 | PROTEASE INHIBITOR, DRUGGABLE GENOME, CELL SURFACE | Imprime PGG immunotherapeutic | |||
| 718 | C3 | PROTEASE INHIBITOR, DRUGGABLE GENOME, CELL SURFACE | POT-4 | 19025129 | ||
| 718 | C3 | PROTEASE INHIBITOR, DRUGGABLE GENOME, CELL SURFACE | COMPSTATIN | COMPSTATIN | 25494040 | |
| 718 | C3 | PROTEASE INHIBITOR, DRUGGABLE GENOME, CELL SURFACE | POT-4 | |||
| 718 | C3 | PROTEASE INHIBITOR, DRUGGABLE GENOME, CELL SURFACE | APL-2 | PEGCETACOPLAN | ||
| 718 | C3 | PROTEASE INHIBITOR, DRUGGABLE GENOME, CELL SURFACE | clozapine | CLOZAPINE | 26503818 |
| Page: 1 |

Copyright 2023-Present -The University of Texas Health Science Center at Houston |