
|
|||||
|
 | |
| |
| |
| |
| |
| |
|
Gene: C2orf68 |
Gene summary for C2ORF68 |
| Gene information | Species | Human | Gene symbol | C2orf68 | Gene ID | 388969 |
| Gene name | chromosome 2 open reading frame 68 | |
| Gene Alias | HCRCN81 | |
| Cytomap | 2p11.2 | |
| Gene Type | protein-coding | GO ID | GO:0003674 | UniProtAcc | L7T9J5 |
Top |
Malignant transformation analysis |
| Identification of the aberrant gene expression in precancerous and cancerous lesions by comparing the gene expression of stem-like cells in diseased tissues with normal stem cells |
| Entrez ID | Symbol | Replicates | Species | Organ | Tissue | Adj P-value | Log2FC | Malignancy |
| 388969 | C2orf68 | LZE2T | Human | Esophagus | ESCC | 2.54e-02 | 4.27e-01 | 0.082 |
| 388969 | C2orf68 | LZE4T | Human | Esophagus | ESCC | 1.80e-07 | 2.03e-01 | 0.0811 |
| 388969 | C2orf68 | LZE7T | Human | Esophagus | ESCC | 3.76e-08 | 2.79e-01 | 0.0667 |
| 388969 | C2orf68 | LZE8T | Human | Esophagus | ESCC | 2.33e-07 | 2.16e-01 | 0.067 |
| 388969 | C2orf68 | LZE20T | Human | Esophagus | ESCC | 2.62e-04 | 2.12e-01 | 0.0662 |
| 388969 | C2orf68 | LZE24T | Human | Esophagus | ESCC | 1.87e-19 | 3.82e-01 | 0.0596 |
| 388969 | C2orf68 | LZE21T | Human | Esophagus | ESCC | 4.92e-04 | 2.38e-01 | 0.0655 |
| 388969 | C2orf68 | LZE6T | Human | Esophagus | ESCC | 5.66e-08 | 3.71e-01 | 0.0845 |
| 388969 | C2orf68 | P1T-E | Human | Esophagus | ESCC | 6.40e-09 | 3.26e-01 | 0.0875 |
| 388969 | C2orf68 | P2T-E | Human | Esophagus | ESCC | 2.59e-33 | 5.75e-01 | 0.1177 |
| 388969 | C2orf68 | P4T-E | Human | Esophagus | ESCC | 3.24e-27 | 4.69e-01 | 0.1323 |
| 388969 | C2orf68 | P5T-E | Human | Esophagus | ESCC | 3.44e-16 | 2.28e-01 | 0.1327 |
| 388969 | C2orf68 | P8T-E | Human | Esophagus | ESCC | 2.12e-10 | 1.42e-01 | 0.0889 |
| 388969 | C2orf68 | P9T-E | Human | Esophagus | ESCC | 3.26e-10 | 1.63e-01 | 0.1131 |
| 388969 | C2orf68 | P10T-E | Human | Esophagus | ESCC | 3.31e-17 | 2.50e-01 | 0.116 |
| 388969 | C2orf68 | P11T-E | Human | Esophagus | ESCC | 3.16e-07 | 2.27e-01 | 0.1426 |
| 388969 | C2orf68 | P12T-E | Human | Esophagus | ESCC | 2.48e-21 | 2.71e-01 | 0.1122 |
| 388969 | C2orf68 | P15T-E | Human | Esophagus | ESCC | 5.91e-19 | 3.86e-01 | 0.1149 |
| 388969 | C2orf68 | P16T-E | Human | Esophagus | ESCC | 7.45e-31 | 4.90e-01 | 0.1153 |
| 388969 | C2orf68 | P17T-E | Human | Esophagus | ESCC | 3.79e-07 | 3.05e-01 | 0.1278 |
| Page: 1 2 3 4 5 |
| Tissue | Expression Dynamics | Abbreviation |
| Esophagus | 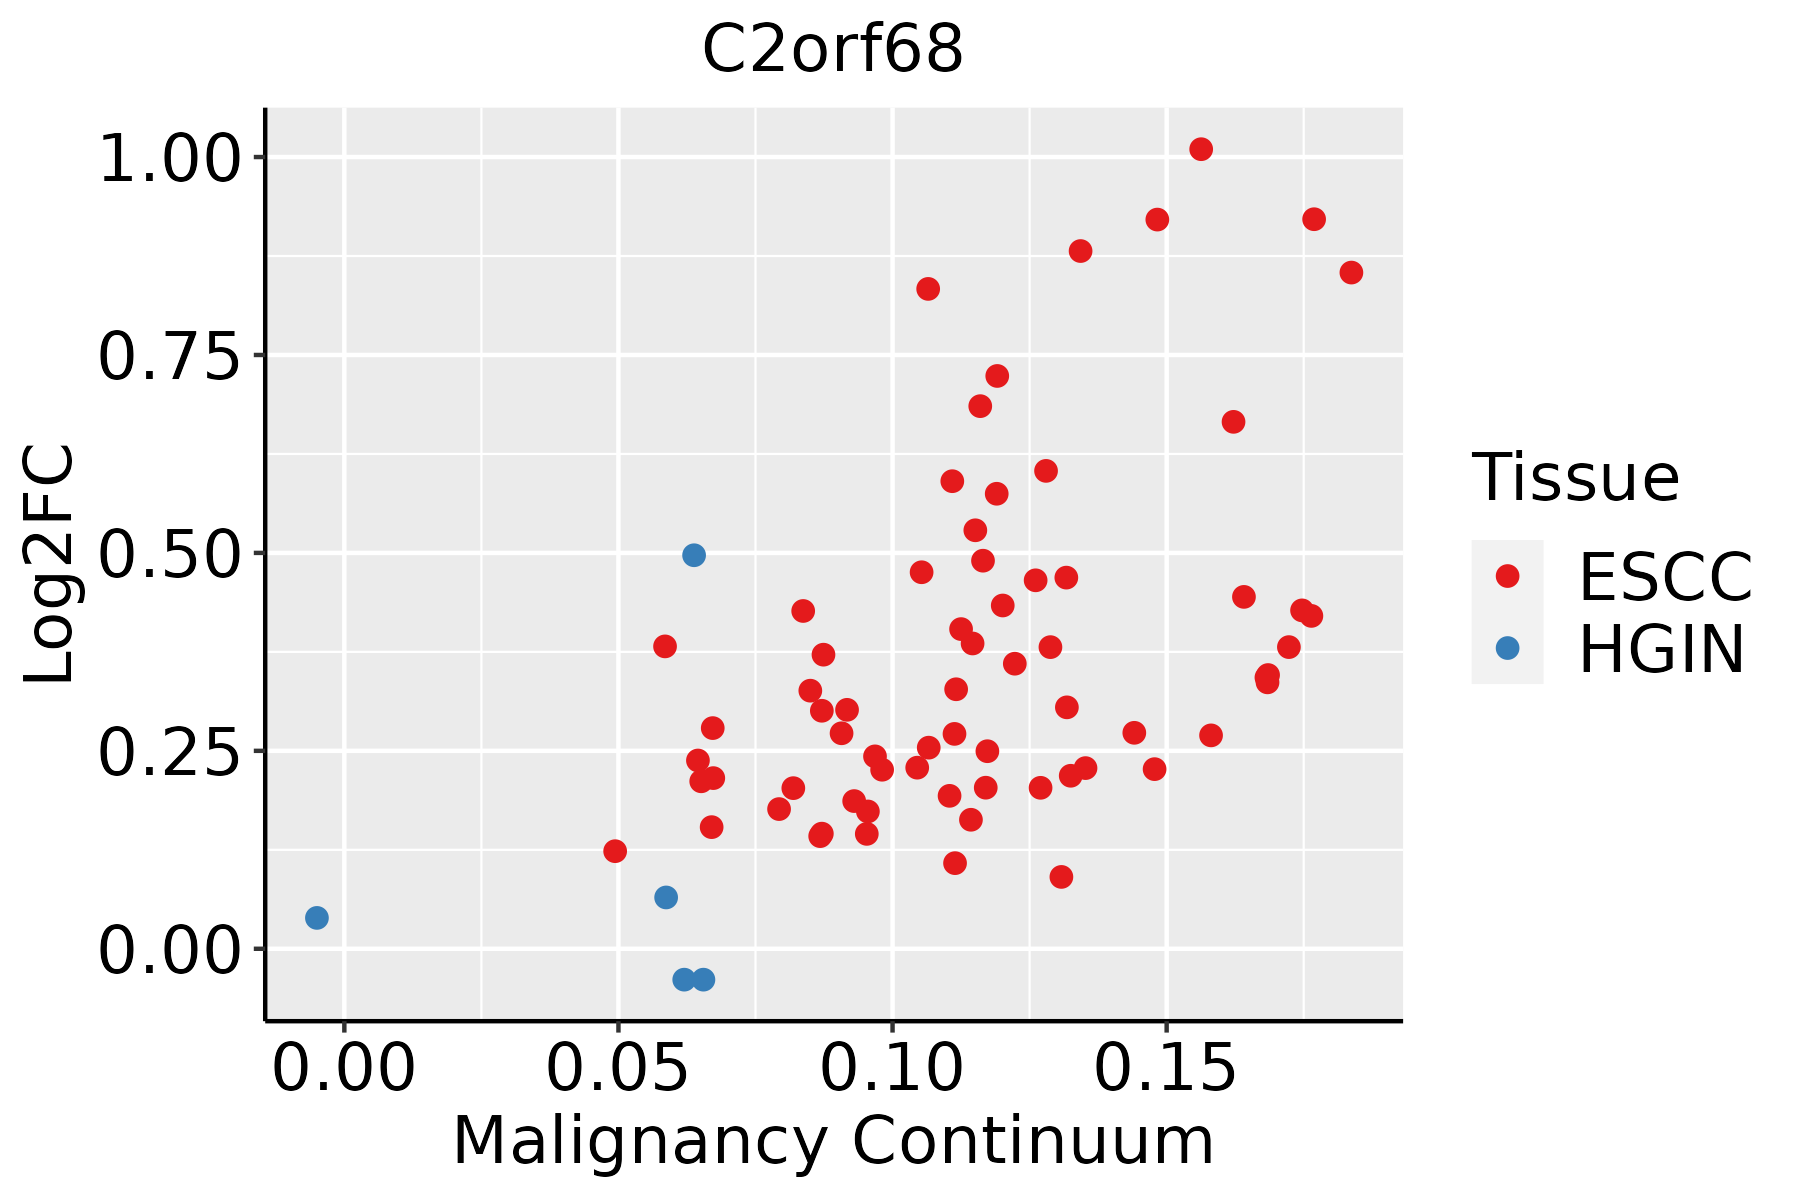 | ESCC: Esophageal squamous cell carcinoma |
| HGIN: High-grade intraepithelial neoplasias | ||
| LGIN: Low-grade intraepithelial neoplasias | ||
| Liver | 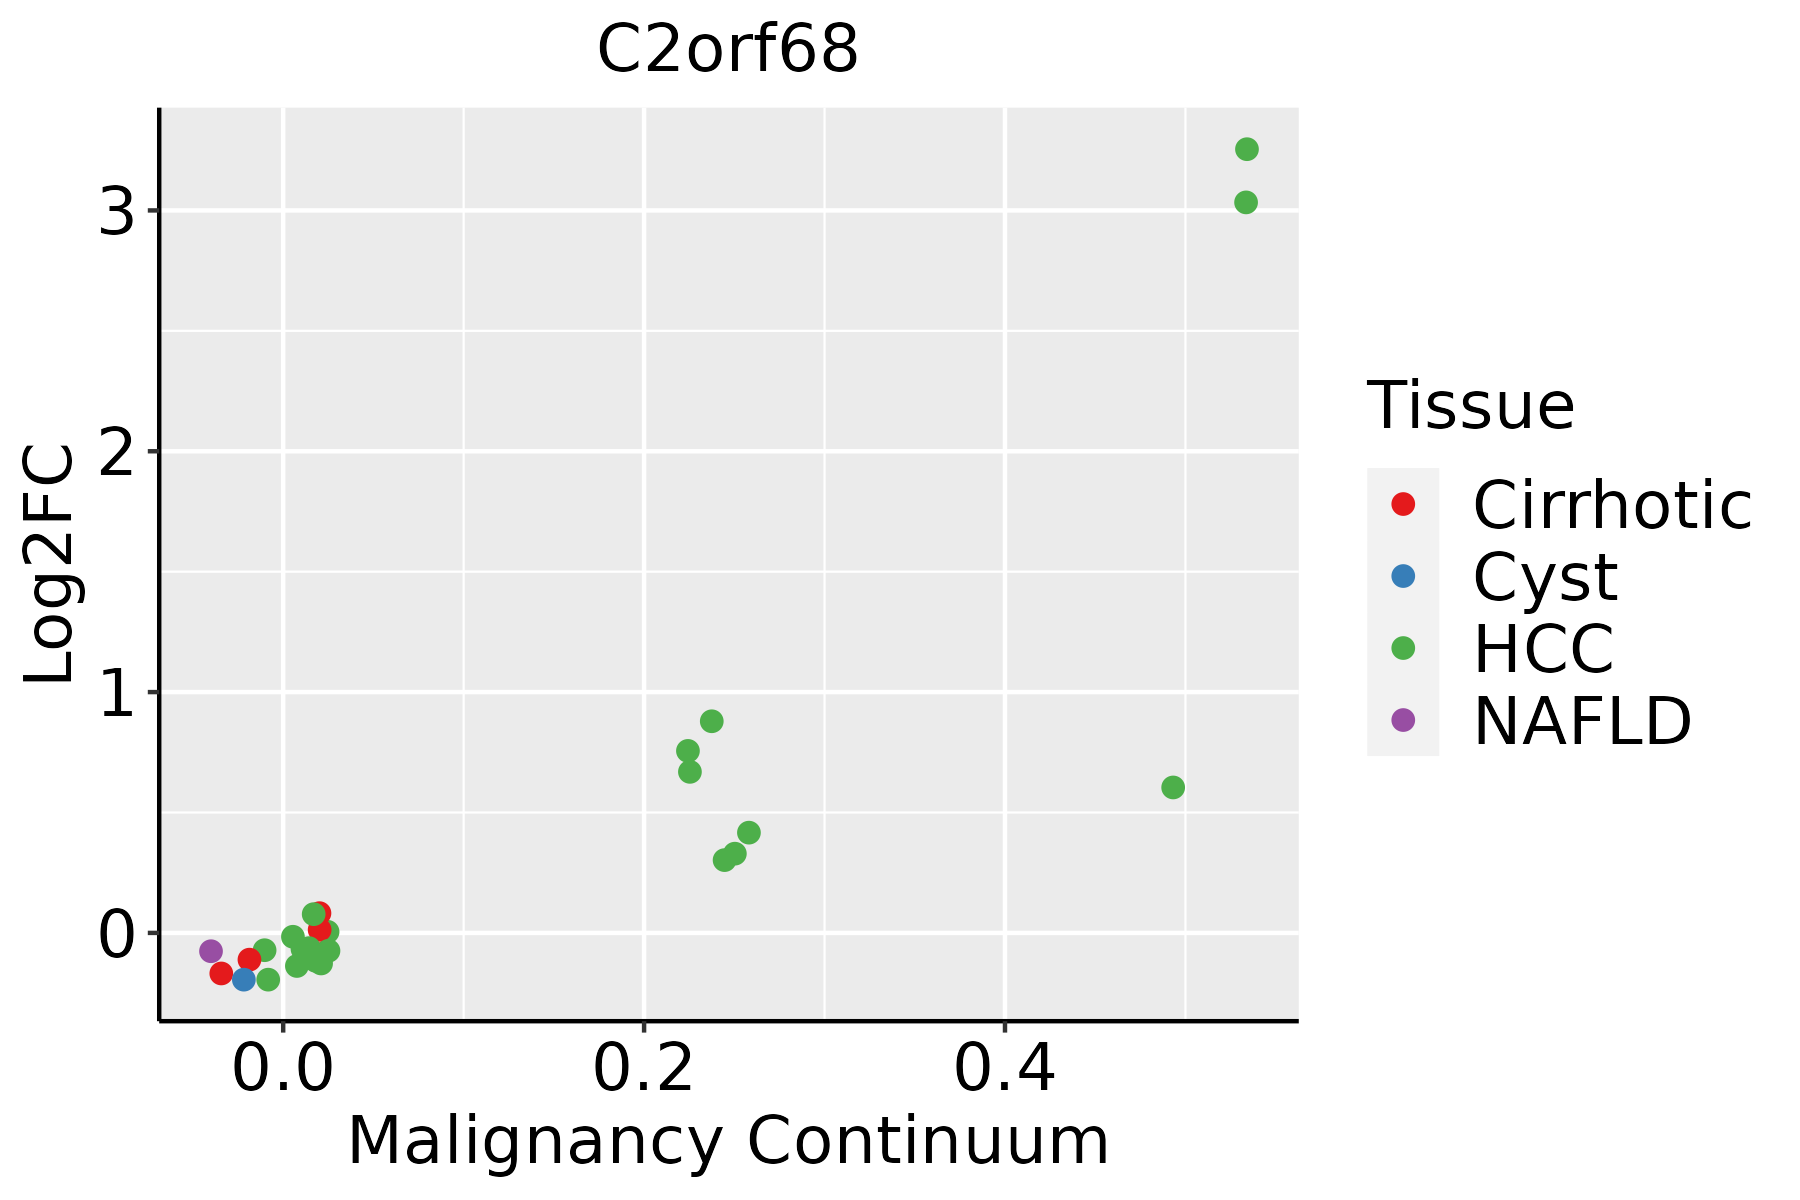 | HCC: Hepatocellular carcinoma |
| NAFLD: Non-alcoholic fatty liver disease | ||
| Oral Cavity | 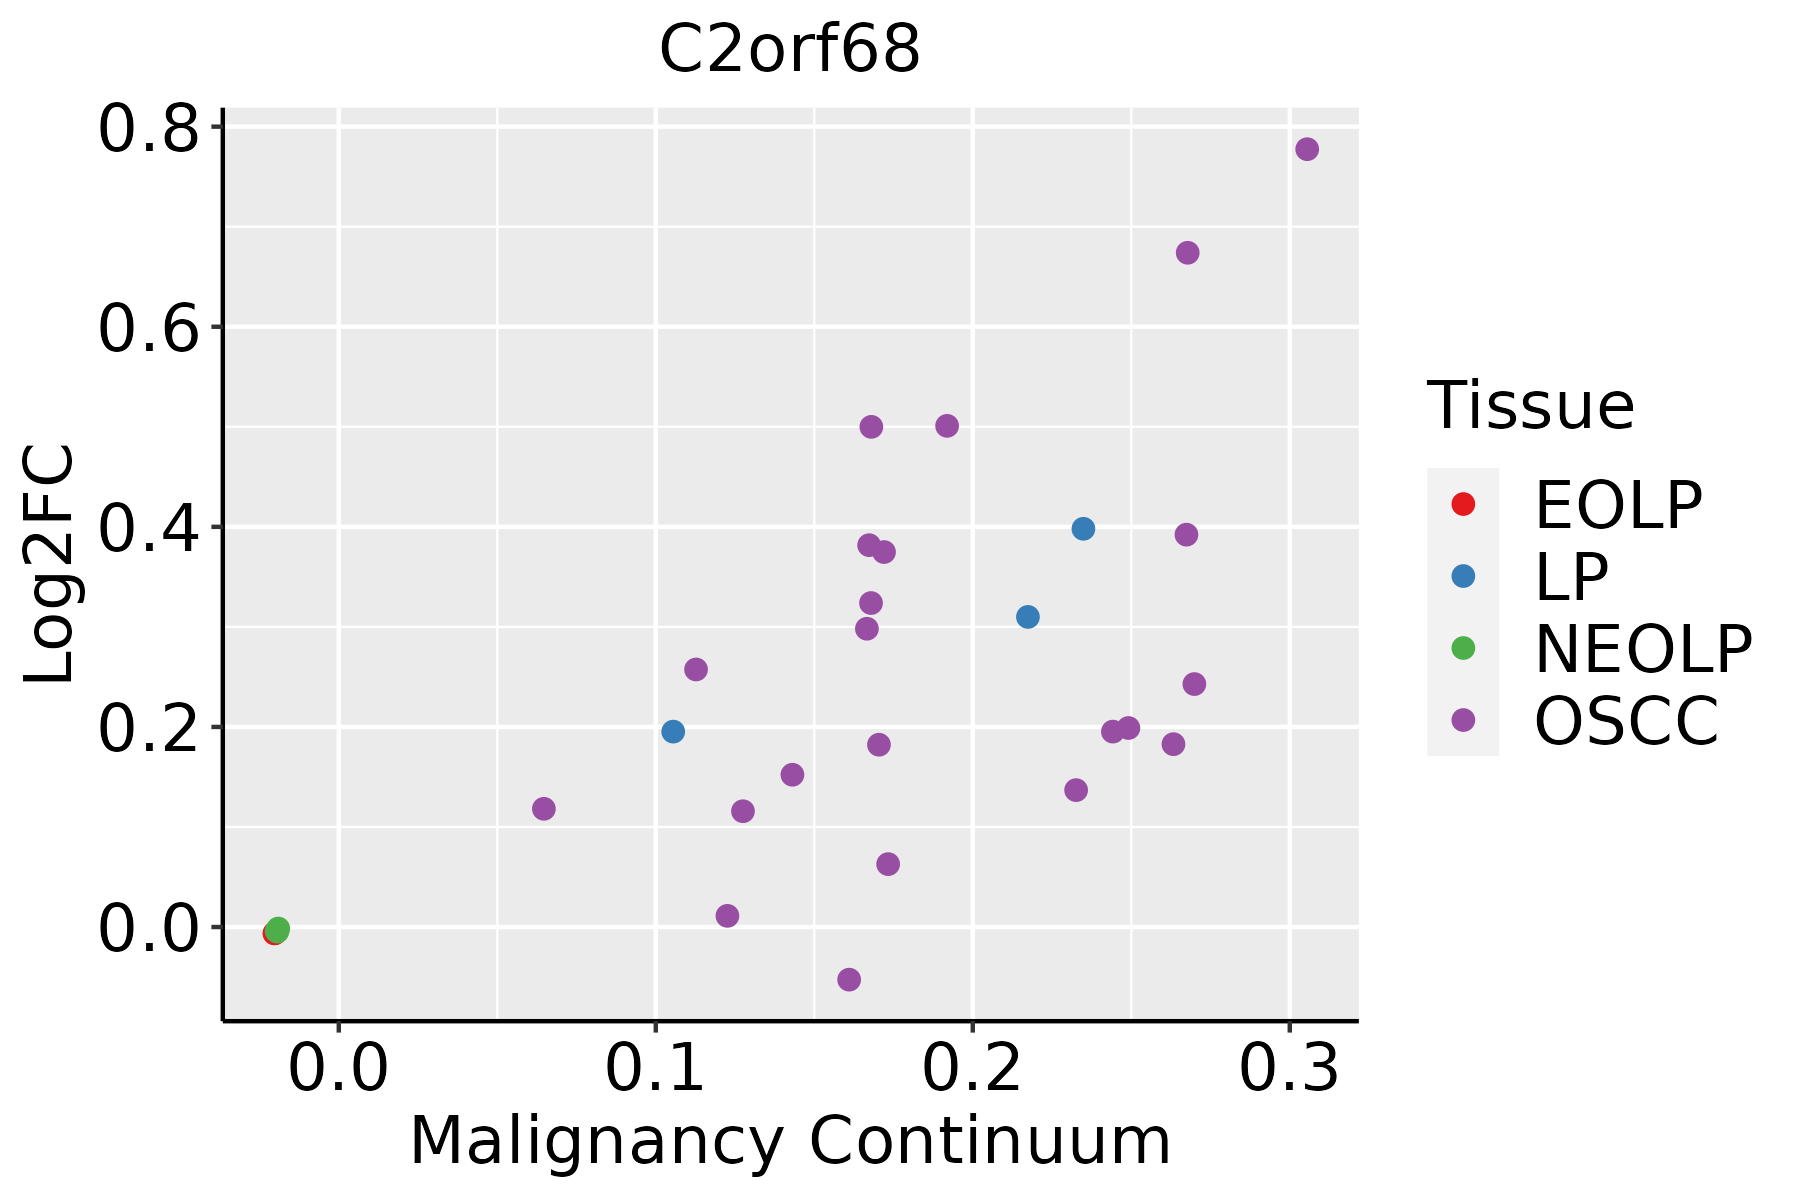 | EOLP: Erosive Oral lichen planus |
| LP: leukoplakia | ||
| NEOLP: Non-erosive oral lichen planus | ||
| OSCC: Oral squamous cell carcinoma |
| ∗log2FC in expression of this searched gene in stem-like cells from each diseased tissue sample relative to stem-like cells in normal samples in each tissue plotted against the malignancy continuum. Samples are colored based on if they are from different disease stage. |
Top |
Malignant transformation related pathway analysis |
| Find out the enriched GO biological processes and KEGG pathways involved in transition from healthy to precancer to cancer |
| Tissue | Disease Stage | Enriched GO biological Processes |
| Colorectum | AD |  |
| Colorectum | SER |  |
| Colorectum | MSS |  |
| Colorectum | MSI-H |  |
| Colorectum | FAP |  |
| ∗Top 15 enriched GO BP terms are showed in the bar plot of each disease state in each tissue. Each row represents a significant GO biological process which is colored according to the -log10(p.adjust). |
| Page: 1 2 3 4 5 6 7 8 9 |
| GO ID | Tissue | Disease Stage | Description | Gene Ratio | Bg Ratio | pvalue | p.adjust | Count |
| Page: 1 |
| Pathway ID | Tissue | Disease Stage | Description | Gene Ratio | Bg Ratio | pvalue | p.adjust | qvalue | Count |
| Page: 1 |
Top |
Cell-cell communication analysis |
| Identification of potential cell-cell interactions between two cell types and their ligand-receptor pairs for different disease states |
| Ligand | Receptor | LRpair | Pathway | Tissue | Disease Stage |
| Page: 1 |
Top |
Single-cell gene regulatory network inference analysis |
| Find out the significant the regulons (TFs) and the target genes of each regulon across cell types for different disease states |
| TF | Cell Type | Tissue | Disease Stage | Target Gene | RSS | Regulon Activity |
| ∗The dot plots of a searched regulon are shown for all cell subpopulations in each disease state of each tissue based on the regulon specific score inferred using pySCENIC and by calculating the average expression. |
| Page: 1 |
Top |
Somatic mutation of malignant transformation related genes |
| Annotation of somatic variants for genes involved in malignant transformation |
| Hugo Symbol | Variant Class | Variant Classification | dbSNP RS | HGVSc | HGVSp | HGVSp Short | SWISSPROT | BIOTYPE | SIFT | PolyPhen | Tumor Sample Barcode | Tissue | Histology | Sex | Age | Stage | Therapy Types | Drugs | Outcome |
| C2orf68 | SNV | Missense_Mutation | c.224G>A | p.Arg75Gln | p.R75Q | Q2NKX9 | protein_coding | tolerated(0.11) | probably_damaging(0.933) | TCGA-Q1-A5R2-01 | Cervix | cervical & endocervical cancer | Female | <65 | I/II | Chemotherapy | cisplatin | PR | |
| C2orf68 | SNV | Missense_Mutation | rs757496159 | c.337G>A | p.Glu113Lys | p.E113K | Q2NKX9 | protein_coding | tolerated(0.05) | benign(0.05) | TCGA-VS-A9V5-01 | Cervix | cervical & endocervical cancer | Female | <65 | I/II | Chemotherapy | carboplatin | PD |
| C2orf68 | deletion | Frame_Shift_Del | novel | c.51delN | p.Arg18GlyfsTer4 | p.R18Gfs*4 | Q2NKX9 | protein_coding | TCGA-WS-AB45-01 | Colorectum | colon adenocarcinoma | Female | <65 | I/II | Unknown | Unknown | SD | ||
| C2orf68 | SNV | Missense_Mutation | rs755094987 | c.461N>A | p.Arg154His | p.R154H | Q2NKX9 | protein_coding | deleterious(0.05) | possibly_damaging(0.765) | TCGA-AP-A051-01 | Endometrium | uterine corpus endometrioid carcinoma | Female | >=65 | I/II | Unknown | Unknown | SD |
| C2orf68 | SNV | Missense_Mutation | novel | c.340N>A | p.Ala114Thr | p.A114T | Q2NKX9 | protein_coding | deleterious(0.03) | possibly_damaging(0.596) | TCGA-AX-A1CE-01 | Endometrium | uterine corpus endometrioid carcinoma | Female | <65 | I/II | Unspecific | Paclitaxel | SD |
| C2orf68 | SNV | Missense_Mutation | c.341C>T | p.Ala114Val | p.A114V | Q2NKX9 | protein_coding | deleterious(0.01) | possibly_damaging(0.677) | TCGA-D1-A1NY-01 | Endometrium | uterine corpus endometrioid carcinoma | Female | >=65 | I/II | Chemotherapy | carboplatin | SD | |
| C2orf68 | SNV | Missense_Mutation | novel | c.463N>G | p.Ile155Val | p.I155V | Q2NKX9 | protein_coding | tolerated(0.44) | benign(0.005) | TCGA-SJ-A6ZI-01 | Endometrium | uterine corpus endometrioid carcinoma | Female | <65 | I/II | Unknown | Unknown | SD |
| C2orf68 | SNV | Missense_Mutation | novel | c.383N>G | p.Asp128Gly | p.D128G | Q2NKX9 | protein_coding | deleterious(0.01) | probably_damaging(0.994) | TCGA-T1-A6J8-01 | Liver | liver hepatocellular carcinoma | Male | >=65 | I/II | Unknown | Unknown | SD |
| C2orf68 | SNV | Missense_Mutation | novel | c.112N>A | p.Asp38Asn | p.D38N | Q2NKX9 | protein_coding | tolerated(0.23) | benign(0.047) | TCGA-77-A5G1-01 | Lung | lung squamous cell carcinoma | Male | >=65 | III/IV | Unknown | Unknown | PD |
| C2orf68 | SNV | Missense_Mutation | rs375189288 | c.70N>A | p.Gly24Ser | p.G24S | Q2NKX9 | protein_coding | deleterious(0.05) | benign(0.082) | TCGA-98-8022-01 | Lung | lung squamous cell carcinoma | Male | <65 | I/II | Unknown | Unknown | SD |
| Page: 1 2 |
Top |
Related drugs of malignant transformation related genes |
| Identification of chemicals and drugs interact with genes involved in malignant transfromation |
| (DGIdb 4.0) |
| Entrez ID | Symbol | Category | Interaction Types | Drug Claim Name | Drug Name | PMIDs |
| Page: 1 |

Copyright 2023-Present -The University of Texas Health Science Center at Houston |