
|
|||||
|
 | |
| |
| |
| |
| |
| |
|
Gene: C2orf54 |
Gene summary for C2ORF54 |
| Gene information | Species | Human | Gene symbol | C2orf54 | Gene ID | 79919 |
| Gene name | mab-21 like 4 | |
| Gene Alias | C2orf54 | |
| Cytomap | 2q37.3 | |
| Gene Type | protein-coding | GO ID | NA | UniProtAcc | B3KU29 |
Top |
Malignant transformation analysis |
| Identification of the aberrant gene expression in precancerous and cancerous lesions by comparing the gene expression of stem-like cells in diseased tissues with normal stem cells |
| Entrez ID | Symbol | Replicates | Species | Organ | Tissue | Adj P-value | Log2FC | Malignancy |
| 79919 | C2orf54 | HCC1 | Human | Liver | HCC | 7.46e-05 | 7.67e-01 | 0.5336 |
| 79919 | C2orf54 | HCC2 | Human | Liver | HCC | 9.67e-05 | 1.65e+00 | 0.5341 |
| 79919 | C2orf54 | S015 | Human | Liver | HCC | 2.78e-07 | 3.27e-01 | 0.2375 |
| 79919 | C2orf54 | S016 | Human | Liver | HCC | 6.41e-03 | 1.76e-01 | 0.2243 |
| 79919 | C2orf54 | S027 | Human | Liver | HCC | 1.03e-03 | 2.01e-01 | 0.2446 |
| 79919 | C2orf54 | S028 | Human | Liver | HCC | 1.77e-05 | 1.40e-01 | 0.2503 |
| 79919 | C2orf54 | C38 | Human | Oral cavity | OSCC | 1.95e-04 | 5.54e-01 | 0.172 |
| 79919 | C2orf54 | C43 | Human | Oral cavity | OSCC | 2.27e-16 | 4.86e-01 | 0.1704 |
| 79919 | C2orf54 | C46 | Human | Oral cavity | OSCC | 1.48e-14 | 3.98e-01 | 0.1673 |
| 79919 | C2orf54 | C57 | Human | Oral cavity | OSCC | 2.61e-12 | 6.55e-01 | 0.1679 |
| 79919 | C2orf54 | LN38 | Human | Oral cavity | OSCC | 1.68e-03 | 7.23e-01 | 0.168 |
| 79919 | C2orf54 | LN46 | Human | Oral cavity | OSCC | 2.89e-10 | 7.01e-01 | 0.1666 |
| Page: 1 |
| Tissue | Expression Dynamics | Abbreviation |
| Liver |  | HCC: Hepatocellular carcinoma |
| NAFLD: Non-alcoholic fatty liver disease | ||
| Oral Cavity | 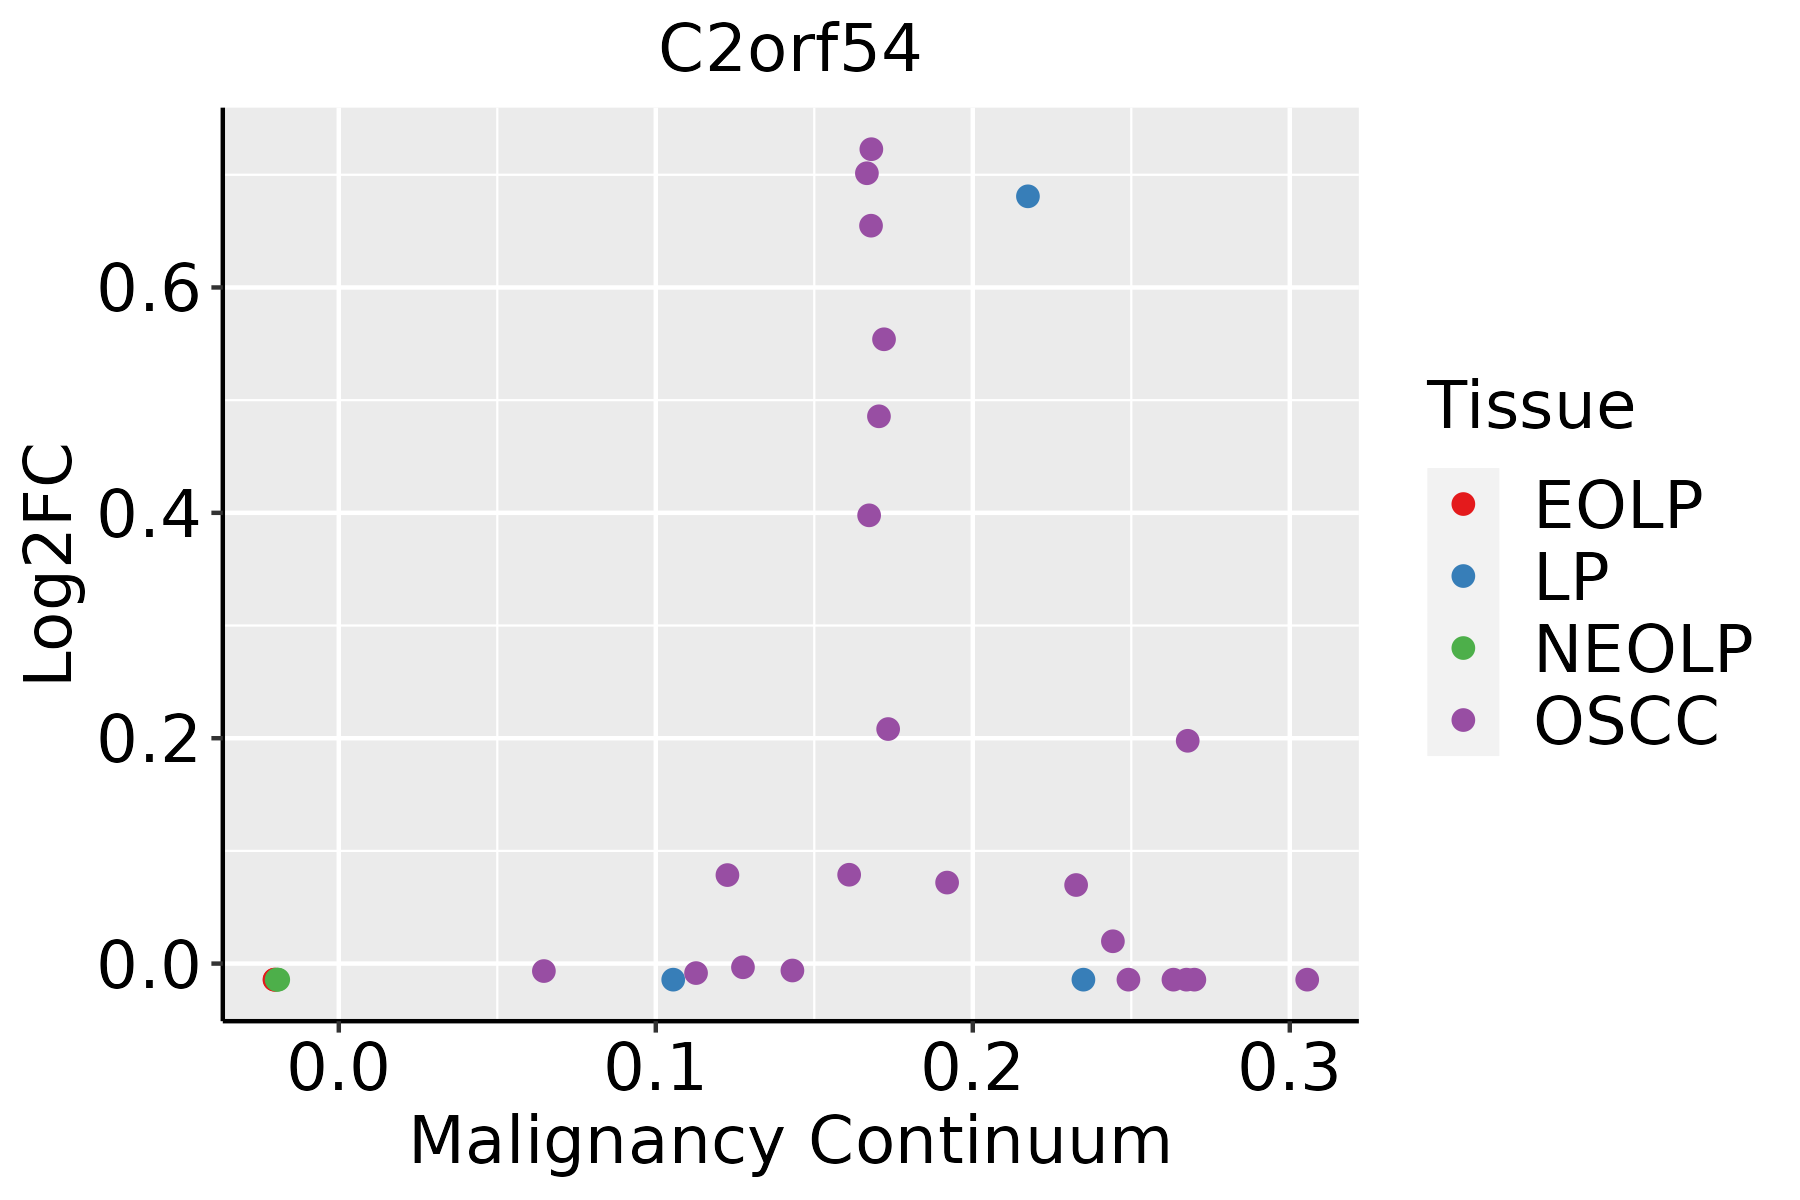 | EOLP: Erosive Oral lichen planus |
| LP: leukoplakia | ||
| NEOLP: Non-erosive oral lichen planus | ||
| OSCC: Oral squamous cell carcinoma |
| ∗log2FC in expression of this searched gene in stem-like cells from each diseased tissue sample relative to stem-like cells in normal samples in each tissue plotted against the malignancy continuum. Samples are colored based on if they are from different disease stage. |
Top |
Malignant transformation related pathway analysis |
| Find out the enriched GO biological processes and KEGG pathways involved in transition from healthy to precancer to cancer |
| Tissue | Disease Stage | Enriched GO biological Processes |
| Colorectum | AD |  |
| Colorectum | SER |  |
| Colorectum | MSS |  |
| Colorectum | MSI-H |  |
| Colorectum | FAP |  |
| ∗Top 15 enriched GO BP terms are showed in the bar plot of each disease state in each tissue. Each row represents a significant GO biological process which is colored according to the -log10(p.adjust). |
| Page: 1 2 3 4 5 6 7 8 9 |
| GO ID | Tissue | Disease Stage | Description | Gene Ratio | Bg Ratio | pvalue | p.adjust | Count |
| Page: 1 |
| Pathway ID | Tissue | Disease Stage | Description | Gene Ratio | Bg Ratio | pvalue | p.adjust | qvalue | Count |
| Page: 1 |
Top |
Cell-cell communication analysis |
| Identification of potential cell-cell interactions between two cell types and their ligand-receptor pairs for different disease states |
| Ligand | Receptor | LRpair | Pathway | Tissue | Disease Stage |
| Page: 1 |
Top |
Single-cell gene regulatory network inference analysis |
| Find out the significant the regulons (TFs) and the target genes of each regulon across cell types for different disease states |
| TF | Cell Type | Tissue | Disease Stage | Target Gene | RSS | Regulon Activity |
| ∗The dot plots of a searched regulon are shown for all cell subpopulations in each disease state of each tissue based on the regulon specific score inferred using pySCENIC and by calculating the average expression. |
| Page: 1 |
Top |
Somatic mutation of malignant transformation related genes |
| Annotation of somatic variants for genes involved in malignant transformation |
| Hugo Symbol | Variant Class | Variant Classification | dbSNP RS | HGVSc | HGVSp | HGVSp Short | SWISSPROT | BIOTYPE | SIFT | PolyPhen | Tumor Sample Barcode | Tissue | Histology | Sex | Age | Stage | Therapy Types | Drugs | Outcome |
| C2orf54 | SNV | Missense_Mutation | rs200698547 | c.268N>A | p.Glu90Lys | p.E90K | Q08AI8 | protein_coding | deleterious(0.01) | benign(0.284) | TCGA-AC-A5XS-01 | Breast | breast invasive carcinoma | Female | >=65 | I/II | Hormone Therapy | femara | SD |
| C2orf54 | SNV | Missense_Mutation | novel | c.1286T>C | p.Ile429Thr | p.I429T | Q08AI8 | protein_coding | tolerated(0.31) | benign(0.185) | TCGA-2W-A8YY-01 | Cervix | cervical & endocervical cancer | Female | <65 | I/II | Chemotherapy | cisplatin | CR |
| C2orf54 | SNV | Missense_Mutation | c.539N>C | p.Arg180Thr | p.R180T | Q08AI8 | protein_coding | tolerated(0.06) | benign(0.042) | TCGA-BI-A20A-01 | Cervix | cervical & endocervical cancer | Female | <65 | I/II | Unknown | Unknown | SD | |
| C2orf54 | SNV | Missense_Mutation | novel | c.598N>T | p.His200Tyr | p.H200Y | Q08AI8 | protein_coding | deleterious(0) | benign(0.224) | TCGA-C5-A8XJ-01 | Cervix | cervical & endocervical cancer | Female | >=65 | I/II | Chemotherapy | cisplatin | SD |
| C2orf54 | SNV | Missense_Mutation | c.1328N>C | p.Gly443Ala | p.G443A | Q08AI8 | protein_coding | tolerated(1) | benign(0.015) | TCGA-A6-6138-01 | Colorectum | colon adenocarcinoma | Male | <65 | I/II | Unknown | Unknown | SD | |
| C2orf54 | SNV | Missense_Mutation | c.65N>C | p.Leu22Pro | p.L22P | Q08AI8 | protein_coding | deleterious(0.01) | probably_damaging(0.946) | TCGA-AD-6889-01 | Colorectum | colon adenocarcinoma | Male | >=65 | I/II | Chemotherapy | xeloda | PD | |
| C2orf54 | SNV | Missense_Mutation | rs368882820 | c.610N>A | p.Val204Met | p.V204M | Q08AI8 | protein_coding | tolerated(0.06) | possibly_damaging(0.894) | TCGA-A5-A0G1-01 | Endometrium | uterine corpus endometrioid carcinoma | Female | >=65 | I/II | Unknown | Unknown | SD |
| C2orf54 | SNV | Missense_Mutation | c.595N>G | p.Phe199Val | p.F199V | Q08AI8 | protein_coding | tolerated(0.11) | probably_damaging(0.995) | TCGA-AX-A05Z-01 | Endometrium | uterine corpus endometrioid carcinoma | Female | <65 | III/IV | Chemotherapy | adriamycin | SD | |
| C2orf54 | SNV | Missense_Mutation | rs781071945 | c.148G>A | p.Val50Met | p.V50M | Q08AI8 | protein_coding | deleterious(0) | possibly_damaging(0.886) | TCGA-AX-A2HD-01 | Endometrium | uterine corpus endometrioid carcinoma | Female | >=65 | III/IV | Unknown | Unknown | SD |
| C2orf54 | SNV | Missense_Mutation | rs371171789 | c.211G>A | p.Ala71Thr | p.A71T | Q08AI8 | protein_coding | tolerated(0.17) | benign(0.013) | TCGA-B5-A1MR-01 | Endometrium | uterine corpus endometrioid carcinoma | Female | >=65 | III/IV | Unknown | Unknown | SD |
| Page: 1 2 3 |
Top |
Related drugs of malignant transformation related genes |
| Identification of chemicals and drugs interact with genes involved in malignant transfromation |
| (DGIdb 4.0) |
| Entrez ID | Symbol | Category | Interaction Types | Drug Claim Name | Drug Name | PMIDs |
| Page: 1 |

Copyright 2023-Present -The University of Texas Health Science Center at Houston |