
|
|||||
|
 | |
| |
| |
| |
| |
| |
|
Gene: C2orf40 |
Gene summary for C2ORF40 |
| Gene information | Species | Human | Gene symbol | C2orf40 | Gene ID | 84417 |
| Gene name | ECRG4 augurin precursor | |
| Gene Alias | C2orf40 | |
| Cytomap | 2q12.2 | |
| Gene Type | protein-coding | GO ID | GO:0006508 | UniProtAcc | Q9H1Z8 |
Top |
Malignant transformation analysis |
| Identification of the aberrant gene expression in precancerous and cancerous lesions by comparing the gene expression of stem-like cells in diseased tissues with normal stem cells |
| Entrez ID | Symbol | Replicates | Species | Organ | Tissue | Adj P-value | Log2FC | Malignancy |
| 84417 | C2orf40 | C09 | Human | Oral cavity | OSCC | 5.53e-37 | 1.16e+00 | 0.1431 |
| 84417 | C2orf40 | SYSMH6 | Human | Oral cavity | OSCC | 1.77e-03 | 1.29e-01 | 0.1275 |
| 84417 | C2orf40 | Adj_PTCwithHT_6 | Human | Thyroid | HT | 1.71e-34 | -1.06e+00 | 0.02 |
| 84417 | C2orf40 | PTCwithHT_1 | Human | Thyroid | HT | 1.42e-06 | -8.46e-01 | 0.0238 |
| 84417 | C2orf40 | PTCwithHT_6 | Human | Thyroid | HT | 4.06e-31 | -1.07e+00 | 0.02 |
| 84417 | C2orf40 | PTCwithHT_8 | Human | Thyroid | HT | 1.15e-06 | -1.41e-01 | 0.0351 |
| 84417 | C2orf40 | PTCwithoutHT_2 | Human | Thyroid | PTC | 9.97e-25 | 5.00e-01 | 0.0419 |
| 84417 | C2orf40 | male-WTA | Human | Thyroid | PTC | 8.30e-41 | -1.11e+00 | 0.1037 |
| 84417 | C2orf40 | female-WTA | Human | Thyroid | PTC | 5.92e-16 | -1.11e+00 | 0.0726 |
| 84417 | C2orf40 | nodule-WTA | Human | Thyroid | goiters | 2.84e-32 | -1.11e+00 | 0.0534 |
| 84417 | C2orf40 | PTC01 | Human | Thyroid | PTC | 8.41e-29 | 2.45e+00 | 0.1899 |
| 84417 | C2orf40 | PTC03 | Human | Thyroid | PTC | 1.34e-02 | 1.88e-01 | 0.1784 |
| 84417 | C2orf40 | PTC04 | Human | Thyroid | PTC | 9.74e-09 | 1.20e+00 | 0.1927 |
| 84417 | C2orf40 | PTC05 | Human | Thyroid | PTC | 7.38e-26 | 2.66e+00 | 0.2065 |
| 84417 | C2orf40 | PTC06 | Human | Thyroid | PTC | 1.06e-39 | 2.96e+00 | 0.2057 |
| 84417 | C2orf40 | PTC07 | Human | Thyroid | PTC | 1.94e-72 | 3.46e+00 | 0.2044 |
| 84417 | C2orf40 | ATC08 | Human | Thyroid | ATC | 7.93e-13 | -1.06e+00 | 0.0541 |
| 84417 | C2orf40 | ATC09 | Human | Thyroid | ATC | 1.16e-13 | -1.11e+00 | 0.2871 |
| 84417 | C2orf40 | ATC11 | Human | Thyroid | ATC | 7.49e-03 | -1.11e+00 | 0.3386 |
| 84417 | C2orf40 | ATC12 | Human | Thyroid | ATC | 3.33e-45 | -1.11e+00 | 0.34 |
| Page: 1 2 |
| Tissue | Expression Dynamics | Abbreviation |
| Oral Cavity |  | EOLP: Erosive Oral lichen planus |
| LP: leukoplakia | ||
| NEOLP: Non-erosive oral lichen planus | ||
| OSCC: Oral squamous cell carcinoma | ||
| Thyroid | 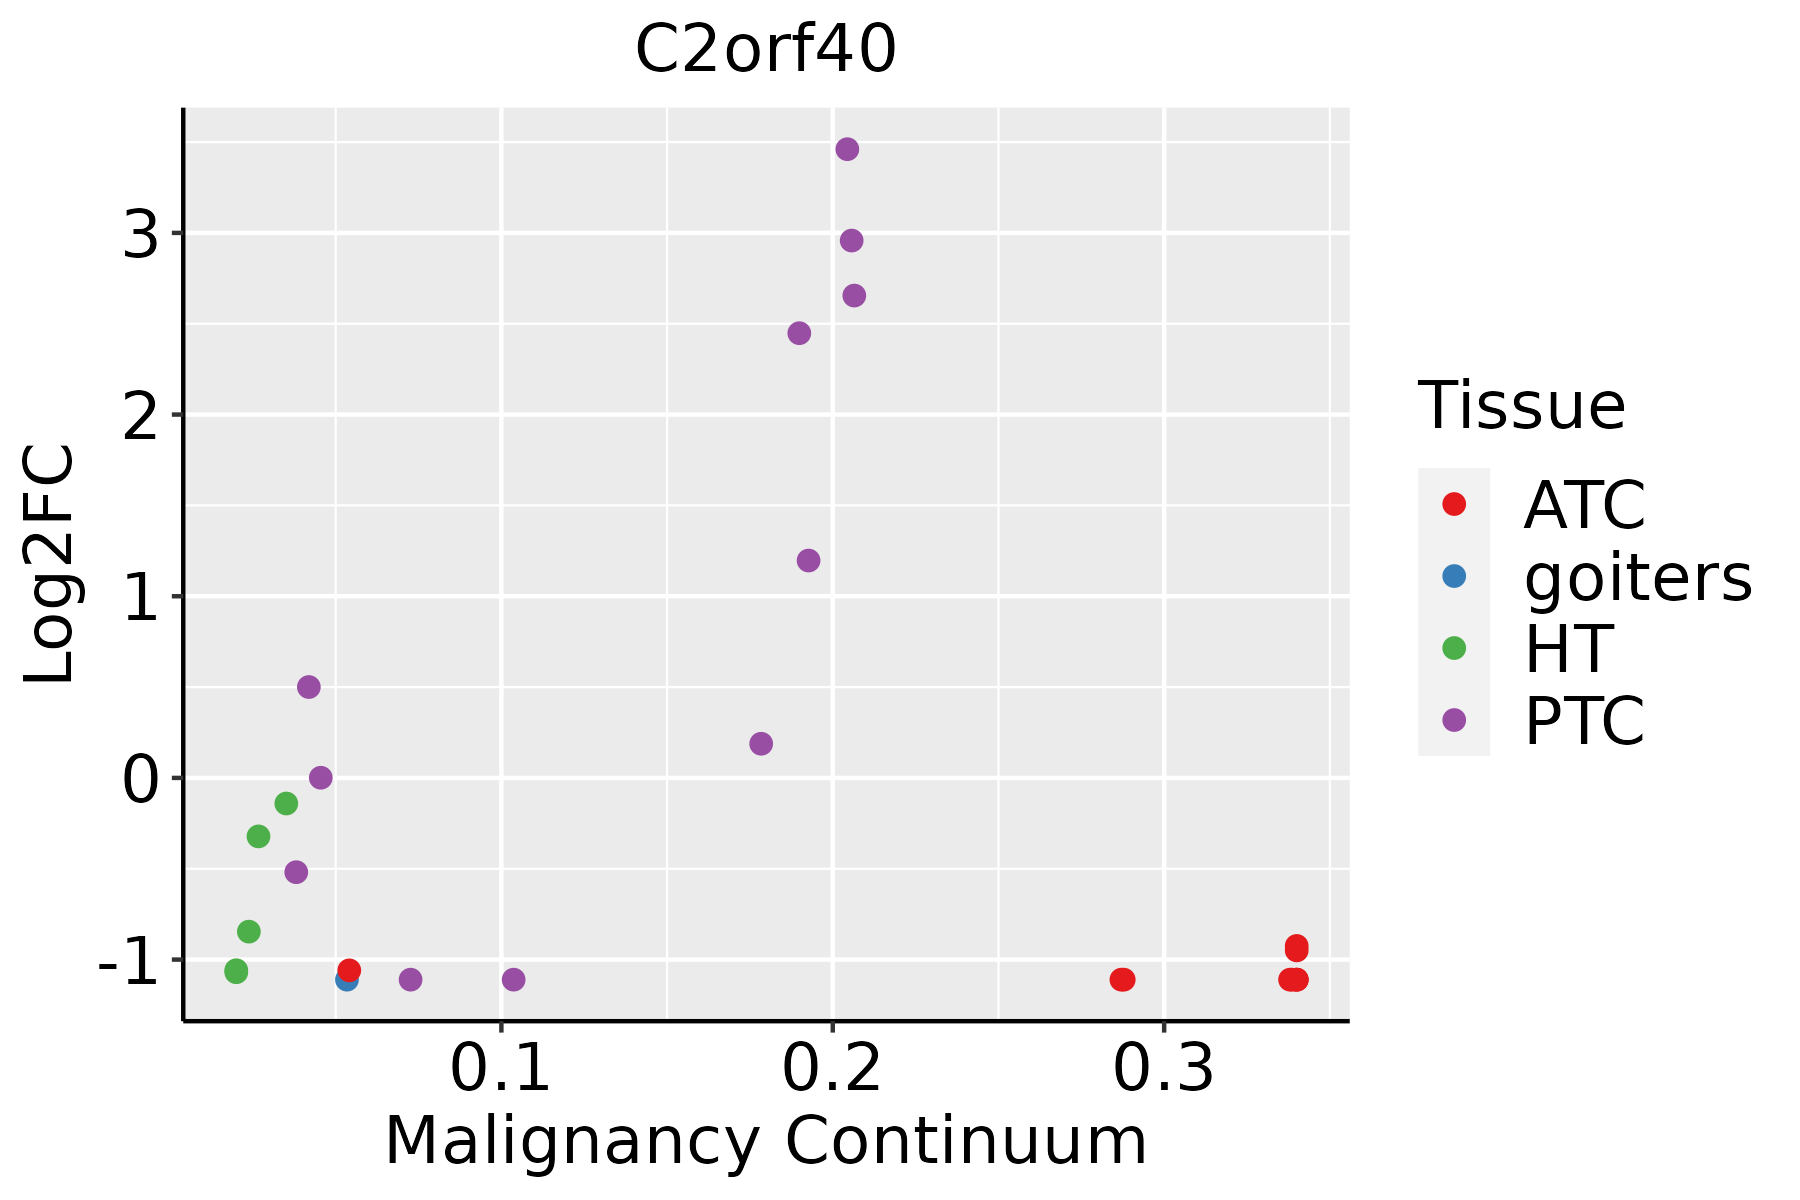 | ATC: Anaplastic thyroid cancer |
| HT: Hashimoto's thyroiditis | ||
| PTC: Papillary thyroid cancer |
| ∗log2FC in expression of this searched gene in stem-like cells from each diseased tissue sample relative to stem-like cells in normal samples in each tissue plotted against the malignancy continuum. Samples are colored based on if they are from different disease stage. |
Top |
Malignant transformation related pathway analysis |
| Find out the enriched GO biological processes and KEGG pathways involved in transition from healthy to precancer to cancer |
| Tissue | Disease Stage | Enriched GO biological Processes |
| Colorectum | AD |  |
| Colorectum | SER |  |
| Colorectum | MSS |  |
| Colorectum | MSI-H |  |
| Colorectum | FAP |  |
| ∗Top 15 enriched GO BP terms are showed in the bar plot of each disease state in each tissue. Each row represents a significant GO biological process which is colored according to the -log10(p.adjust). |
| Page: 1 2 3 4 5 6 7 8 9 |
| GO ID | Tissue | Disease Stage | Description | Gene Ratio | Bg Ratio | pvalue | p.adjust | Count |
| Page: 1 |
| Pathway ID | Tissue | Disease Stage | Description | Gene Ratio | Bg Ratio | pvalue | p.adjust | qvalue | Count |
| Page: 1 |
Top |
Cell-cell communication analysis |
| Identification of potential cell-cell interactions between two cell types and their ligand-receptor pairs for different disease states |
| Ligand | Receptor | LRpair | Pathway | Tissue | Disease Stage |
| Page: 1 |
Top |
Single-cell gene regulatory network inference analysis |
| Find out the significant the regulons (TFs) and the target genes of each regulon across cell types for different disease states |
| TF | Cell Type | Tissue | Disease Stage | Target Gene | RSS | Regulon Activity |
| ∗The dot plots of a searched regulon are shown for all cell subpopulations in each disease state of each tissue based on the regulon specific score inferred using pySCENIC and by calculating the average expression. |
| Page: 1 |
Top |
Somatic mutation of malignant transformation related genes |
| Annotation of somatic variants for genes involved in malignant transformation |
| Hugo Symbol | Variant Class | Variant Classification | dbSNP RS | HGVSc | HGVSp | HGVSp Short | SWISSPROT | BIOTYPE | SIFT | PolyPhen | Tumor Sample Barcode | Tissue | Histology | Sex | Age | Stage | Therapy Types | Drugs | Outcome |
| C2orf40 | SNV | Missense_Mutation | novel | c.99N>C | p.Lys33Asn | p.K33N | Q9H1Z8 | protein_coding | deleterious(0) | possibly_damaging(0.553) | TCGA-AN-A046-01 | Breast | breast invasive carcinoma | Female | >=65 | I/II | Unknown | Unknown | SD |
| C2orf40 | SNV | Missense_Mutation | c.406N>T | p.Gly136Cys | p.G136C | Q9H1Z8 | protein_coding | deleterious(0) | possibly_damaging(0.575) | TCGA-GM-A2DH-01 | Breast | breast invasive carcinoma | Female | <65 | I/II | Chemotherapy | taxol | CR | |
| C2orf40 | SNV | Missense_Mutation | rs376920426 | c.427N>A | p.Val143Ile | p.V143I | Q9H1Z8 | protein_coding | deleterious(0) | probably_damaging(0.986) | TCGA-C5-A1BJ-01 | Cervix | cervical & endocervical cancer | Female | <65 | I/II | Unknown | Unknown | SD |
| C2orf40 | SNV | Missense_Mutation | rs368622171 | c.224G>A | p.Arg75Gln | p.R75Q | Q9H1Z8 | protein_coding | deleterious(0) | probably_damaging(0.996) | TCGA-AD-6895-01 | Colorectum | colon adenocarcinoma | Male | >=65 | III/IV | Unknown | Unknown | SD |
| C2orf40 | SNV | Missense_Mutation | rs376920426 | c.427N>A | p.Val143Ile | p.V143I | Q9H1Z8 | protein_coding | deleterious(0) | probably_damaging(0.986) | TCGA-NH-A50T-01 | Colorectum | colon adenocarcinoma | Female | >=65 | I/II | Unknown | Unknown | SD |
| C2orf40 | SNV | Missense_Mutation | novel | c.251N>C | p.Tyr84Ser | p.Y84S | Q9H1Z8 | protein_coding | deleterious(0) | probably_damaging(0.961) | TCGA-AG-A00Y-01 | Colorectum | rectum adenocarcinoma | Male | >=65 | I/II | Unknown | Unknown | PD |
| C2orf40 | SNV | Missense_Mutation | novel | c.117A>C | p.Gln39His | p.Q39H | Q9H1Z8 | protein_coding | deleterious(0.01) | possibly_damaging(0.76) | TCGA-EI-6917-01 | Colorectum | rectum adenocarcinoma | Male | <65 | III/IV | Chemotherapy | 5fluorouracil+oxaciplatina+l-folinian | SD |
| C2orf40 | SNV | Missense_Mutation | novel | c.376G>T | p.Asp126Tyr | p.D126Y | Q9H1Z8 | protein_coding | deleterious(0) | probably_damaging(0.982) | TCGA-EI-6917-01 | Colorectum | rectum adenocarcinoma | Male | <65 | III/IV | Chemotherapy | 5fluorouracil+oxaciplatina+l-folinian | SD |
| C2orf40 | SNV | Missense_Mutation | novel | c.165N>T | p.Glu55Asp | p.E55D | Q9H1Z8 | protein_coding | tolerated(0.12) | possibly_damaging(0.875) | TCGA-F5-6814-01 | Colorectum | rectum adenocarcinoma | Male | <65 | I/II | Unknown | Unknown | SD |
| C2orf40 | SNV | Missense_Mutation | novel | c.328N>C | p.Asn110His | p.N110H | Q9H1Z8 | protein_coding | deleterious(0.03) | possibly_damaging(0.66) | TCGA-F5-6814-01 | Colorectum | rectum adenocarcinoma | Male | <65 | I/II | Unknown | Unknown | SD |
| Page: 1 2 3 |
Top |
Related drugs of malignant transformation related genes |
| Identification of chemicals and drugs interact with genes involved in malignant transfromation |
| (DGIdb 4.0) |
| Entrez ID | Symbol | Category | Interaction Types | Drug Claim Name | Drug Name | PMIDs |
| Page: 1 |

Copyright 2023-Present -The University of Texas Health Science Center at Houston |