
|
|||||
|
 | |
| |
| |
| |
| |
| |
|
Gene: C2CD5 |
Gene summary for C2CD5 |
| Gene information | Species | Human | Gene symbol | C2CD5 | Gene ID | 9847 |
| Gene name | C2 calcium dependent domain containing 5 | |
| Gene Alias | CDP138 | |
| Cytomap | 12p12.1 | |
| Gene Type | protein-coding | GO ID | GO:0006605 | UniProtAcc | Q86YS7 |
Top |
Malignant transformation analysis |
| Identification of the aberrant gene expression in precancerous and cancerous lesions by comparing the gene expression of stem-like cells in diseased tissues with normal stem cells |
| Entrez ID | Symbol | Replicates | Species | Organ | Tissue | Adj P-value | Log2FC | Malignancy |
| 9847 | C2CD5 | CCI_2 | Human | Cervix | CC | 6.14e-04 | 6.93e-01 | 0.5249 |
| 9847 | C2CD5 | CCI_3 | Human | Cervix | CC | 2.85e-05 | 5.57e-01 | 0.516 |
| 9847 | C2CD5 | HTA11_3410_2000001011 | Human | Colorectum | AD | 2.84e-08 | -3.73e-01 | 0.0155 |
| 9847 | C2CD5 | HTA11_1938_2000001011 | Human | Colorectum | AD | 1.93e-02 | -1.88e-01 | -0.0811 |
| 9847 | C2CD5 | HTA11_3361_2000001011 | Human | Colorectum | AD | 1.39e-03 | -4.06e-01 | -0.1207 |
| 9847 | C2CD5 | HTA11_696_2000001011 | Human | Colorectum | AD | 1.04e-11 | -4.03e-01 | -0.1464 |
| 9847 | C2CD5 | HTA11_866_2000001011 | Human | Colorectum | AD | 3.98e-06 | -3.22e-01 | -0.1001 |
| 9847 | C2CD5 | HTA11_866_3004761011 | Human | Colorectum | AD | 3.81e-09 | -4.37e-01 | 0.096 |
| 9847 | C2CD5 | HTA11_10711_2000001011 | Human | Colorectum | AD | 4.18e-04 | -4.36e-01 | 0.0338 |
| 9847 | C2CD5 | HTA11_7696_3000711011 | Human | Colorectum | AD | 1.26e-06 | -3.27e-01 | 0.0674 |
| 9847 | C2CD5 | HTA11_6818_2000001021 | Human | Colorectum | AD | 1.85e-05 | -4.87e-01 | 0.0588 |
| 9847 | C2CD5 | HTA11_99999971662_82457 | Human | Colorectum | MSS | 3.45e-09 | -3.82e-01 | 0.3859 |
| 9847 | C2CD5 | HTA11_99999973899_84307 | Human | Colorectum | MSS | 2.44e-04 | -4.94e-01 | 0.2585 |
| 9847 | C2CD5 | HTA11_99999974143_84620 | Human | Colorectum | MSS | 1.28e-15 | -4.82e-01 | 0.3005 |
| 9847 | C2CD5 | A002-C-010 | Human | Colorectum | FAP | 9.09e-03 | -9.37e-02 | 0.242 |
| 9847 | C2CD5 | A001-C-207 | Human | Colorectum | FAP | 6.65e-03 | -2.45e-01 | 0.1278 |
| 9847 | C2CD5 | A015-C-203 | Human | Colorectum | FAP | 9.30e-25 | -3.66e-01 | -0.1294 |
| 9847 | C2CD5 | A015-C-204 | Human | Colorectum | FAP | 6.31e-04 | -2.19e-01 | -0.0228 |
| 9847 | C2CD5 | A014-C-040 | Human | Colorectum | FAP | 1.16e-02 | -1.63e-01 | -0.1184 |
| 9847 | C2CD5 | A002-C-201 | Human | Colorectum | FAP | 4.19e-15 | -4.13e-01 | 0.0324 |
| Page: 1 2 3 |
| Tissue | Expression Dynamics | Abbreviation |
| Cervix |  | CC: Cervix cancer |
| HSIL_HPV: HPV-infected high-grade squamous intraepithelial lesions | ||
| N_HPV: HPV-infected normal cervix | ||
| Colorectum (GSE201348) |  | FAP: Familial adenomatous polyposis |
| CRC: Colorectal cancer | ||
| Colorectum (HTA11) |  | AD: Adenomas |
| SER: Sessile serrated lesions | ||
| MSI-H: Microsatellite-high colorectal cancer | ||
| MSS: Microsatellite stable colorectal cancer | ||
| Liver | 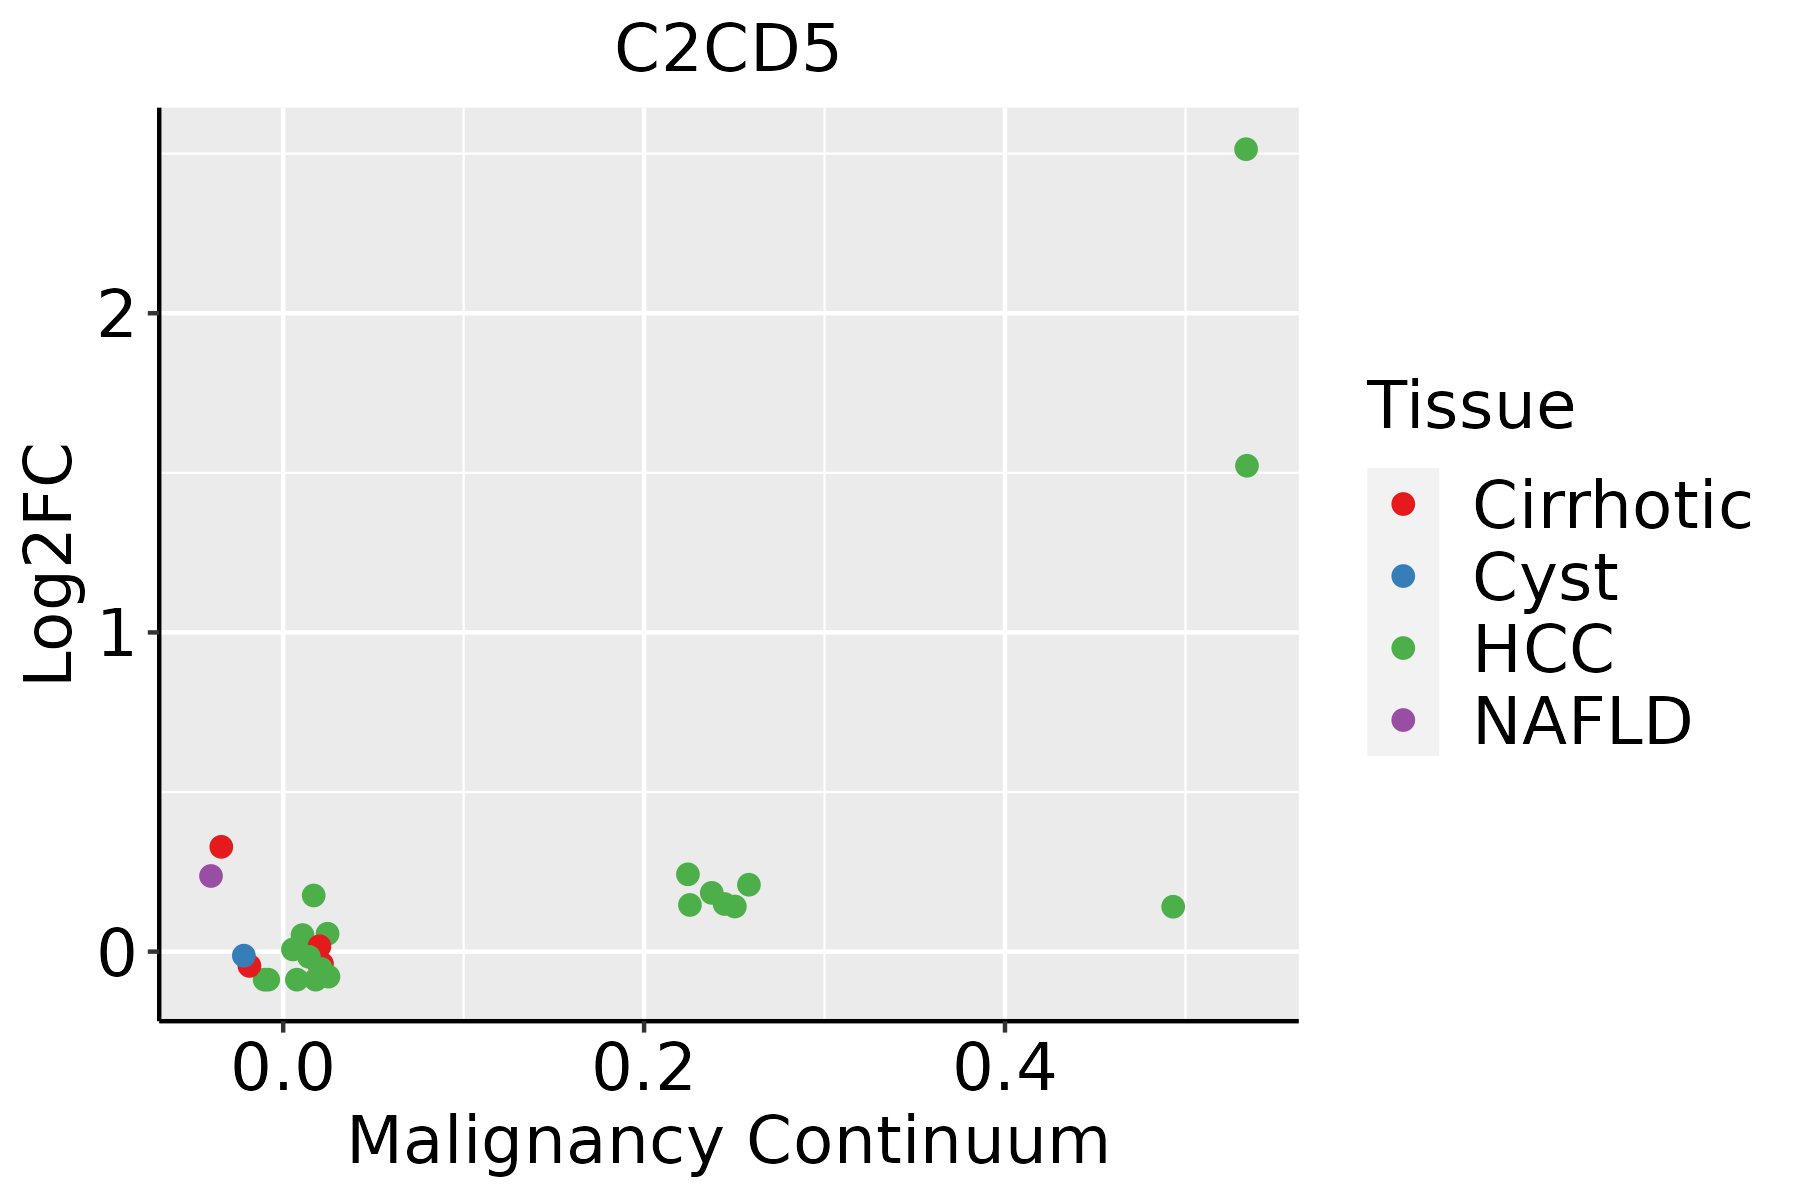 | HCC: Hepatocellular carcinoma |
| NAFLD: Non-alcoholic fatty liver disease |
| ∗log2FC in expression of this searched gene in stem-like cells from each diseased tissue sample relative to stem-like cells in normal samples in each tissue plotted against the malignancy continuum. Samples are colored based on if they are from different disease stage. |
Top |
Malignant transformation related pathway analysis |
| Find out the enriched GO biological processes and KEGG pathways involved in transition from healthy to precancer to cancer |
| Tissue | Disease Stage | Enriched GO biological Processes |
| Colorectum | AD |  |
| Colorectum | SER |  |
| Colorectum | MSS |  |
| Colorectum | MSI-H |  |
| Colorectum | FAP |  |
| ∗Top 15 enriched GO BP terms are showed in the bar plot of each disease state in each tissue. Each row represents a significant GO biological process which is colored according to the -log10(p.adjust). |
| Page: 1 2 3 4 5 6 7 8 9 |
| GO ID | Tissue | Disease Stage | Description | Gene Ratio | Bg Ratio | pvalue | p.adjust | Count |
| GO:190382910 | Cervix | CC | positive regulation of cellular protein localization | 72/2311 | 276/18723 | 3.20e-10 | 4.46e-08 | 72 |
| GO:007265910 | Cervix | CC | protein localization to plasma membrane | 73/2311 | 284/18723 | 4.95e-10 | 6.73e-08 | 73 |
| GO:19907788 | Cervix | CC | protein localization to cell periphery | 78/2311 | 333/18723 | 1.22e-08 | 9.73e-07 | 78 |
| GO:005122210 | Cervix | CC | positive regulation of protein transport | 72/2311 | 303/18723 | 2.36e-08 | 1.70e-06 | 72 |
| GO:190495110 | Cervix | CC | positive regulation of establishment of protein localization | 73/2311 | 319/18723 | 9.69e-08 | 5.25e-06 | 73 |
| GO:000660510 | Cervix | CC | protein targeting | 68/2311 | 314/18723 | 2.17e-06 | 6.55e-05 | 68 |
| GO:00903167 | Cervix | CC | positive regulation of intracellular protein transport | 41/2311 | 160/18723 | 3.24e-06 | 8.80e-05 | 41 |
| GO:00323868 | Cervix | CC | regulation of intracellular transport | 71/2311 | 337/18723 | 3.70e-06 | 9.74e-05 | 71 |
| GO:00331579 | Cervix | CC | regulation of intracellular protein transport | 52/2311 | 229/18723 | 8.16e-06 | 1.88e-04 | 52 |
| GO:19016538 | Cervix | CC | cellular response to peptide | 72/2311 | 359/18723 | 1.89e-05 | 3.48e-04 | 72 |
| GO:19054778 | Cervix | CC | positive regulation of protein localization to membrane | 29/2311 | 106/18723 | 2.29e-05 | 4.01e-04 | 29 |
| GO:00323889 | Cervix | CC | positive regulation of intracellular transport | 46/2311 | 202/18723 | 2.45e-05 | 4.24e-04 | 46 |
| GO:00901509 | Cervix | CC | establishment of protein localization to membrane | 54/2311 | 260/18723 | 7.67e-05 | 1.05e-03 | 54 |
| GO:00434349 | Cervix | CC | response to peptide hormone | 77/2311 | 414/18723 | 1.40e-04 | 1.70e-03 | 77 |
| GO:00713757 | Cervix | CC | cellular response to peptide hormone stimulus | 57/2311 | 290/18723 | 2.32e-04 | 2.59e-03 | 57 |
| GO:00328698 | Cervix | CC | cellular response to insulin stimulus | 42/2311 | 203/18723 | 4.95e-04 | 4.83e-03 | 42 |
| GO:00328688 | Cervix | CC | response to insulin | 50/2311 | 264/18723 | 1.28e-03 | 1.02e-02 | 50 |
| GO:19054758 | Cervix | CC | regulation of protein localization to membrane | 36/2311 | 175/18723 | 1.33e-03 | 1.05e-02 | 36 |
| GO:00160506 | Cervix | CC | vesicle organization | 54/2311 | 300/18723 | 2.71e-03 | 1.85e-02 | 54 |
| GO:00082865 | Cervix | CC | insulin receptor signaling pathway | 25/2311 | 116/18723 | 3.59e-03 | 2.30e-02 | 25 |
| Page: 1 2 3 4 5 6 7 8 |
| Pathway ID | Tissue | Disease Stage | Description | Gene Ratio | Bg Ratio | pvalue | p.adjust | qvalue | Count |
| Page: 1 |
Top |
Cell-cell communication analysis |
| Identification of potential cell-cell interactions between two cell types and their ligand-receptor pairs for different disease states |
| Ligand | Receptor | LRpair | Pathway | Tissue | Disease Stage |
| Page: 1 |
Top |
Single-cell gene regulatory network inference analysis |
| Find out the significant the regulons (TFs) and the target genes of each regulon across cell types for different disease states |
| TF | Cell Type | Tissue | Disease Stage | Target Gene | RSS | Regulon Activity |
| ∗The dot plots of a searched regulon are shown for all cell subpopulations in each disease state of each tissue based on the regulon specific score inferred using pySCENIC and by calculating the average expression. |
| Page: 1 |
Top |
Somatic mutation of malignant transformation related genes |
| Annotation of somatic variants for genes involved in malignant transformation |
| Hugo Symbol | Variant Class | Variant Classification | dbSNP RS | HGVSc | HGVSp | HGVSp Short | SWISSPROT | BIOTYPE | SIFT | PolyPhen | Tumor Sample Barcode | Tissue | Histology | Sex | Age | Stage | Therapy Types | Drugs | Outcome |
| C2CD5 | SNV | Missense_Mutation | novel | c.695C>G | p.Ser232Cys | p.S232C | Q86YS7 | protein_coding | tolerated(0.07) | probably_damaging(0.982) | TCGA-5L-AAT1-01 | Breast | breast invasive carcinoma | Female | <65 | III/IV | Hormone Therapy | letrozol | SD |
| C2CD5 | SNV | Missense_Mutation | novel | c.443N>T | p.Cys148Phe | p.C148F | Q86YS7 | protein_coding | tolerated(0.6) | possibly_damaging(0.571) | TCGA-AC-A3QP-01 | Breast | breast invasive carcinoma | Female | >=65 | I/II | Hormone Therapy | femara | SD |
| C2CD5 | SNV | Missense_Mutation | c.542N>A | p.Arg181Gln | p.R181Q | Q86YS7 | protein_coding | deleterious(0.01) | possibly_damaging(0.459) | TCGA-AN-A046-01 | Breast | breast invasive carcinoma | Female | >=65 | I/II | Unknown | Unknown | SD | |
| C2CD5 | SNV | Missense_Mutation | novel | c.389N>C | p.Leu130Pro | p.L130P | Q86YS7 | protein_coding | deleterious(0) | possibly_damaging(0.782) | TCGA-C8-A8HR-01 | Breast | breast invasive carcinoma | Female | <65 | III/IV | Chemotherapy | 5-fluorouracil | CR |
| C2CD5 | SNV | Missense_Mutation | c.547N>T | p.Arg183Cys | p.R183C | Q86YS7 | protein_coding | deleterious(0) | probably_damaging(0.972) | TCGA-D8-A1Y1-01 | Breast | breast invasive carcinoma | Female | >=65 | III/IV | Hormone Therapy | tamoxiphen | PD | |
| C2CD5 | SNV | Missense_Mutation | c.542N>A | p.Arg181Gln | p.R181Q | Q86YS7 | protein_coding | deleterious(0.01) | possibly_damaging(0.459) | TCGA-E2-A155-01 | Breast | breast invasive carcinoma | Female | <65 | I/II | Chemotherapy | cytoxan | SD | |
| C2CD5 | SNV | Missense_Mutation | novel | c.2495N>G | p.Asp832Gly | p.D832G | Q86YS7 | protein_coding | tolerated(0.09) | benign(0.275) | TCGA-S3-AA17-01 | Breast | breast invasive carcinoma | Female | <65 | I/II | Hormone Therapy | anastrozole | SD |
| C2CD5 | SNV | Missense_Mutation | novel | c.2503N>A | p.Glu835Lys | p.E835K | Q86YS7 | protein_coding | tolerated(0.09) | benign(0.329) | TCGA-2W-A8YY-01 | Cervix | cervical & endocervical cancer | Female | <65 | I/II | Chemotherapy | cisplatin | CR |
| C2CD5 | SNV | Missense_Mutation | c.542G>A | p.Arg181Gln | p.R181Q | Q86YS7 | protein_coding | deleterious(0.01) | possibly_damaging(0.459) | TCGA-FU-A3HZ-01 | Cervix | cervical & endocervical cancer | Female | <65 | I/II | Chemotherapy | cisplatin | CR | |
| C2CD5 | SNV | Missense_Mutation | novel | c.484C>A | p.His162Asn | p.H162N | Q86YS7 | protein_coding | deleterious(0.03) | benign(0.366) | TCGA-JX-A3Q0-01 | Cervix | cervical & endocervical cancer | Female | <65 | III/IV | Unknown | Unknown | SD |
| Page: 1 2 3 4 5 6 7 8 9 10 11 12 13 |
Top |
Related drugs of malignant transformation related genes |
| Identification of chemicals and drugs interact with genes involved in malignant transfromation |
| (DGIdb 4.0) |
| Entrez ID | Symbol | Category | Interaction Types | Drug Claim Name | Drug Name | PMIDs |
| Page: 1 |

Copyright 2023-Present -The University of Texas Health Science Center at Houston |