
|
|||||
|
 | |
| |
| |
| |
| |
| |
|
Gene: C21orf91 |
Gene summary for C21ORF91 |
| Gene information | Species | Human | Gene symbol | C21orf91 | Gene ID | 54149 |
| Gene name | chromosome 21 open reading frame 91 | |
| Gene Alias | C21orf14 | |
| Cytomap | 21q21.1 | |
| Gene Type | protein-coding | GO ID | GO:0007275 | UniProtAcc | Q68DA1 |
Top |
Malignant transformation analysis |
| Identification of the aberrant gene expression in precancerous and cancerous lesions by comparing the gene expression of stem-like cells in diseased tissues with normal stem cells |
| Entrez ID | Symbol | Replicates | Species | Organ | Tissue | Adj P-value | Log2FC | Malignancy |
| 54149 | C21orf91 | LZE2T | Human | Esophagus | ESCC | 4.61e-03 | 5.41e-01 | 0.082 |
| 54149 | C21orf91 | LZE4T | Human | Esophagus | ESCC | 4.02e-27 | 8.14e-01 | 0.0811 |
| 54149 | C21orf91 | LZE7T | Human | Esophagus | ESCC | 7.21e-07 | 6.32e-01 | 0.0667 |
| 54149 | C21orf91 | LZE8T | Human | Esophagus | ESCC | 1.02e-07 | 3.76e-01 | 0.067 |
| 54149 | C21orf91 | LZE24T | Human | Esophagus | ESCC | 1.50e-12 | 3.48e-01 | 0.0596 |
| 54149 | C21orf91 | LZE6T | Human | Esophagus | ESCC | 6.81e-03 | 1.68e-01 | 0.0845 |
| 54149 | C21orf91 | P1T-E | Human | Esophagus | ESCC | 2.37e-02 | 2.11e-01 | 0.0875 |
| 54149 | C21orf91 | P2T-E | Human | Esophagus | ESCC | 2.79e-29 | 5.82e-01 | 0.1177 |
| 54149 | C21orf91 | P4T-E | Human | Esophagus | ESCC | 1.04e-34 | 7.49e-01 | 0.1323 |
| 54149 | C21orf91 | P5T-E | Human | Esophagus | ESCC | 2.04e-13 | 1.97e-01 | 0.1327 |
| 54149 | C21orf91 | P8T-E | Human | Esophagus | ESCC | 9.19e-14 | 1.46e-01 | 0.0889 |
| 54149 | C21orf91 | P9T-E | Human | Esophagus | ESCC | 3.26e-27 | 8.20e-01 | 0.1131 |
| 54149 | C21orf91 | P10T-E | Human | Esophagus | ESCC | 1.31e-40 | 9.18e-01 | 0.116 |
| 54149 | C21orf91 | P11T-E | Human | Esophagus | ESCC | 1.77e-06 | 5.63e-01 | 0.1426 |
| 54149 | C21orf91 | P12T-E | Human | Esophagus | ESCC | 2.78e-17 | 4.69e-01 | 0.1122 |
| 54149 | C21orf91 | P15T-E | Human | Esophagus | ESCC | 1.23e-28 | 6.85e-01 | 0.1149 |
| 54149 | C21orf91 | P16T-E | Human | Esophagus | ESCC | 1.70e-16 | 3.16e-01 | 0.1153 |
| 54149 | C21orf91 | P17T-E | Human | Esophagus | ESCC | 1.28e-05 | 3.34e-01 | 0.1278 |
| 54149 | C21orf91 | P19T-E | Human | Esophagus | ESCC | 9.58e-03 | 2.47e-01 | 0.1662 |
| 54149 | C21orf91 | P20T-E | Human | Esophagus | ESCC | 1.06e-12 | 2.69e-01 | 0.1124 |
| Page: 1 2 3 4 |
| Tissue | Expression Dynamics | Abbreviation |
| Esophagus |  | ESCC: Esophageal squamous cell carcinoma |
| HGIN: High-grade intraepithelial neoplasias | ||
| LGIN: Low-grade intraepithelial neoplasias | ||
| Oral Cavity | 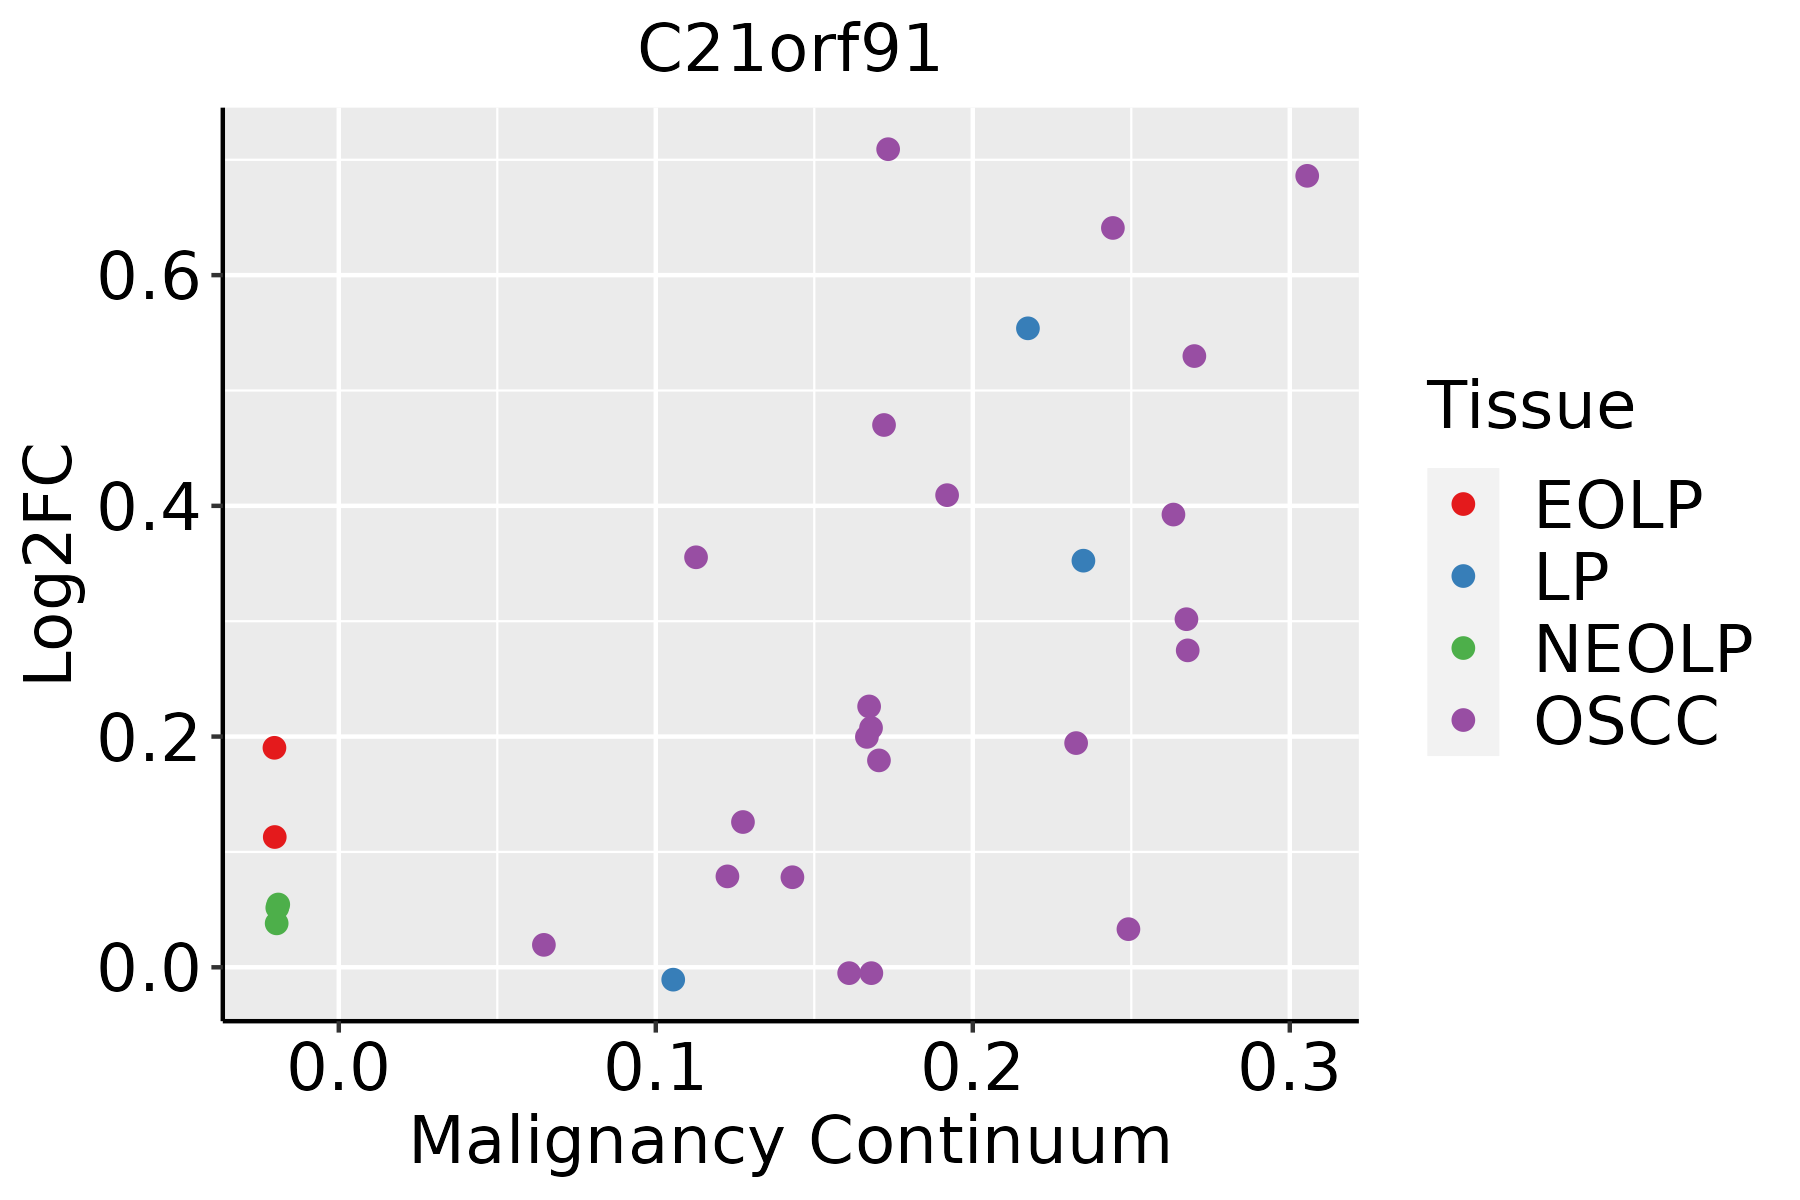 | EOLP: Erosive Oral lichen planus |
| LP: leukoplakia | ||
| NEOLP: Non-erosive oral lichen planus | ||
| OSCC: Oral squamous cell carcinoma | ||
| Skin | 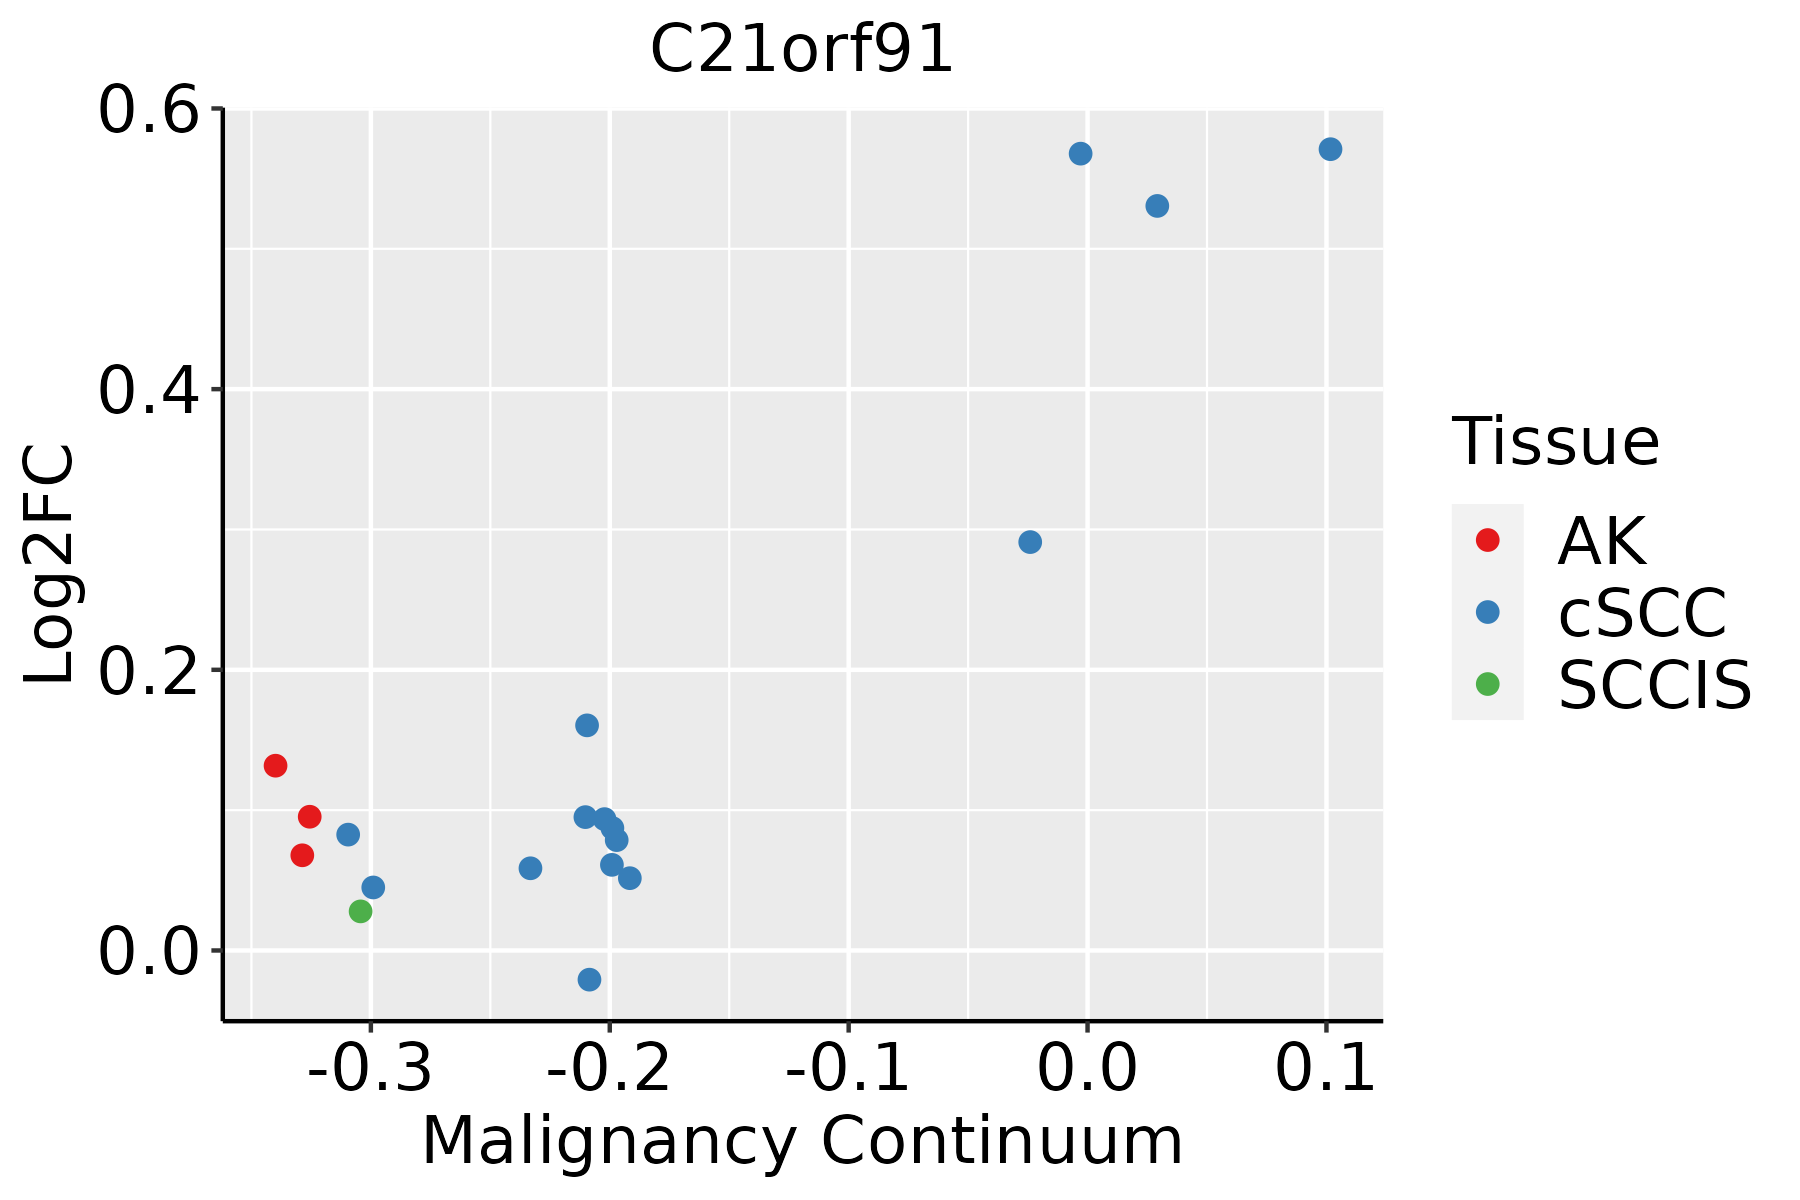 | AK: Actinic keratosis |
| cSCC: Cutaneous squamous cell carcinoma | ||
| SCCIS:squamous cell carcinoma in situ |
| ∗log2FC in expression of this searched gene in stem-like cells from each diseased tissue sample relative to stem-like cells in normal samples in each tissue plotted against the malignancy continuum. Samples are colored based on if they are from different disease stage. |
Top |
Malignant transformation related pathway analysis |
| Find out the enriched GO biological processes and KEGG pathways involved in transition from healthy to precancer to cancer |
| Tissue | Disease Stage | Enriched GO biological Processes |
| Colorectum | AD |  |
| Colorectum | SER |  |
| Colorectum | MSS |  |
| Colorectum | MSI-H |  |
| Colorectum | FAP |  |
| ∗Top 15 enriched GO BP terms are showed in the bar plot of each disease state in each tissue. Each row represents a significant GO biological process which is colored according to the -log10(p.adjust). |
| Page: 1 2 3 4 5 6 7 8 9 |
| GO ID | Tissue | Disease Stage | Description | Gene Ratio | Bg Ratio | pvalue | p.adjust | Count |
| GO:001635816 | Esophagus | ESCC | dendrite development | 130/8552 | 243/18723 | 8.33e-03 | 2.95e-02 | 130 |
| GO:001635810 | Oral cavity | OSCC | dendrite development | 113/7305 | 243/18723 | 1.00e-02 | 3.49e-02 | 113 |
| GO:00609967 | Oral cavity | OSCC | dendritic spine development | 50/7305 | 99/18723 | 1.31e-02 | 4.34e-02 | 50 |
| GO:006099821 | Skin | cSCC | regulation of dendritic spine development | 28/4864 | 61/18723 | 6.07e-04 | 4.38e-03 | 28 |
| GO:006099622 | Skin | cSCC | dendritic spine development | 40/4864 | 99/18723 | 1.18e-03 | 7.70e-03 | 40 |
| Page: 1 |
| Pathway ID | Tissue | Disease Stage | Description | Gene Ratio | Bg Ratio | pvalue | p.adjust | qvalue | Count |
| Page: 1 |
Top |
Cell-cell communication analysis |
| Identification of potential cell-cell interactions between two cell types and their ligand-receptor pairs for different disease states |
| Ligand | Receptor | LRpair | Pathway | Tissue | Disease Stage |
| Page: 1 |
Top |
Single-cell gene regulatory network inference analysis |
| Find out the significant the regulons (TFs) and the target genes of each regulon across cell types for different disease states |
| TF | Cell Type | Tissue | Disease Stage | Target Gene | RSS | Regulon Activity |
| ∗The dot plots of a searched regulon are shown for all cell subpopulations in each disease state of each tissue based on the regulon specific score inferred using pySCENIC and by calculating the average expression. |
| Page: 1 |
Top |
Somatic mutation of malignant transformation related genes |
| Annotation of somatic variants for genes involved in malignant transformation |
| Hugo Symbol | Variant Class | Variant Classification | dbSNP RS | HGVSc | HGVSp | HGVSp Short | SWISSPROT | BIOTYPE | SIFT | PolyPhen | Tumor Sample Barcode | Tissue | Histology | Sex | Age | Stage | Therapy Types | Drugs | Outcome |
| C21orf91 | SNV | Missense_Mutation | c.58N>T | p.Val20Phe | p.V20F | Q9NYK6 | protein_coding | deleterious(0) | possibly_damaging(0.875) | TCGA-A2-A04W-01 | Breast | breast invasive carcinoma | Female | <65 | I/II | Chemotherapy | cytoxan | SD | |
| C21orf91 | SNV | Missense_Mutation | c.338N>T | p.Ser113Phe | p.S113F | Q9NYK6 | protein_coding | deleterious(0) | benign(0.021) | TCGA-E9-A22B-01 | Breast | breast invasive carcinoma | Female | >=65 | I/II | Hormone Therapy | tamoxiphen | SD | |
| C21orf91 | SNV | Missense_Mutation | novel | c.750N>A | p.His250Gln | p.H250Q | Q9NYK6 | protein_coding | tolerated(0.62) | benign(0.006) | TCGA-GM-A3NY-01 | Breast | breast invasive carcinoma | Female | >=65 | I/II | Hormone Therapy | arimidex | SD |
| C21orf91 | insertion | Frame_Shift_Ins | novel | c.760_761insTAATTCTGGGA | p.Glu254ValfsTer24 | p.E254Vfs*24 | Q9NYK6 | protein_coding | TCGA-AR-A0TU-01 | Breast | breast invasive carcinoma | Female | <65 | I/II | Unspecific | Doxorubicin | SD | ||
| C21orf91 | SNV | Missense_Mutation | novel | c.26N>T | p.Asn9Ile | p.N9I | Q9NYK6 | protein_coding | deleterious(0) | possibly_damaging(0.792) | TCGA-AM-5820-01 | Colorectum | colon adenocarcinoma | Female | <65 | I/II | Unknown | Unknown | SD |
| C21orf91 | SNV | Missense_Mutation | novel | c.770N>A | p.Ser257Tyr | p.S257Y | Q9NYK6 | protein_coding | deleterious(0) | probably_damaging(0.993) | TCGA-CA-6717-01 | Colorectum | colon adenocarcinoma | Male | <65 | I/II | Chemotherapy | oxaliplatin | CR |
| C21orf91 | SNV | Missense_Mutation | c.394C>A | p.Leu132Ile | p.L132I | Q9NYK6 | protein_coding | tolerated(0.05) | probably_damaging(0.968) | TCGA-CM-6161-01 | Colorectum | colon adenocarcinoma | Female | <65 | I/II | Unknown | Unknown | SD | |
| C21orf91 | SNV | Missense_Mutation | rs778384745 | c.586N>A | p.Ala196Thr | p.A196T | Q9NYK6 | protein_coding | tolerated(0.26) | benign(0.003) | TCGA-D5-6929-01 | Colorectum | colon adenocarcinoma | Female | <65 | III/IV | Chemotherapy | oxaliplatinum+ | SD |
| C21orf91 | SNV | Missense_Mutation | rs75916355 | c.808N>A | p.Glu270Lys | p.E270K | Q9NYK6 | protein_coding | deleterious(0) | probably_damaging(0.999) | TCGA-EI-6917-01 | Colorectum | rectum adenocarcinoma | Male | <65 | III/IV | Chemotherapy | 5fluorouracil+oxaciplatina+l-folinian | SD |
| C21orf91 | insertion | Frame_Shift_Ins | novel | c.597_598insA | p.Glu200ArgfsTer6 | p.E200Rfs*6 | Q9NYK6 | protein_coding | TCGA-AG-A02N-01 | Colorectum | rectum adenocarcinoma | Male | >=65 | I/II | Chemotherapy | folinic | CR |
| Page: 1 2 3 4 |
Top |
Related drugs of malignant transformation related genes |
| Identification of chemicals and drugs interact with genes involved in malignant transfromation |
| (DGIdb 4.0) |
| Entrez ID | Symbol | Category | Interaction Types | Drug Claim Name | Drug Name | PMIDs |
| Page: 1 |

Copyright 2023-Present -The University of Texas Health Science Center at Houston |