
|
|||||
|
 | |
| |
| |
| |
| |
| |
|
Gene: C21orf2 |
Gene summary for C21ORF2 |
| Gene information | Species | Human | Gene symbol | C21orf2 | Gene ID | 755 |
| Gene name | cilia and flagella associated protein 410 | |
| Gene Alias | C21orf2 | |
| Cytomap | 21q22.3 | |
| Gene Type | protein-coding | GO ID | GO:0000902 | UniProtAcc | O43822 |
Top |
Malignant transformation analysis |
| Identification of the aberrant gene expression in precancerous and cancerous lesions by comparing the gene expression of stem-like cells in diseased tissues with normal stem cells |
| Entrez ID | Symbol | Replicates | Species | Organ | Tissue | Adj P-value | Log2FC | Malignancy |
| 755 | C21orf2 | P1T-E | Human | Esophagus | ESCC | 7.11e-04 | 2.31e-01 | 0.0875 |
| 755 | C21orf2 | P2T-E | Human | Esophagus | ESCC | 4.19e-25 | 3.71e-01 | 0.1177 |
| 755 | C21orf2 | P4T-E | Human | Esophagus | ESCC | 1.39e-22 | 4.49e-01 | 0.1323 |
| 755 | C21orf2 | P5T-E | Human | Esophagus | ESCC | 4.41e-07 | 1.56e-01 | 0.1327 |
| 755 | C21orf2 | P8T-E | Human | Esophagus | ESCC | 6.56e-15 | 2.59e-01 | 0.0889 |
| 755 | C21orf2 | P9T-E | Human | Esophagus | ESCC | 1.88e-05 | 1.66e-01 | 0.1131 |
| 755 | C21orf2 | P10T-E | Human | Esophagus | ESCC | 5.12e-47 | 7.31e-01 | 0.116 |
| 755 | C21orf2 | P11T-E | Human | Esophagus | ESCC | 2.96e-18 | 5.17e-01 | 0.1426 |
| 755 | C21orf2 | P12T-E | Human | Esophagus | ESCC | 9.75e-23 | 3.68e-01 | 0.1122 |
| 755 | C21orf2 | P15T-E | Human | Esophagus | ESCC | 8.45e-04 | 1.25e-01 | 0.1149 |
| 755 | C21orf2 | P16T-E | Human | Esophagus | ESCC | 1.53e-19 | 3.47e-01 | 0.1153 |
| 755 | C21orf2 | P17T-E | Human | Esophagus | ESCC | 1.49e-05 | 2.44e-01 | 0.1278 |
| 755 | C21orf2 | P19T-E | Human | Esophagus | ESCC | 3.75e-07 | 4.81e-01 | 0.1662 |
| 755 | C21orf2 | P20T-E | Human | Esophagus | ESCC | 2.86e-10 | 2.28e-01 | 0.1124 |
| 755 | C21orf2 | P21T-E | Human | Esophagus | ESCC | 8.73e-28 | 4.19e-01 | 0.1617 |
| 755 | C21orf2 | P22T-E | Human | Esophagus | ESCC | 6.38e-31 | 4.91e-01 | 0.1236 |
| 755 | C21orf2 | P23T-E | Human | Esophagus | ESCC | 2.24e-10 | 2.53e-01 | 0.108 |
| 755 | C21orf2 | P24T-E | Human | Esophagus | ESCC | 4.30e-10 | 2.32e-01 | 0.1287 |
| 755 | C21orf2 | P26T-E | Human | Esophagus | ESCC | 4.12e-11 | 1.77e-01 | 0.1276 |
| 755 | C21orf2 | P27T-E | Human | Esophagus | ESCC | 1.59e-30 | 4.85e-01 | 0.1055 |
| Page: 1 2 3 4 5 |
| Tissue | Expression Dynamics | Abbreviation |
| Esophagus |  | ESCC: Esophageal squamous cell carcinoma |
| HGIN: High-grade intraepithelial neoplasias | ||
| LGIN: Low-grade intraepithelial neoplasias | ||
| Liver |  | HCC: Hepatocellular carcinoma |
| NAFLD: Non-alcoholic fatty liver disease | ||
| Oral Cavity |  | EOLP: Erosive Oral lichen planus |
| LP: leukoplakia | ||
| NEOLP: Non-erosive oral lichen planus | ||
| OSCC: Oral squamous cell carcinoma | ||
| Thyroid | 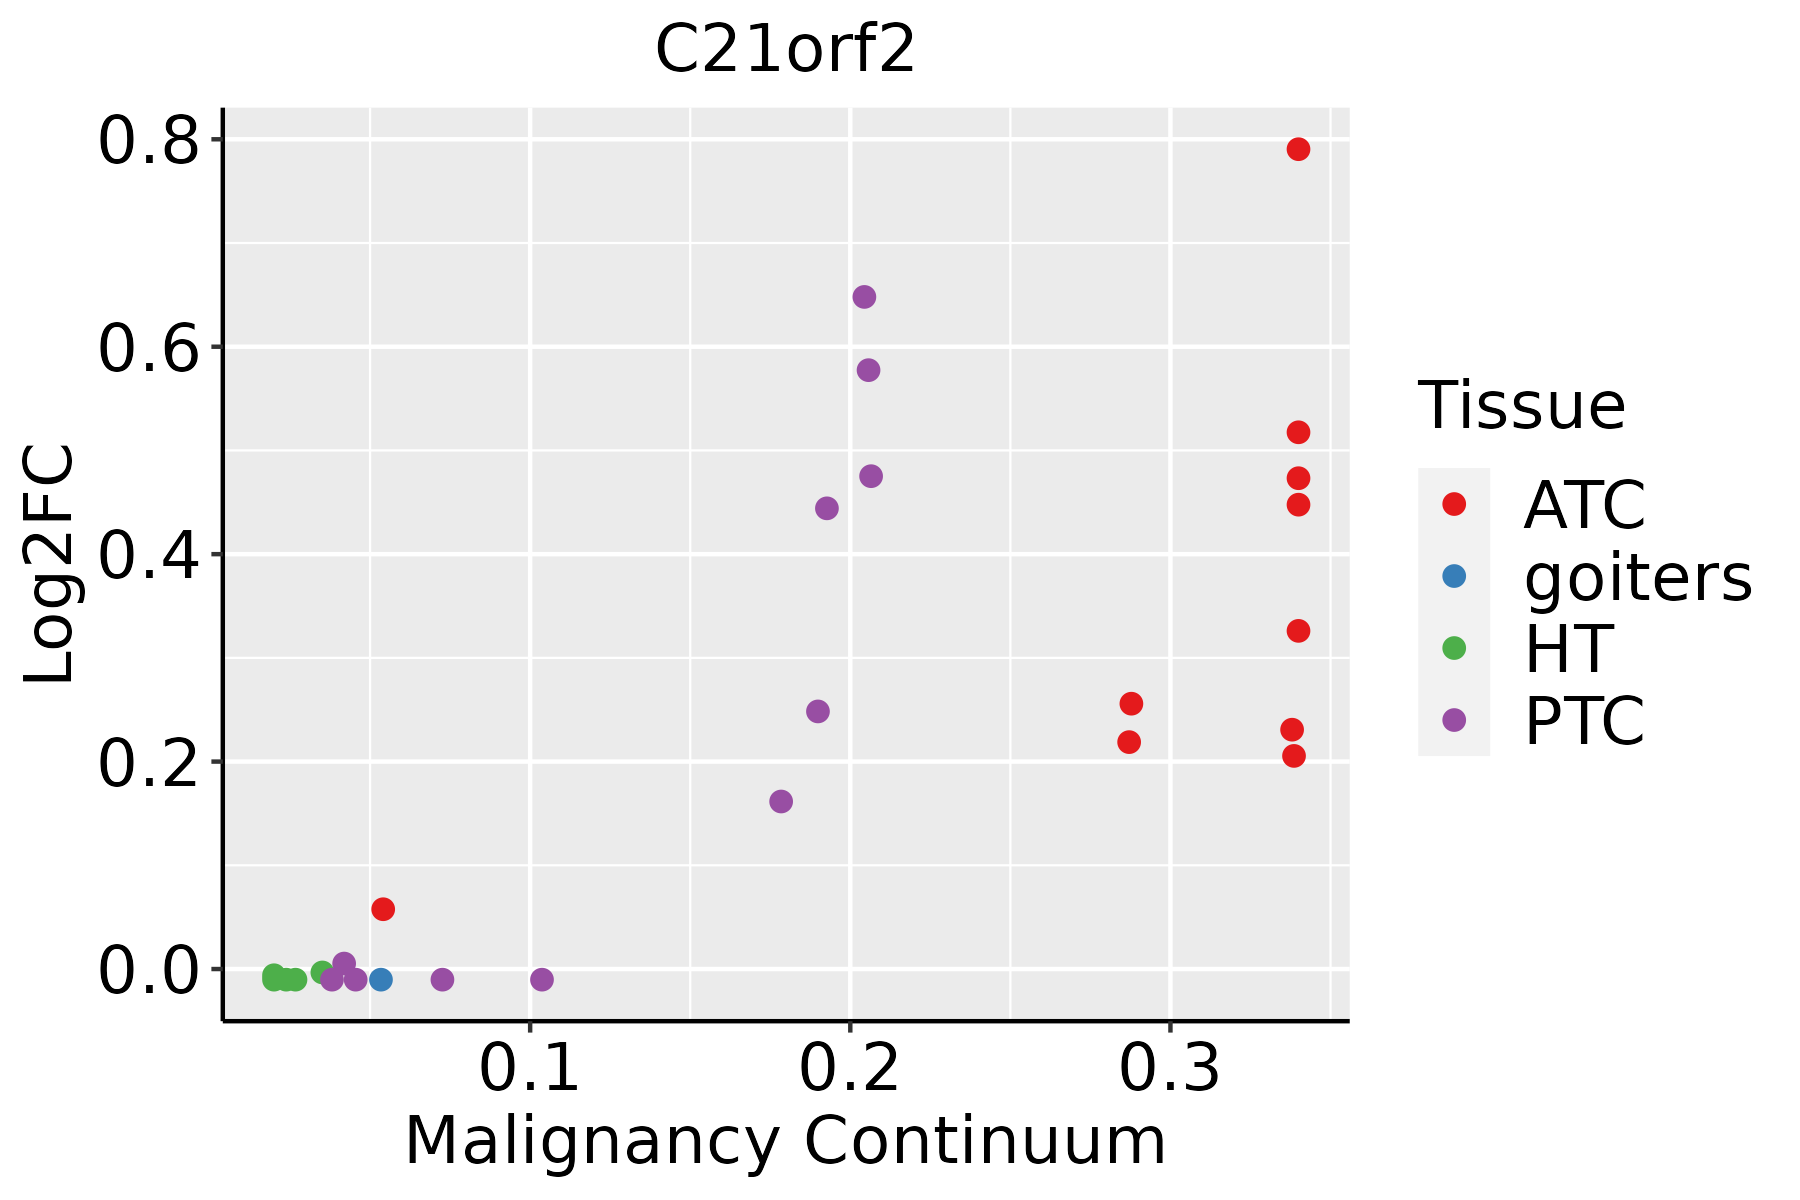 | ATC: Anaplastic thyroid cancer |
| HT: Hashimoto's thyroiditis | ||
| PTC: Papillary thyroid cancer |
| ∗log2FC in expression of this searched gene in stem-like cells from each diseased tissue sample relative to stem-like cells in normal samples in each tissue plotted against the malignancy continuum. Samples are colored based on if they are from different disease stage. |
Top |
Malignant transformation related pathway analysis |
| Find out the enriched GO biological processes and KEGG pathways involved in transition from healthy to precancer to cancer |
| Tissue | Disease Stage | Enriched GO biological Processes |
| Colorectum | AD |  |
| Colorectum | SER |  |
| Colorectum | MSS |  |
| Colorectum | MSI-H |  |
| Colorectum | FAP |  |
| ∗Top 15 enriched GO BP terms are showed in the bar plot of each disease state in each tissue. Each row represents a significant GO biological process which is colored according to the -log10(p.adjust). |
| Page: 1 2 3 4 5 6 7 8 9 |
| GO ID | Tissue | Disease Stage | Description | Gene Ratio | Bg Ratio | pvalue | p.adjust | Count |
| Page: 1 |
| Pathway ID | Tissue | Disease Stage | Description | Gene Ratio | Bg Ratio | pvalue | p.adjust | qvalue | Count |
| Page: 1 |
Top |
Cell-cell communication analysis |
| Identification of potential cell-cell interactions between two cell types and their ligand-receptor pairs for different disease states |
| Ligand | Receptor | LRpair | Pathway | Tissue | Disease Stage |
| Page: 1 |
Top |
Single-cell gene regulatory network inference analysis |
| Find out the significant the regulons (TFs) and the target genes of each regulon across cell types for different disease states |
| TF | Cell Type | Tissue | Disease Stage | Target Gene | RSS | Regulon Activity |
| ∗The dot plots of a searched regulon are shown for all cell subpopulations in each disease state of each tissue based on the regulon specific score inferred using pySCENIC and by calculating the average expression. |
| Page: 1 |
Top |
Somatic mutation of malignant transformation related genes |
| Annotation of somatic variants for genes involved in malignant transformation |
| Hugo Symbol | Variant Class | Variant Classification | dbSNP RS | HGVSc | HGVSp | HGVSp Short | SWISSPROT | BIOTYPE | SIFT | PolyPhen | Tumor Sample Barcode | Tissue | Histology | Sex | Age | Stage | Therapy Types | Drugs | Outcome |
| C21orf2 | SNV | Missense_Mutation | novel | c.769N>A | p.Glu257Lys | p.E257K | O43822 | protein_coding | tolerated_low_confidence(0.69) | benign(0) | TCGA-C8-A26Y-01 | Breast | breast invasive carcinoma | Female | >=65 | I/II | Unknown | Unknown | SD |
| C21orf2 | SNV | Missense_Mutation | c.129N>T | p.Glu43Asp | p.E43D | O43822 | protein_coding | deleterious(0.01) | probably_damaging(0.993) | TCGA-A6-2686-01 | Colorectum | colon adenocarcinoma | Female | >=65 | I/II | Unknown | Unknown | SD | |
| C21orf2 | SNV | Missense_Mutation | rs553278564 | c.260C>T | p.Pro87Leu | p.P87L | O43822 | protein_coding | deleterious(0) | probably_damaging(0.943) | TCGA-CK-6746-01 | Colorectum | colon adenocarcinoma | Female | >=65 | I/II | Unknown | Unknown | SD |
| C21orf2 | SNV | Missense_Mutation | c.404T>C | p.Leu135Pro | p.L135P | O43822 | protein_coding | deleterious(0) | probably_damaging(0.949) | TCGA-CM-5861-01 | Colorectum | colon adenocarcinoma | Female | <65 | I/II | Unknown | Unknown | PD | |
| C21orf2 | SNV | Missense_Mutation | novel | c.973C>A | p.Leu325Ile | p.L325I | O43822 | protein_coding | deleterious_low_confidence(0.05) | benign(0.067) | TCGA-AJ-A3EL-01 | Endometrium | uterine corpus endometrioid carcinoma | Female | <65 | I/II | Unknown | Unknown | SD |
| C21orf2 | SNV | Missense_Mutation | rs760073135 | c.263G>A | p.Arg88His | p.R88H | O43822 | protein_coding | tolerated(0.13) | benign(0.041) | TCGA-B5-A0K9-01 | Endometrium | uterine corpus endometrioid carcinoma | Female | >=65 | I/II | Unknown | Unknown | SD |
| C21orf2 | SNV | Missense_Mutation | c.443N>G | p.Glu148Gly | p.E148G | O43822 | protein_coding | deleterious(0.04) | benign(0.351) | TCGA-B5-A1MX-01 | Endometrium | uterine corpus endometrioid carcinoma | Female | <65 | I/II | Hormone Therapy | megace | SD | |
| C21orf2 | SNV | Missense_Mutation | novel | c.856G>A | p.Ala286Thr | p.A286T | O43822 | protein_coding | tolerated_low_confidence(0.72) | benign(0.099) | TCGA-EO-A22X-01 | Endometrium | uterine corpus endometrioid carcinoma | Female | <65 | III/IV | Unspecific | Carboplatin | Complete Response |
| C21orf2 | SNV | Missense_Mutation | rs780892823 | c.367A>G | p.Asn123Asp | p.N123D | O43822 | protein_coding | deleterious(0.04) | probably_damaging(0.971) | TCGA-EO-A22X-01 | Endometrium | uterine corpus endometrioid carcinoma | Female | <65 | III/IV | Unspecific | Carboplatin | Complete Response |
| C21orf2 | SNV | Missense_Mutation | novel | c.869T>C | p.Leu290Pro | p.L290P | O43822 | protein_coding | tolerated_low_confidence(0.15) | possibly_damaging(0.601) | TCGA-FI-A2D5-01 | Endometrium | uterine corpus endometrioid carcinoma | Female | <65 | III/IV | Chemotherapy | carboplatinum | PD |
| Page: 1 2 |
Top |
Related drugs of malignant transformation related genes |
| Identification of chemicals and drugs interact with genes involved in malignant transfromation |
| (DGIdb 4.0) |
| Entrez ID | Symbol | Category | Interaction Types | Drug Claim Name | Drug Name | PMIDs |
| Page: 1 |

Copyright 2023-Present -The University of Texas Health Science Center at Houston |