
|
|||||
|
 | |
| |
| |
| |
| |
| |
|
Gene: C20orf96 |
Gene summary for C20ORF96 |
| Gene information | Species | Human | Gene symbol | C20orf96 | Gene ID | 140680 |
| Gene name | chromosome 20 open reading frame 96 | |
| Gene Alias | dJ1103G7.2 | |
| Cytomap | 20p13 | |
| Gene Type | protein-coding | GO ID | NA | UniProtAcc | B7ZML9 |
Top |
Malignant transformation analysis |
| Identification of the aberrant gene expression in precancerous and cancerous lesions by comparing the gene expression of stem-like cells in diseased tissues with normal stem cells |
| Entrez ID | Symbol | Replicates | Species | Organ | Tissue | Adj P-value | Log2FC | Malignancy |
| 140680 | C20orf96 | LZE24T | Human | Esophagus | ESCC | 2.29e-10 | 2.90e-01 | 0.0596 |
| 140680 | C20orf96 | P1T-E | Human | Esophagus | ESCC | 6.07e-08 | 3.44e-01 | 0.0875 |
| 140680 | C20orf96 | P2T-E | Human | Esophagus | ESCC | 3.90e-10 | 1.30e-01 | 0.1177 |
| 140680 | C20orf96 | P4T-E | Human | Esophagus | ESCC | 9.37e-10 | 2.21e-01 | 0.1323 |
| 140680 | C20orf96 | P8T-E | Human | Esophagus | ESCC | 1.09e-08 | 7.84e-02 | 0.0889 |
| 140680 | C20orf96 | P10T-E | Human | Esophagus | ESCC | 9.99e-13 | 1.82e-01 | 0.116 |
| 140680 | C20orf96 | P12T-E | Human | Esophagus | ESCC | 5.31e-12 | 2.35e-01 | 0.1122 |
| 140680 | C20orf96 | P15T-E | Human | Esophagus | ESCC | 5.28e-03 | 4.80e-02 | 0.1149 |
| 140680 | C20orf96 | P16T-E | Human | Esophagus | ESCC | 6.13e-09 | 1.34e-01 | 0.1153 |
| 140680 | C20orf96 | P17T-E | Human | Esophagus | ESCC | 2.40e-05 | 2.33e-01 | 0.1278 |
| 140680 | C20orf96 | P20T-E | Human | Esophagus | ESCC | 1.72e-04 | 9.36e-02 | 0.1124 |
| 140680 | C20orf96 | P21T-E | Human | Esophagus | ESCC | 3.48e-11 | 1.15e-01 | 0.1617 |
| 140680 | C20orf96 | P22T-E | Human | Esophagus | ESCC | 1.14e-06 | 6.42e-02 | 0.1236 |
| 140680 | C20orf96 | P23T-E | Human | Esophagus | ESCC | 1.23e-10 | 2.14e-01 | 0.108 |
| 140680 | C20orf96 | P24T-E | Human | Esophagus | ESCC | 7.78e-05 | 4.71e-02 | 0.1287 |
| 140680 | C20orf96 | P26T-E | Human | Esophagus | ESCC | 3.37e-08 | 1.69e-01 | 0.1276 |
| 140680 | C20orf96 | P27T-E | Human | Esophagus | ESCC | 3.87e-11 | 1.95e-01 | 0.1055 |
| 140680 | C20orf96 | P28T-E | Human | Esophagus | ESCC | 3.76e-18 | 1.42e-01 | 0.1149 |
| 140680 | C20orf96 | P30T-E | Human | Esophagus | ESCC | 2.52e-03 | 1.12e-01 | 0.137 |
| 140680 | C20orf96 | P31T-E | Human | Esophagus | ESCC | 1.03e-04 | 1.22e-01 | 0.1251 |
| Page: 1 2 3 |
| Tissue | Expression Dynamics | Abbreviation |
| Esophagus | 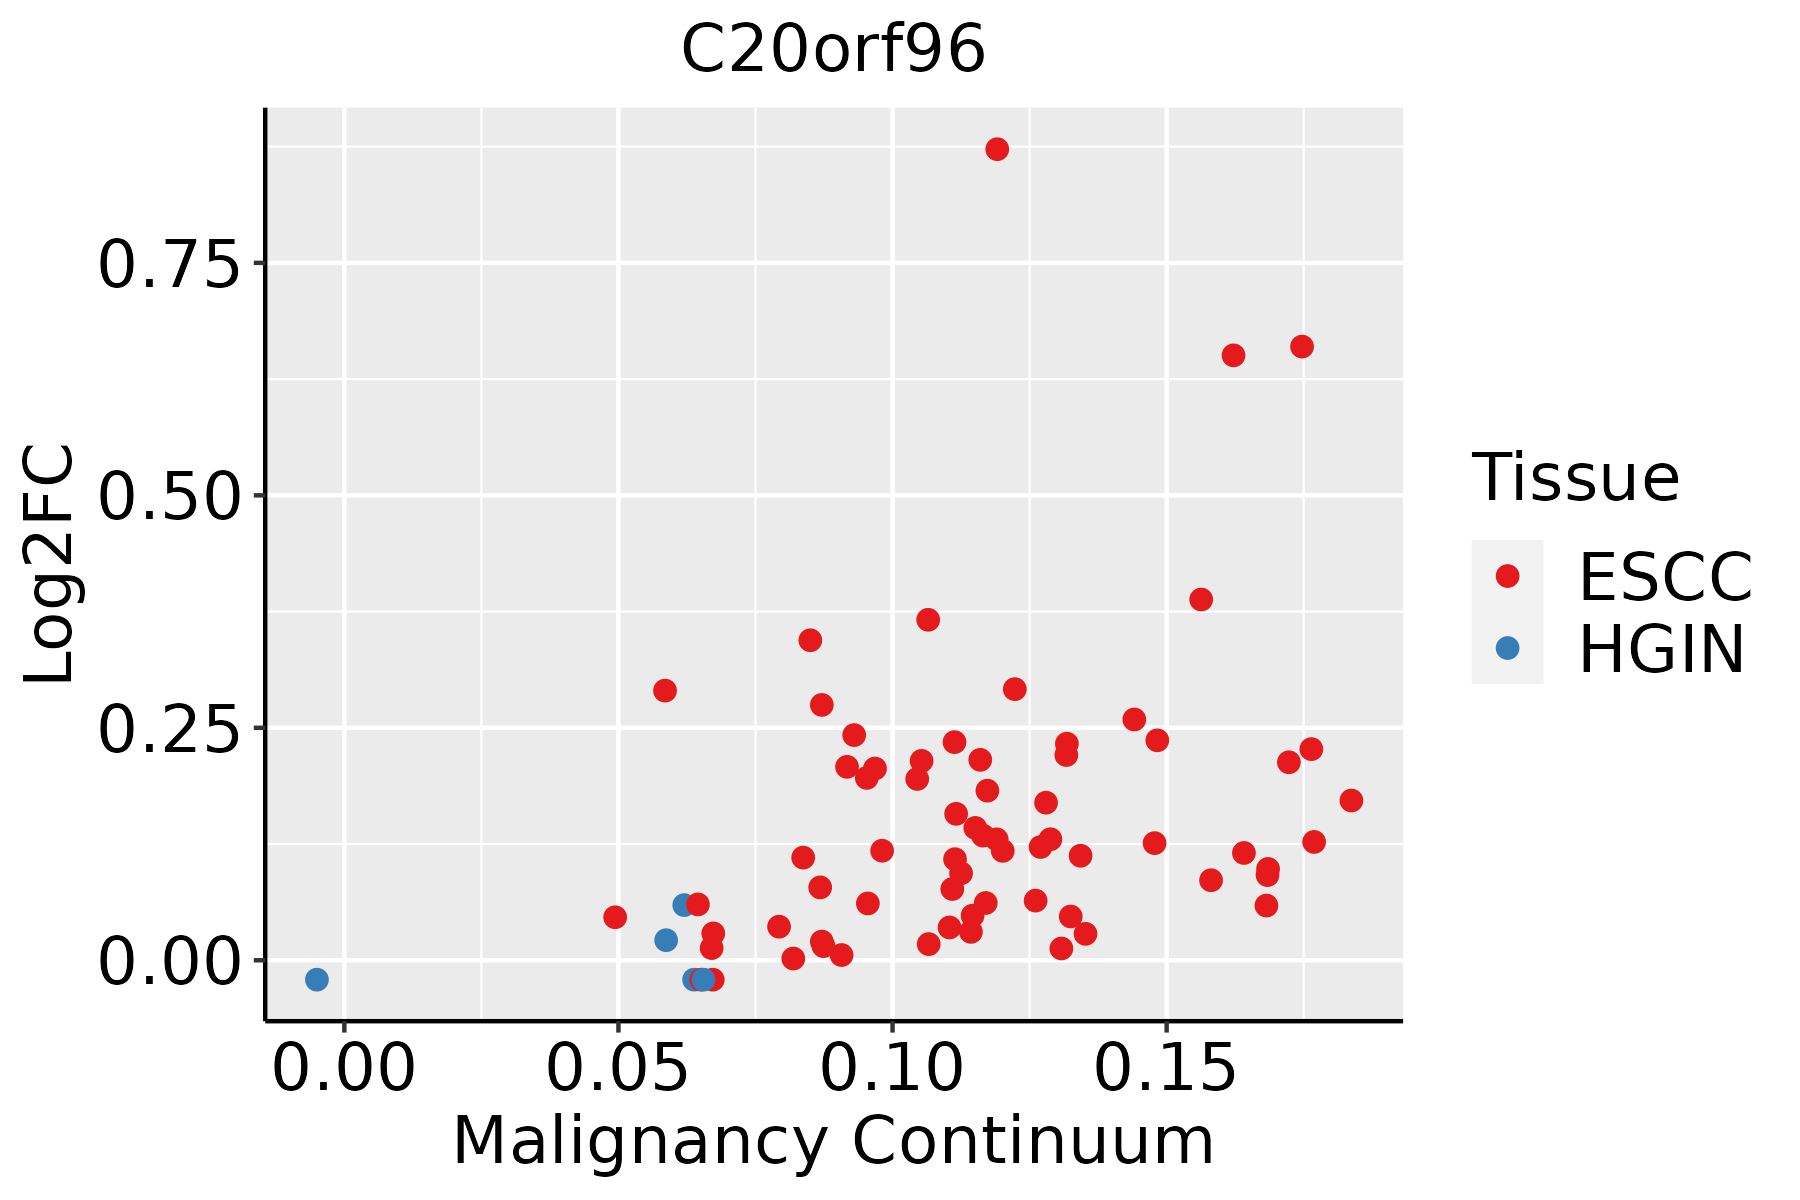 | ESCC: Esophageal squamous cell carcinoma |
| HGIN: High-grade intraepithelial neoplasias | ||
| LGIN: Low-grade intraepithelial neoplasias |
| ∗log2FC in expression of this searched gene in stem-like cells from each diseased tissue sample relative to stem-like cells in normal samples in each tissue plotted against the malignancy continuum. Samples are colored based on if they are from different disease stage. |
Top |
Malignant transformation related pathway analysis |
| Find out the enriched GO biological processes and KEGG pathways involved in transition from healthy to precancer to cancer |
| Tissue | Disease Stage | Enriched GO biological Processes |
| Colorectum | AD |  |
| Colorectum | SER |  |
| Colorectum | MSS |  |
| Colorectum | MSI-H |  |
| Colorectum | FAP |  |
| ∗Top 15 enriched GO BP terms are showed in the bar plot of each disease state in each tissue. Each row represents a significant GO biological process which is colored according to the -log10(p.adjust). |
| Page: 1 2 3 4 5 6 7 8 9 |
| GO ID | Tissue | Disease Stage | Description | Gene Ratio | Bg Ratio | pvalue | p.adjust | Count |
| Page: 1 |
| Pathway ID | Tissue | Disease Stage | Description | Gene Ratio | Bg Ratio | pvalue | p.adjust | qvalue | Count |
| Page: 1 |
Top |
Cell-cell communication analysis |
| Identification of potential cell-cell interactions between two cell types and their ligand-receptor pairs for different disease states |
| Ligand | Receptor | LRpair | Pathway | Tissue | Disease Stage |
| Page: 1 |
Top |
Single-cell gene regulatory network inference analysis |
| Find out the significant the regulons (TFs) and the target genes of each regulon across cell types for different disease states |
| TF | Cell Type | Tissue | Disease Stage | Target Gene | RSS | Regulon Activity |
| ∗The dot plots of a searched regulon are shown for all cell subpopulations in each disease state of each tissue based on the regulon specific score inferred using pySCENIC and by calculating the average expression. |
| Page: 1 |
Top |
Somatic mutation of malignant transformation related genes |
| Annotation of somatic variants for genes involved in malignant transformation |
| Hugo Symbol | Variant Class | Variant Classification | dbSNP RS | HGVSc | HGVSp | HGVSp Short | SWISSPROT | BIOTYPE | SIFT | PolyPhen | Tumor Sample Barcode | Tissue | Histology | Sex | Age | Stage | Therapy Types | Drugs | Outcome |
| C20orf96 | SNV | Missense_Mutation | novel | c.234N>C | p.Lys78Asn | p.K78N | Q9NUD7 | protein_coding | deleterious(0.01) | possibly_damaging(0.447) | TCGA-3C-AALI-01 | Breast | breast invasive carcinoma | Female | <65 | I/II | Unspecific | Poly E | Complete Response |
| C20orf96 | SNV | Missense_Mutation | c.1021N>T | p.Arg341Trp | p.R341W | Q9NUD7 | protein_coding | deleterious(0) | probably_damaging(0.997) | TCGA-AN-A046-01 | Breast | breast invasive carcinoma | Female | >=65 | I/II | Unknown | Unknown | SD | |
| C20orf96 | insertion | Frame_Shift_Ins | novel | c.829_830insTGACCCATTTACAACCATCACCAAACATCACCTATTCAGCCATTAAC | p.Thr277MetfsTer36 | p.T277Mfs*36 | Q9NUD7 | protein_coding | TCGA-A2-A0D1-01 | Breast | breast invasive carcinoma | Female | >=65 | I/II | Chemotherapy | taxotere | SD | ||
| C20orf96 | insertion | Nonsense_Mutation | novel | c.73_74insCCCAGTGAGGAAAAGGGAATAAATC | p.Tyr25SerfsTer3 | p.Y25Sfs*3 | Q9NUD7 | protein_coding | TCGA-A2-A0EO-01 | Breast | breast invasive carcinoma | Female | <65 | I/II | Hormone Therapy | tamoxiphen | SD | ||
| C20orf96 | insertion | In_Frame_Ins | novel | c.71_72insCCTGCTGGACACTGCCAACAC | p.Asp24_Tyr25insLeuLeuAspThrAlaAsnThr | p.D24_Y25insLLDTANT | Q9NUD7 | protein_coding | TCGA-A2-A0EO-01 | Breast | breast invasive carcinoma | Female | <65 | I/II | Hormone Therapy | tamoxiphen | SD | ||
| C20orf96 | SNV | Missense_Mutation | novel | c.321N>A | p.Ser107Arg | p.S107R | Q9NUD7 | protein_coding | deleterious(0.01) | benign(0.031) | TCGA-DS-A1OB-01 | Cervix | cervical & endocervical cancer | Female | <65 | I/II | Chemotherapy | carboplatin | PD |
| C20orf96 | SNV | Missense_Mutation | c.792N>T | p.Lys264Asn | p.K264N | Q9NUD7 | protein_coding | tolerated(0.34) | benign(0.012) | TCGA-FU-A3HZ-01 | Cervix | cervical & endocervical cancer | Female | <65 | I/II | Chemotherapy | cisplatin | CR | |
| C20orf96 | SNV | Missense_Mutation | novel | c.148N>A | p.His50Asn | p.H50N | Q9NUD7 | protein_coding | tolerated(0.43) | benign(0) | TCGA-VS-A9V1-01 | Cervix | cervical & endocervical cancer | Female | <65 | I/II | Chemotherapy | cisplatin | PD |
| C20orf96 | insertion | Frame_Shift_Ins | novel | c.319_320insCGGAGGGAGGGAGG | p.Ser107ThrfsTer28 | p.S107Tfs*28 | Q9NUD7 | protein_coding | TCGA-DS-A1OB-01 | Cervix | cervical & endocervical cancer | Female | <65 | I/II | Chemotherapy | carboplatin | PD | ||
| C20orf96 | SNV | Missense_Mutation | novel | c.10N>A | p.Val4Ile | p.V4I | Q9NUD7 | protein_coding | tolerated(0.29) | benign(0.014) | TCGA-CM-6162-01 | Colorectum | colon adenocarcinoma | Female | <65 | III/IV | Chemotherapy | oxaliplatin | SD |
| Page: 1 2 3 4 5 |
Top |
Related drugs of malignant transformation related genes |
| Identification of chemicals and drugs interact with genes involved in malignant transfromation |
| (DGIdb 4.0) |
| Entrez ID | Symbol | Category | Interaction Types | Drug Claim Name | Drug Name | PMIDs |
| Page: 1 |

Copyright 2023-Present -The University of Texas Health Science Center at Houston |