
|
|||||
|
 | |
| |
| |
| |
| |
| |
|
Gene: C20orf194 |
Gene summary for C20ORF194 |
| Gene information | Species | Human | Gene symbol | C20orf194 | Gene ID | 25943 |
| Gene name | dynein axonemal assembly factor 9 | |
| Gene Alias | C20orf194 | |
| Cytomap | 20p13 | |
| Gene Type | protein-coding | GO ID | GO:0008150 | UniProtAcc | Q0IIP3 |
Top |
Malignant transformation analysis |
| Identification of the aberrant gene expression in precancerous and cancerous lesions by comparing the gene expression of stem-like cells in diseased tissues with normal stem cells |
| Entrez ID | Symbol | Replicates | Species | Organ | Tissue | Adj P-value | Log2FC | Malignancy |
| 25943 | C20orf194 | LZE4T | Human | Esophagus | ESCC | 1.10e-10 | 4.32e-01 | 0.0811 |
| 25943 | C20orf194 | LZE24T | Human | Esophagus | ESCC | 7.75e-08 | 1.49e-01 | 0.0596 |
| 25943 | C20orf194 | P1T-E | Human | Esophagus | ESCC | 4.65e-04 | 2.63e-01 | 0.0875 |
| 25943 | C20orf194 | P2T-E | Human | Esophagus | ESCC | 2.25e-14 | 1.33e-01 | 0.1177 |
| 25943 | C20orf194 | P4T-E | Human | Esophagus | ESCC | 7.90e-07 | 1.79e-01 | 0.1323 |
| 25943 | C20orf194 | P5T-E | Human | Esophagus | ESCC | 4.34e-06 | 8.66e-02 | 0.1327 |
| 25943 | C20orf194 | P8T-E | Human | Esophagus | ESCC | 4.15e-14 | 1.46e-01 | 0.0889 |
| 25943 | C20orf194 | P9T-E | Human | Esophagus | ESCC | 1.66e-08 | 2.58e-01 | 0.1131 |
| 25943 | C20orf194 | P10T-E | Human | Esophagus | ESCC | 9.75e-33 | 6.74e-01 | 0.116 |
| 25943 | C20orf194 | P11T-E | Human | Esophagus | ESCC | 1.78e-10 | 5.00e-01 | 0.1426 |
| 25943 | C20orf194 | P12T-E | Human | Esophagus | ESCC | 1.58e-23 | 5.90e-01 | 0.1122 |
| 25943 | C20orf194 | P15T-E | Human | Esophagus | ESCC | 3.39e-11 | 3.01e-01 | 0.1149 |
| 25943 | C20orf194 | P16T-E | Human | Esophagus | ESCC | 3.28e-13 | 2.96e-01 | 0.1153 |
| 25943 | C20orf194 | P17T-E | Human | Esophagus | ESCC | 1.51e-03 | 2.04e-01 | 0.1278 |
| 25943 | C20orf194 | P20T-E | Human | Esophagus | ESCC | 5.38e-11 | 1.94e-01 | 0.1124 |
| 25943 | C20orf194 | P21T-E | Human | Esophagus | ESCC | 3.46e-15 | 3.23e-01 | 0.1617 |
| 25943 | C20orf194 | P22T-E | Human | Esophagus | ESCC | 6.04e-11 | 1.36e-01 | 0.1236 |
| 25943 | C20orf194 | P23T-E | Human | Esophagus | ESCC | 1.76e-05 | 1.57e-01 | 0.108 |
| 25943 | C20orf194 | P24T-E | Human | Esophagus | ESCC | 1.79e-07 | 8.29e-02 | 0.1287 |
| 25943 | C20orf194 | P26T-E | Human | Esophagus | ESCC | 9.25e-48 | 1.25e+00 | 0.1276 |
| Page: 1 2 3 4 |
| Tissue | Expression Dynamics | Abbreviation |
| Esophagus | 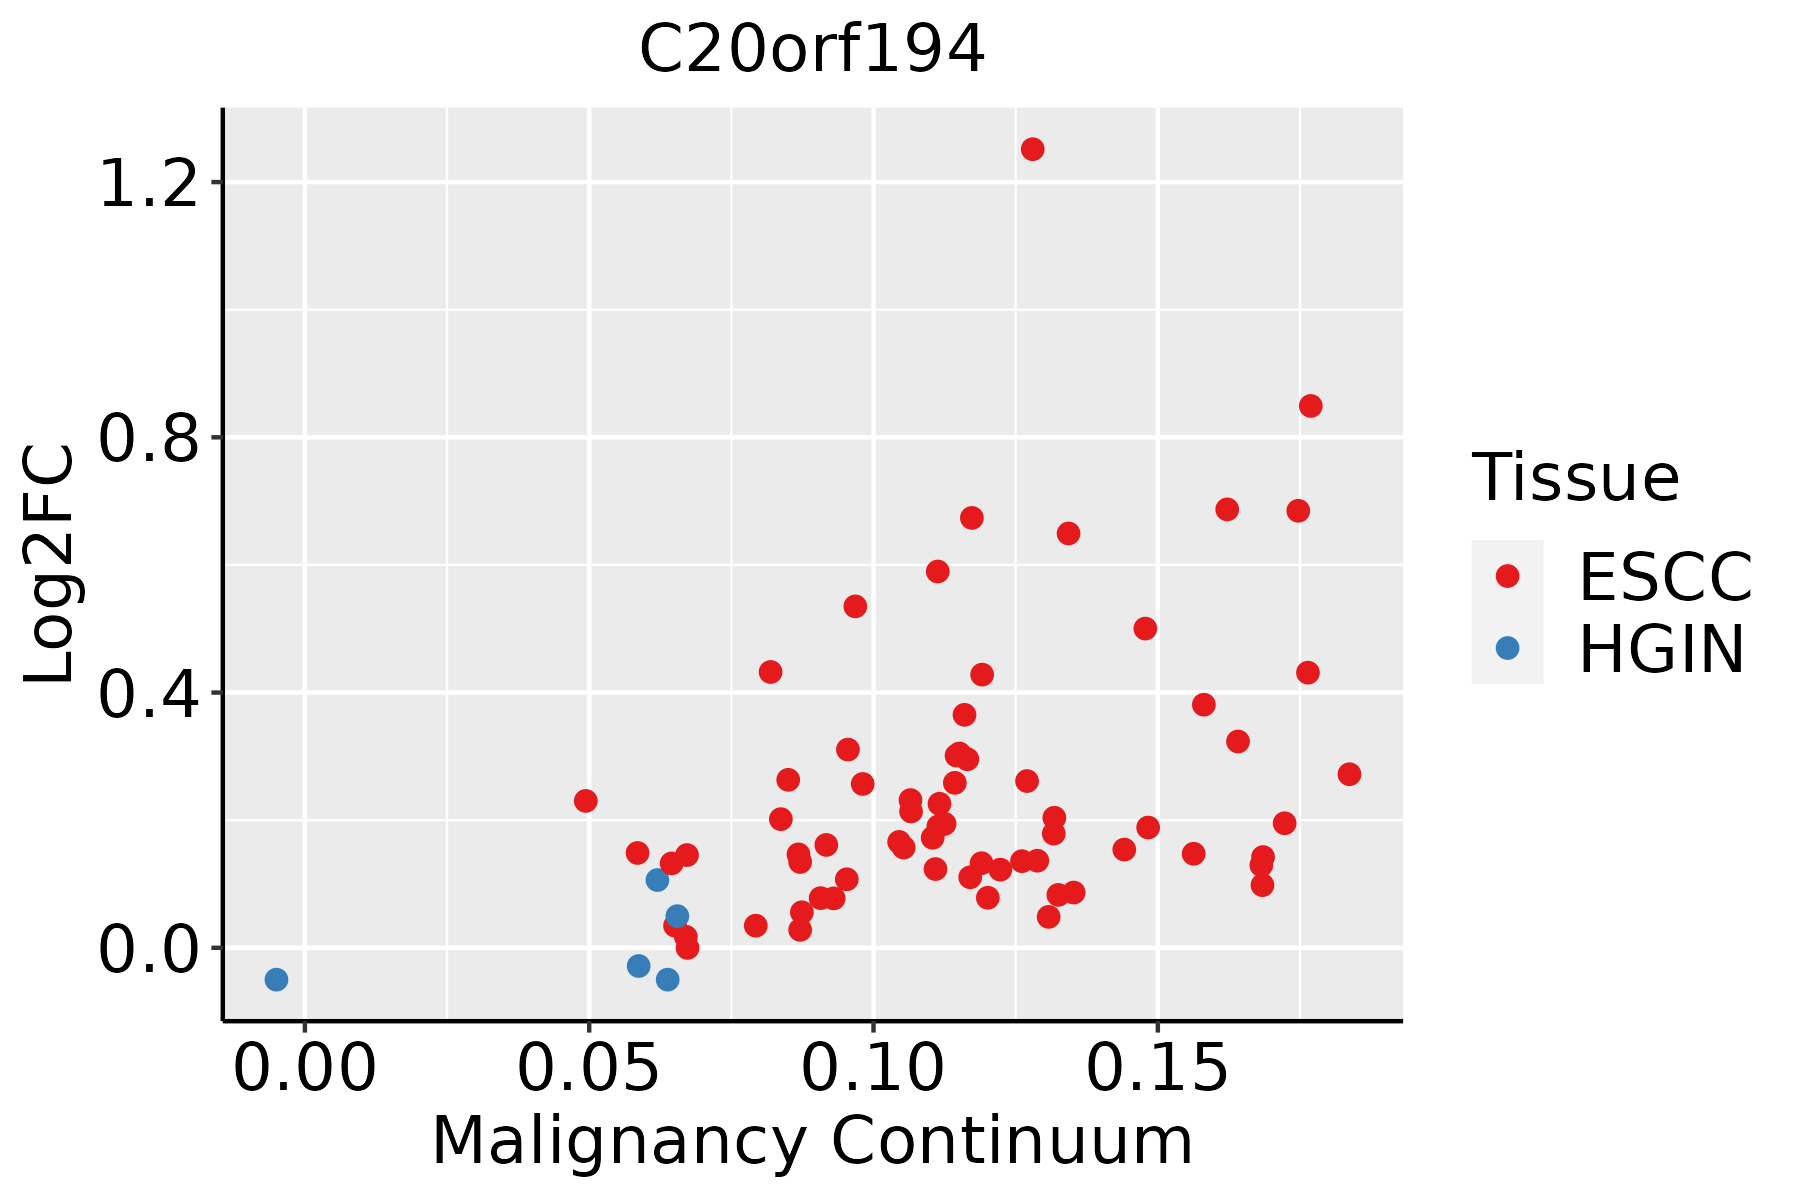 | ESCC: Esophageal squamous cell carcinoma |
| HGIN: High-grade intraepithelial neoplasias | ||
| LGIN: Low-grade intraepithelial neoplasias | ||
| Lung | 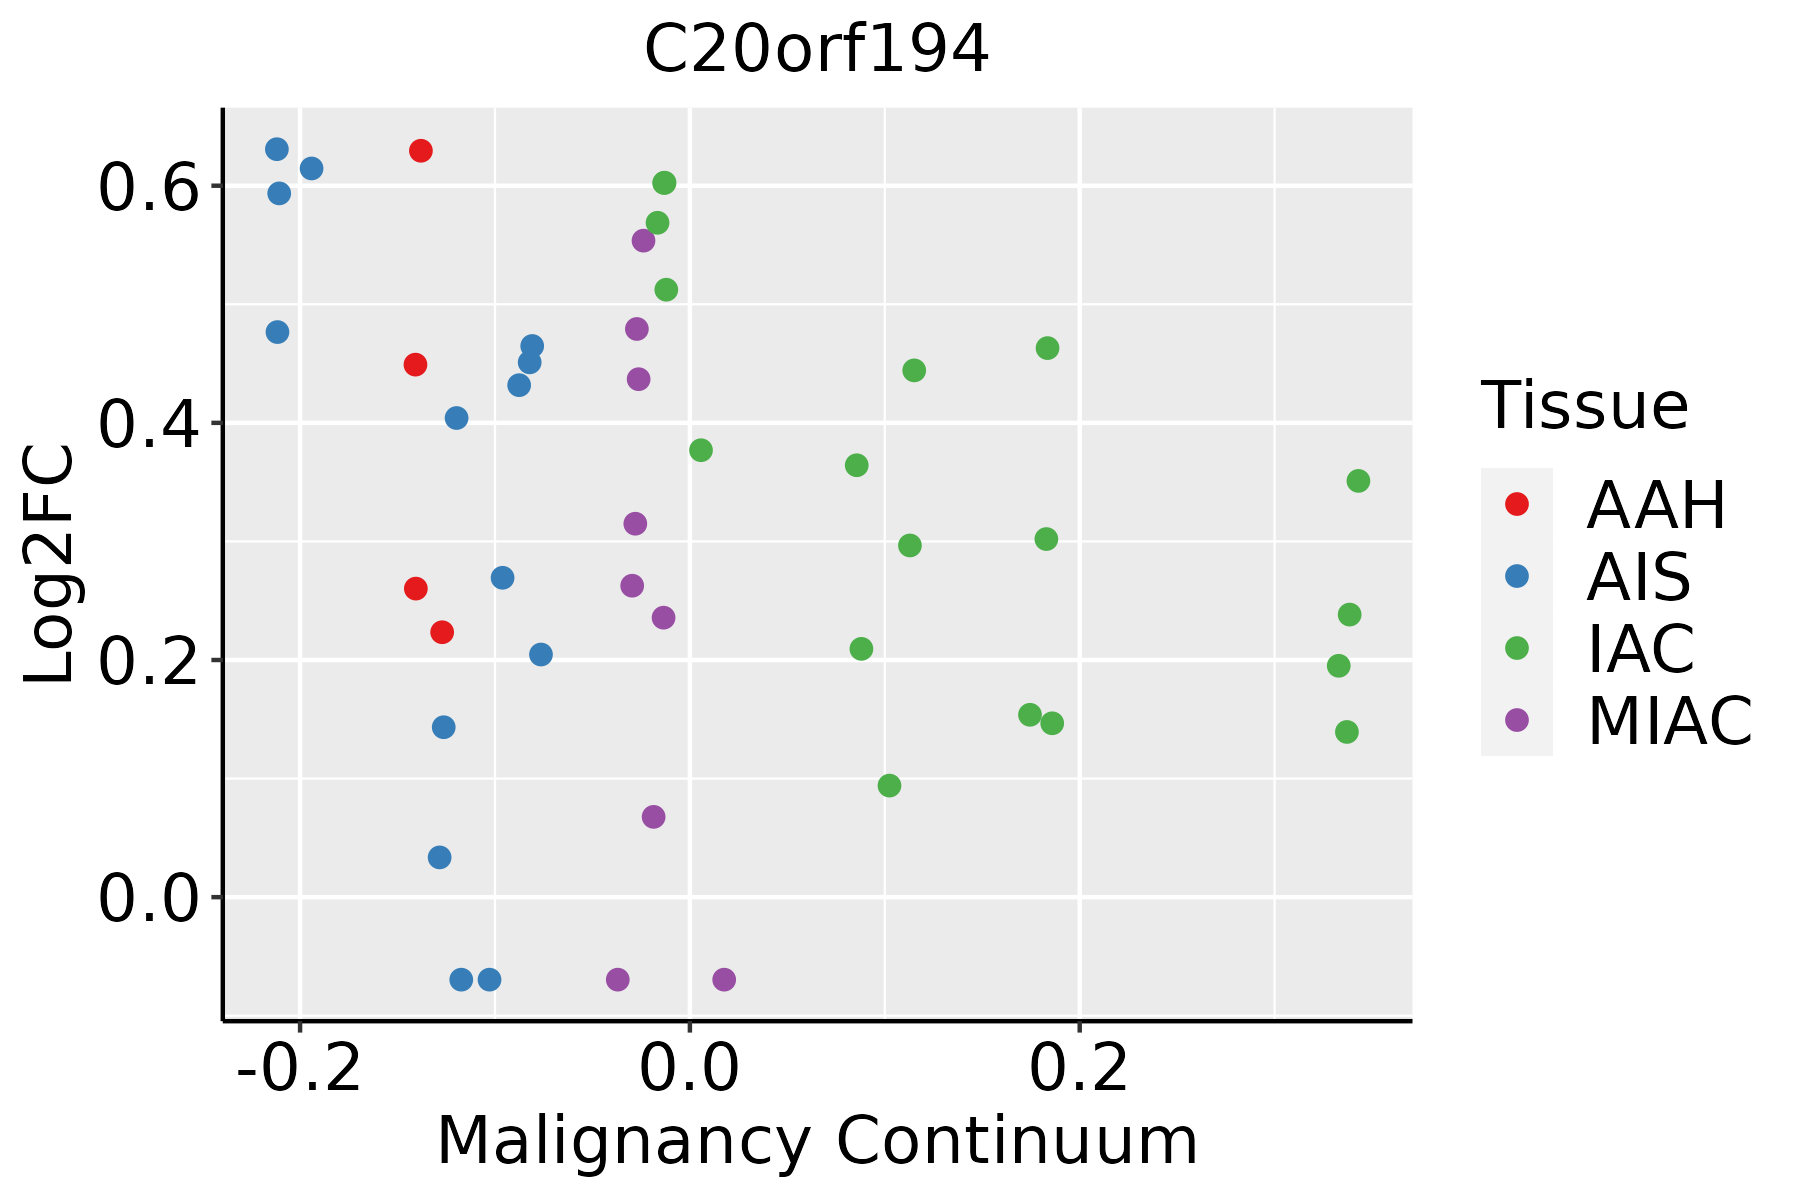 | AAH: Atypical adenomatous hyperplasia |
| AIS: Adenocarcinoma in situ | ||
| IAC: Invasive lung adenocarcinoma | ||
| MIA: Minimally invasive adenocarcinoma | ||
| Prostate | 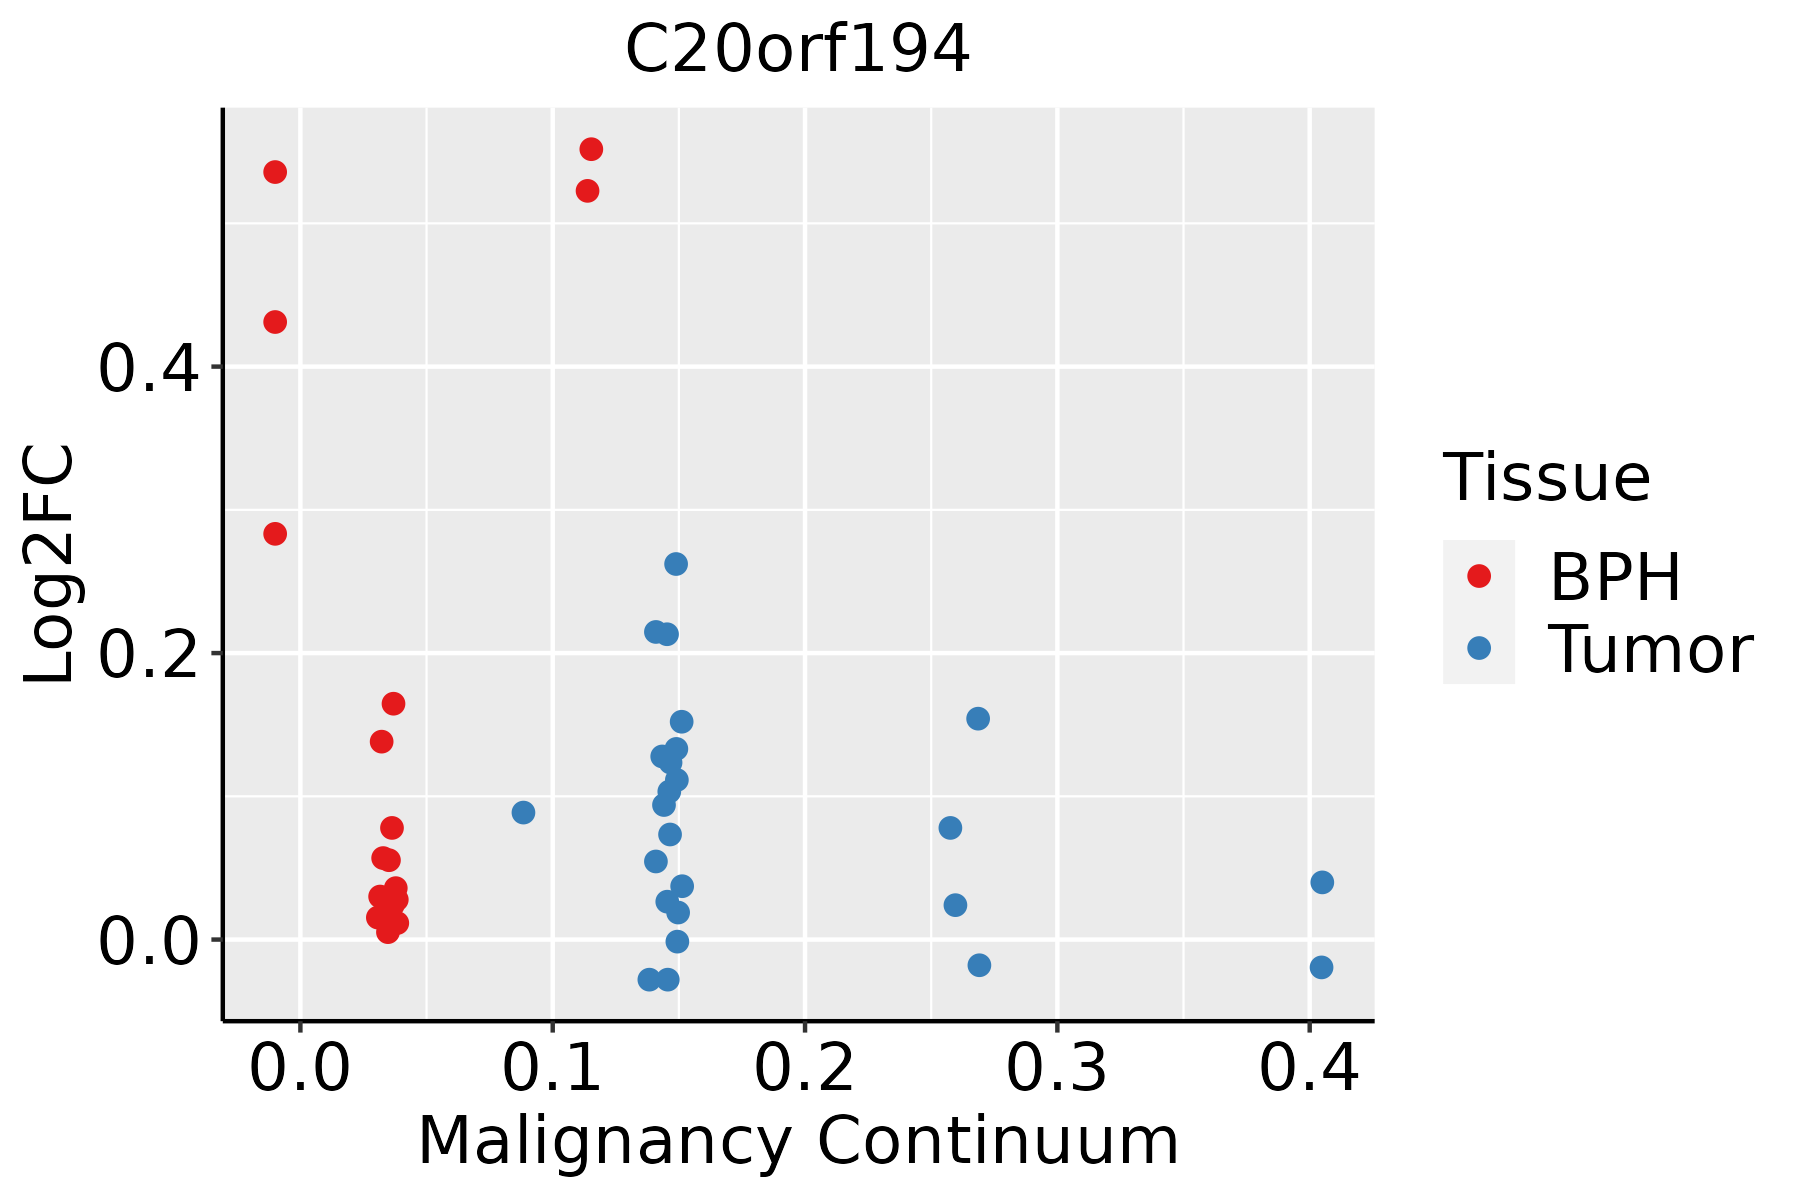 | BPH: Benign Prostatic Hyperplasia |
| ∗log2FC in expression of this searched gene in stem-like cells from each diseased tissue sample relative to stem-like cells in normal samples in each tissue plotted against the malignancy continuum. Samples are colored based on if they are from different disease stage. |
Top |
Malignant transformation related pathway analysis |
| Find out the enriched GO biological processes and KEGG pathways involved in transition from healthy to precancer to cancer |
| Tissue | Disease Stage | Enriched GO biological Processes |
| Colorectum | AD |  |
| Colorectum | SER |  |
| Colorectum | MSS |  |
| Colorectum | MSI-H |  |
| Colorectum | FAP |  |
| ∗Top 15 enriched GO BP terms are showed in the bar plot of each disease state in each tissue. Each row represents a significant GO biological process which is colored according to the -log10(p.adjust). |
| Page: 1 2 3 4 5 6 7 8 9 |
| GO ID | Tissue | Disease Stage | Description | Gene Ratio | Bg Ratio | pvalue | p.adjust | Count |
| Page: 1 |
| Pathway ID | Tissue | Disease Stage | Description | Gene Ratio | Bg Ratio | pvalue | p.adjust | qvalue | Count |
| Page: 1 |
Top |
Cell-cell communication analysis |
| Identification of potential cell-cell interactions between two cell types and their ligand-receptor pairs for different disease states |
| Ligand | Receptor | LRpair | Pathway | Tissue | Disease Stage |
| Page: 1 |
Top |
Single-cell gene regulatory network inference analysis |
| Find out the significant the regulons (TFs) and the target genes of each regulon across cell types for different disease states |
| TF | Cell Type | Tissue | Disease Stage | Target Gene | RSS | Regulon Activity |
| ∗The dot plots of a searched regulon are shown for all cell subpopulations in each disease state of each tissue based on the regulon specific score inferred using pySCENIC and by calculating the average expression. |
| Page: 1 |
Top |
Somatic mutation of malignant transformation related genes |
| Annotation of somatic variants for genes involved in malignant transformation |
| Hugo Symbol | Variant Class | Variant Classification | dbSNP RS | HGVSc | HGVSp | HGVSp Short | SWISSPROT | BIOTYPE | SIFT | PolyPhen | Tumor Sample Barcode | Tissue | Histology | Sex | Age | Stage | Therapy Types | Drugs | Outcome |
| C20orf194 | SNV | Missense_Mutation | rs774447561 | c.787N>A | p.Glu263Lys | p.E263K | Q5TEA3 | protein_coding | deleterious(0.01) | probably_damaging(0.991) | TCGA-A1-A0SI-01 | Breast | breast invasive carcinoma | Female | <65 | I/II | Unknown | Unknown | SD |
| C20orf194 | SNV | Missense_Mutation | rs201878603 | c.206N>C | p.Asn69Thr | p.N69T | Q5TEA3 | protein_coding | deleterious(0.01) | possibly_damaging(0.895) | TCGA-A2-A0CQ-01 | Breast | breast invasive carcinoma | Female | <65 | I/II | Chemotherapy | adriamycin | SD |
| C20orf194 | SNV | Missense_Mutation | novel | c.2414N>A | p.Ala805Asp | p.A805D | Q5TEA3 | protein_coding | deleterious(0) | benign(0.299) | TCGA-A2-A25A-01 | Breast | breast invasive carcinoma | Female | <65 | I/II | Unspecific | Cytoxan | SD |
| C20orf194 | SNV | Missense_Mutation | rs201878603 | c.206N>C | p.Asn69Thr | p.N69T | Q5TEA3 | protein_coding | deleterious(0.01) | possibly_damaging(0.895) | TCGA-A8-A09A-01 | Breast | breast invasive carcinoma | Female | <65 | I/II | Hormone Therapy | tamoxiphen | SD |
| C20orf194 | SNV | Missense_Mutation | rs201878603 | c.206A>C | p.Asn69Thr | p.N69T | Q5TEA3 | protein_coding | deleterious(0.01) | possibly_damaging(0.895) | TCGA-AR-A0TZ-01 | Breast | breast invasive carcinoma | Female | <65 | III/IV | Unspecific | Doxorubicin | PD |
| C20orf194 | SNV | Missense_Mutation | c.359A>G | p.Tyr120Cys | p.Y120C | Q5TEA3 | protein_coding | deleterious(0.01) | benign(0.003) | TCGA-BH-A0HA-01 | Breast | breast invasive carcinoma | Female | <65 | I/II | Unknown | Unknown | SD | |
| C20orf194 | SNV | Missense_Mutation | novel | c.2362G>A | p.Glu788Lys | p.E788K | Q5TEA3 | protein_coding | tolerated(0.19) | probably_damaging(0.987) | TCGA-BH-A2L8-01 | Breast | breast invasive carcinoma | Female | <65 | I/II | Chemotherapy | cytoxan | CR |
| C20orf194 | SNV | Missense_Mutation | rs781043941 | c.2129A>G | p.Gln710Arg | p.Q710R | Q5TEA3 | protein_coding | tolerated(0.11) | probably_damaging(0.979) | TCGA-D8-A1J8-01 | Breast | breast invasive carcinoma | Female | >=65 | I/II | Hormone Therapy | nolvadex | SD |
| C20orf194 | SNV | Missense_Mutation | novel | c.2404N>T | p.Ala802Ser | p.A802S | Q5TEA3 | protein_coding | deleterious(0.02) | benign(0.069) | TCGA-OL-A66I-01 | Breast | breast invasive carcinoma | Female | <65 | I/II | Chemotherapy | adriamycin | CR |
| C20orf194 | insertion | Nonsense_Mutation | novel | c.2425_2426insTAAGTCTTCATTCATCATCTAAATAAGGGAGCTTCATCT | p.Arg809delinsLeuSerLeuHisSerSerSerLysTerGlySerPheIleCys | p.R809delinsLSLHSSSK*GSFIC | Q5TEA3 | protein_coding | TCGA-A8-A08H-01 | Breast | breast invasive carcinoma | Female | >=65 | I/II | Unknown | Unknown | SD |
| Page: 1 2 3 4 5 6 7 8 9 10 11 12 13 |
Top |
Related drugs of malignant transformation related genes |
| Identification of chemicals and drugs interact with genes involved in malignant transfromation |
| (DGIdb 4.0) |
| Entrez ID | Symbol | Category | Interaction Types | Drug Claim Name | Drug Name | PMIDs |
| Page: 1 |

Copyright 2023-Present -The University of Texas Health Science Center at Houston |