
|
|||||
|
 | |
| |
| |
| |
| |
| |
|
Gene: C1orf56 |
Gene summary for C1ORF56 |
| Gene information | Species | Human | Gene symbol | C1orf56 | Gene ID | 54964 |
| Gene name | chromosome 1 open reading frame 56 | |
| Gene Alias | MENT | |
| Cytomap | 1q21.3 | |
| Gene Type | protein-coding | GO ID | GO:0008150 | UniProtAcc | Q9BUN1 |
Top |
Malignant transformation analysis |
| Identification of the aberrant gene expression in precancerous and cancerous lesions by comparing the gene expression of stem-like cells in diseased tissues with normal stem cells |
| Entrez ID | Symbol | Replicates | Species | Organ | Tissue | Adj P-value | Log2FC | Malignancy |
| 54964 | C1orf56 | GSM4909287 | Human | Breast | IDC | 2.10e-03 | 4.15e-01 | 0.2057 |
| 54964 | C1orf56 | GSM4909290 | Human | Breast | IDC | 6.75e-04 | 5.16e-01 | 0.2096 |
| 54964 | C1orf56 | GSM4909293 | Human | Breast | IDC | 2.25e-12 | 3.57e-01 | 0.1581 |
| 54964 | C1orf56 | GSM4909296 | Human | Breast | IDC | 1.11e-04 | -1.85e-01 | 0.1524 |
| 54964 | C1orf56 | GSM4909297 | Human | Breast | IDC | 2.72e-15 | 6.12e-01 | 0.1517 |
| 54964 | C1orf56 | GSM4909304 | Human | Breast | IDC | 4.04e-03 | 1.79e-01 | 0.1636 |
| 54964 | C1orf56 | GSM4909311 | Human | Breast | IDC | 1.21e-07 | -2.17e-01 | 0.1534 |
| 54964 | C1orf56 | GSM4909319 | Human | Breast | IDC | 1.86e-07 | -2.74e-01 | 0.1563 |
| 54964 | C1orf56 | brca1 | Human | Breast | Precancer | 6.76e-04 | -2.72e-01 | -0.0338 |
| 54964 | C1orf56 | P1 | Human | Breast | IDC | 1.61e-05 | -2.11e-01 | 0.1527 |
| 54964 | C1orf56 | DCIS2 | Human | Breast | DCIS | 2.63e-37 | 4.39e-02 | 0.0085 |
| 54964 | C1orf56 | C21 | Human | Oral cavity | OSCC | 6.59e-04 | 5.37e-01 | 0.2678 |
| 54964 | C1orf56 | C30 | Human | Oral cavity | OSCC | 2.51e-09 | 1.23e+00 | 0.3055 |
| 54964 | C1orf56 | C43 | Human | Oral cavity | OSCC | 1.93e-04 | 2.80e-01 | 0.1704 |
| 54964 | C1orf56 | C51 | Human | Oral cavity | OSCC | 1.47e-02 | 9.06e-01 | 0.2674 |
| 54964 | C1orf56 | C08 | Human | Oral cavity | OSCC | 3.46e-04 | 2.81e-01 | 0.1919 |
| 54964 | C1orf56 | EOLP-1 | Human | Oral cavity | EOLP | 3.53e-03 | -2.54e-01 | -0.0202 |
| 54964 | C1orf56 | NEOLP-1 | Human | Oral cavity | NEOLP | 2.99e-03 | -2.84e-01 | -0.0194 |
| 54964 | C1orf56 | SYSMH1 | Human | Oral cavity | OSCC | 2.36e-04 | -2.20e-01 | 0.1127 |
| 54964 | C1orf56 | SYSMH4 | Human | Oral cavity | OSCC | 2.99e-05 | -2.94e-01 | 0.1226 |
| Page: 1 2 |
| Tissue | Expression Dynamics | Abbreviation |
| Breast | 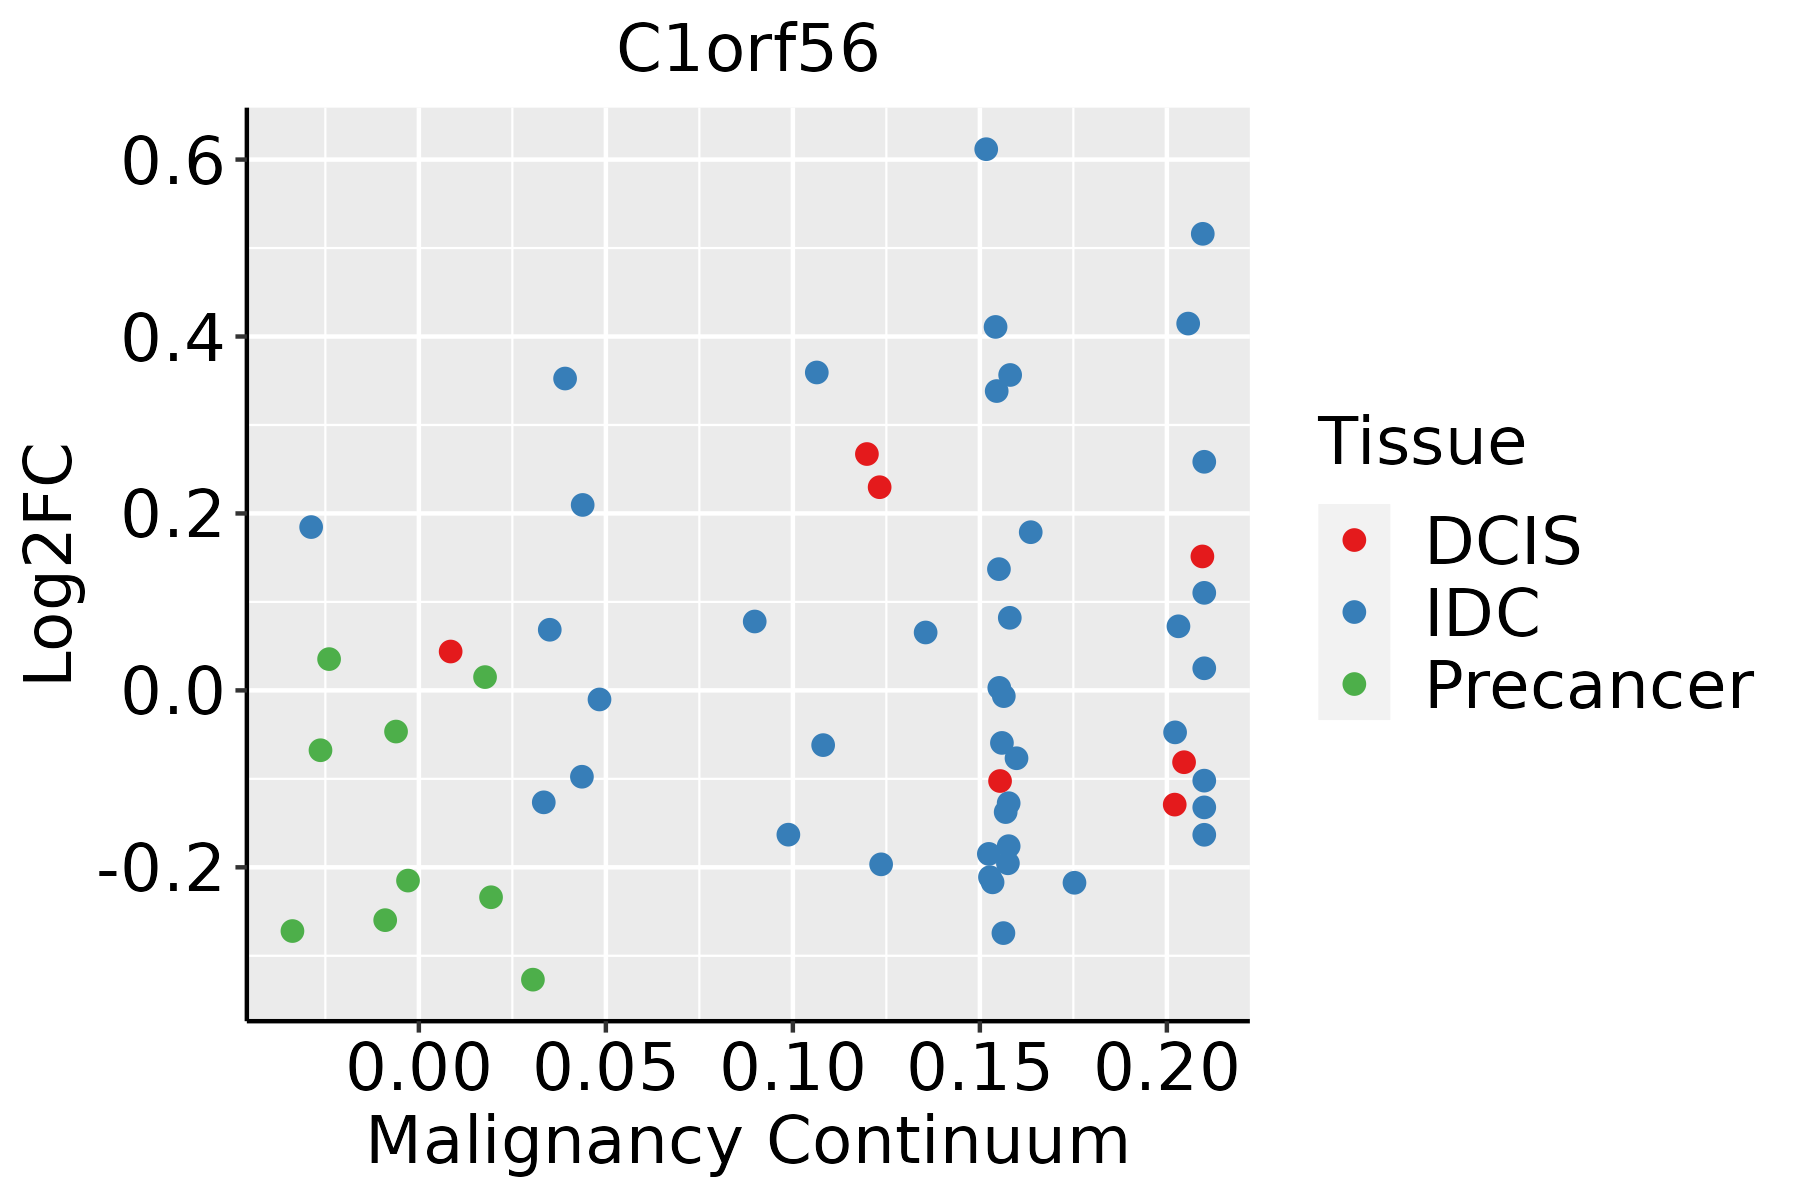 | IDC: Invasive ductal carcinoma |
| DCIS: Ductal carcinoma in situ | ||
| Precancer(BRCA1-mut): Precancerous lesion from BRCA1 mutation carriers | ||
| Oral Cavity | 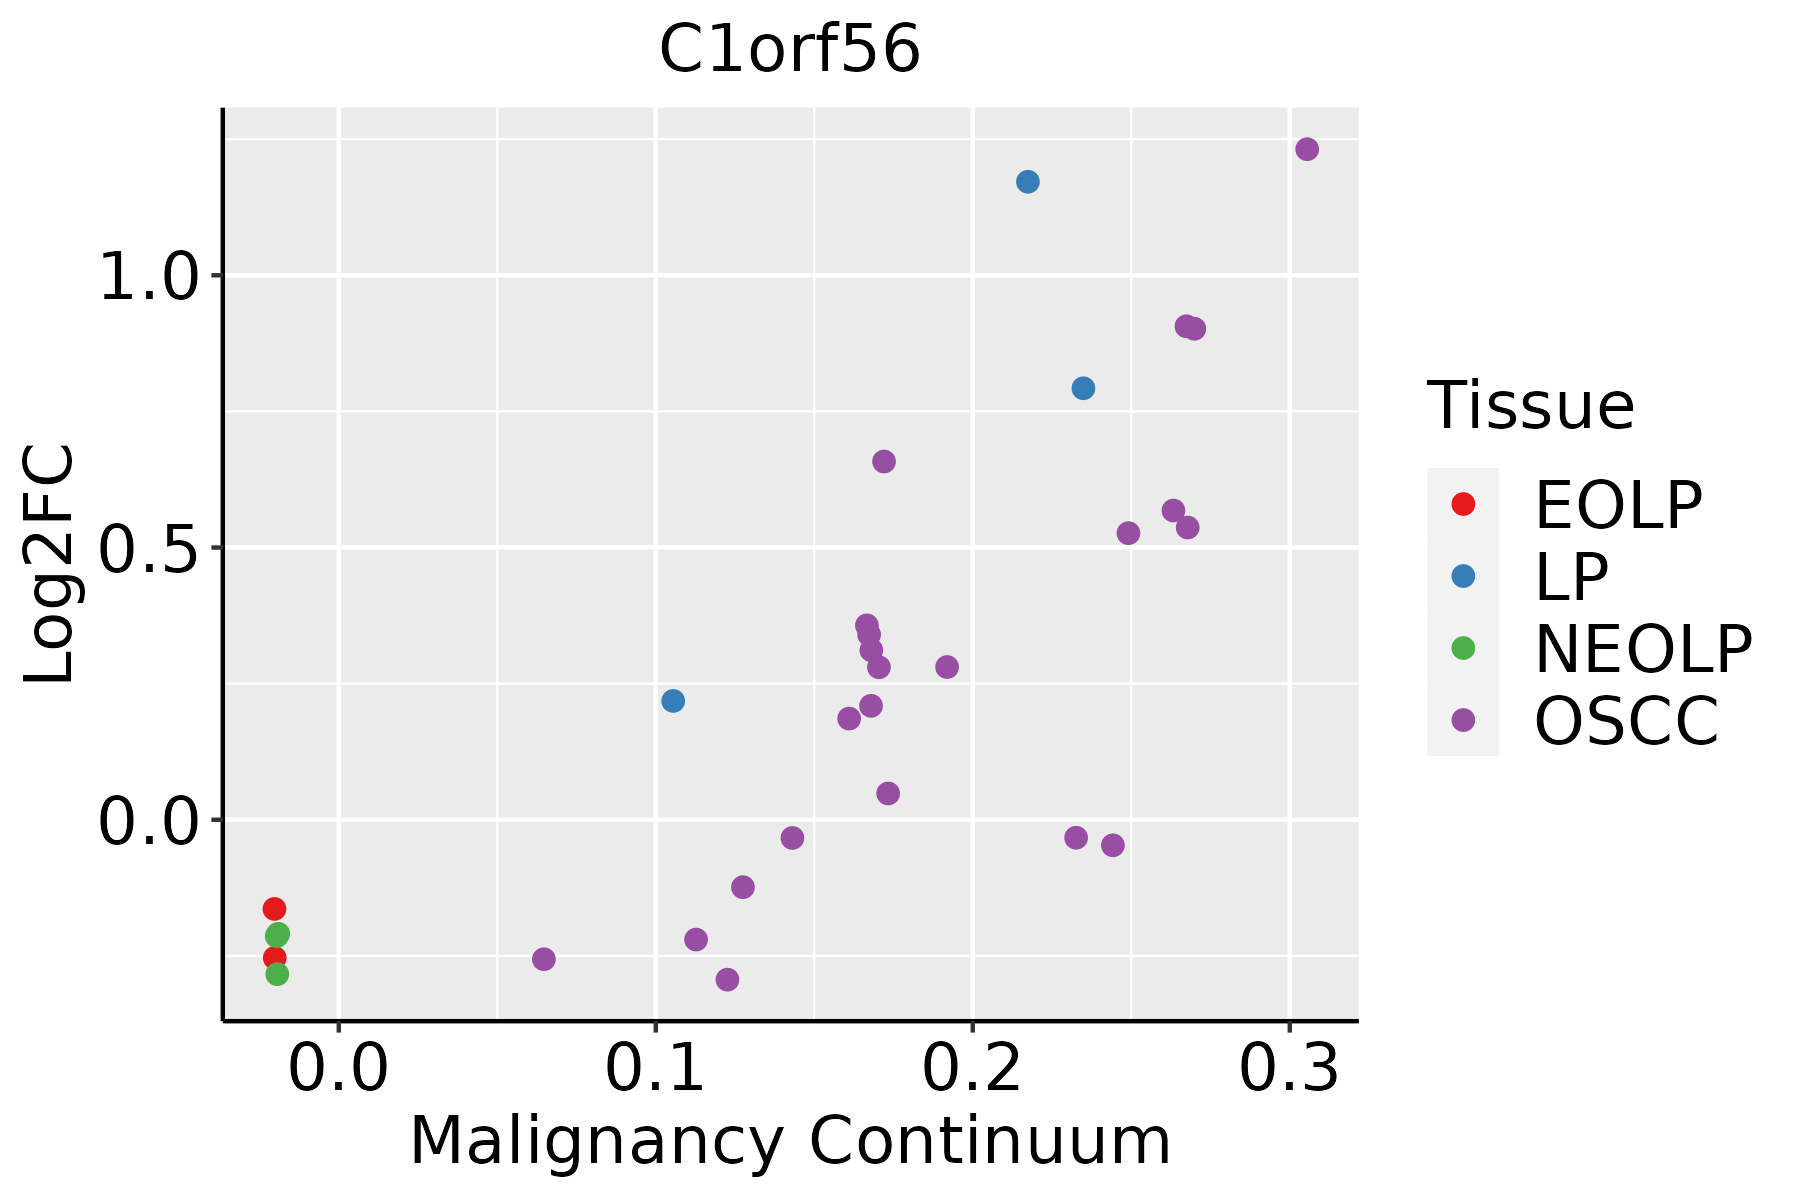 | EOLP: Erosive Oral lichen planus |
| LP: leukoplakia | ||
| NEOLP: Non-erosive oral lichen planus | ||
| OSCC: Oral squamous cell carcinoma | ||
| Skin | 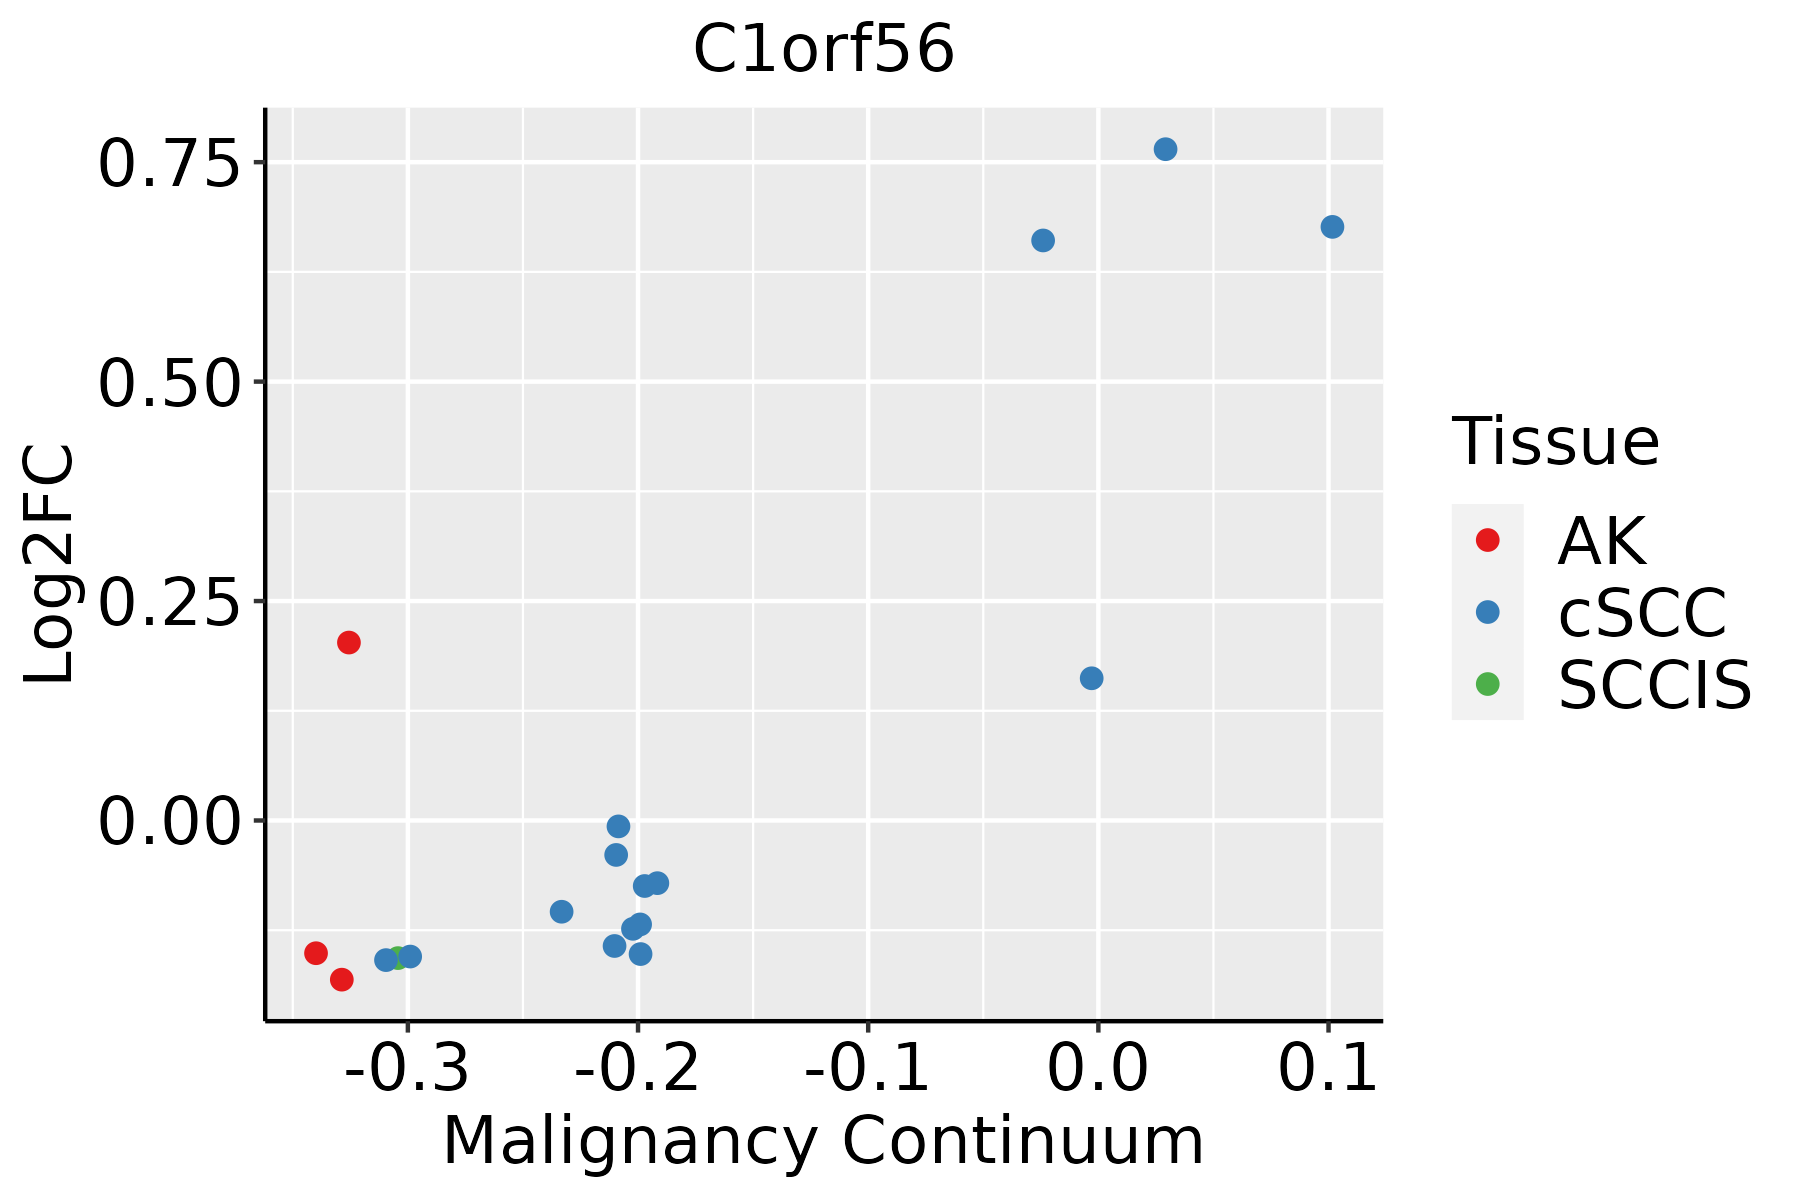 | AK: Actinic keratosis |
| cSCC: Cutaneous squamous cell carcinoma | ||
| SCCIS:squamous cell carcinoma in situ | ||
| Thyroid | 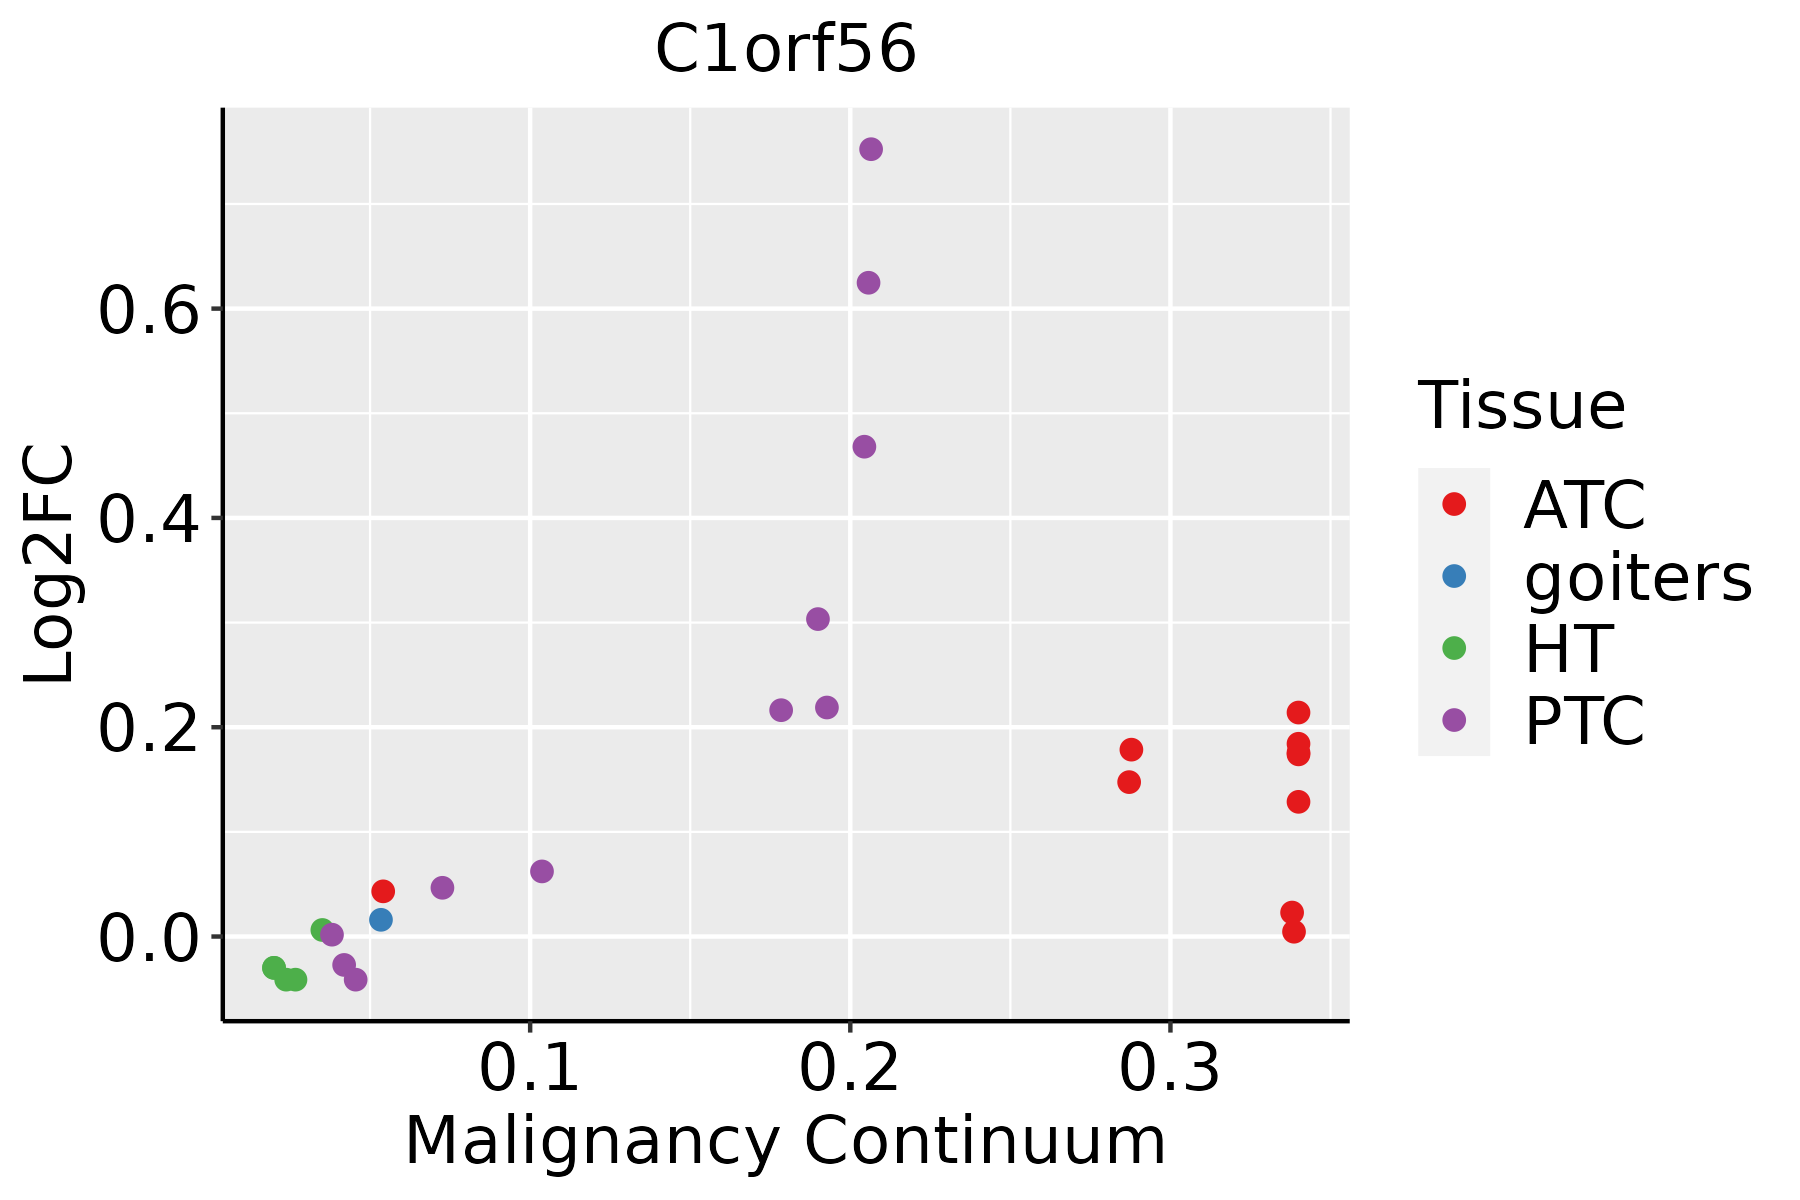 | ATC: Anaplastic thyroid cancer |
| HT: Hashimoto's thyroiditis | ||
| PTC: Papillary thyroid cancer |
| ∗log2FC in expression of this searched gene in stem-like cells from each diseased tissue sample relative to stem-like cells in normal samples in each tissue plotted against the malignancy continuum. Samples are colored based on if they are from different disease stage. |
Top |
Malignant transformation related pathway analysis |
| Find out the enriched GO biological processes and KEGG pathways involved in transition from healthy to precancer to cancer |
| Tissue | Disease Stage | Enriched GO biological Processes |
| Colorectum | AD |  |
| Colorectum | SER |  |
| Colorectum | MSS |  |
| Colorectum | MSI-H |  |
| Colorectum | FAP |  |
| ∗Top 15 enriched GO BP terms are showed in the bar plot of each disease state in each tissue. Each row represents a significant GO biological process which is colored according to the -log10(p.adjust). |
| Page: 1 2 3 4 5 6 7 8 9 |
| GO ID | Tissue | Disease Stage | Description | Gene Ratio | Bg Ratio | pvalue | p.adjust | Count |
| Page: 1 |
| Pathway ID | Tissue | Disease Stage | Description | Gene Ratio | Bg Ratio | pvalue | p.adjust | qvalue | Count |
| Page: 1 |
Top |
Cell-cell communication analysis |
| Identification of potential cell-cell interactions between two cell types and their ligand-receptor pairs for different disease states |
| Ligand | Receptor | LRpair | Pathway | Tissue | Disease Stage |
| Page: 1 |
Top |
Single-cell gene regulatory network inference analysis |
| Find out the significant the regulons (TFs) and the target genes of each regulon across cell types for different disease states |
| TF | Cell Type | Tissue | Disease Stage | Target Gene | RSS | Regulon Activity |
| ∗The dot plots of a searched regulon are shown for all cell subpopulations in each disease state of each tissue based on the regulon specific score inferred using pySCENIC and by calculating the average expression. |
| Page: 1 |
Top |
Somatic mutation of malignant transformation related genes |
| Annotation of somatic variants for genes involved in malignant transformation |
| Hugo Symbol | Variant Class | Variant Classification | dbSNP RS | HGVSc | HGVSp | HGVSp Short | SWISSPROT | BIOTYPE | SIFT | PolyPhen | Tumor Sample Barcode | Tissue | Histology | Sex | Age | Stage | Therapy Types | Drugs | Outcome |
| C1orf56 | insertion | Nonsense_Mutation | novel | c.979_980insGACAGATTAGAGTAACAAACTAGGAATCTGAGGAAGTTACAAAAAA | p.Ser327Ter | p.S327* | Q9BUN1 | protein_coding | TCGA-BH-A0B1-01 | Breast | breast invasive carcinoma | Female | >=65 | I/II | Chemotherapy | adriamycin | SD | ||
| C1orf56 | insertion | Frame_Shift_Ins | novel | c.670_671insAAGACAA | p.Gly224GlufsTer50 | p.G224Efs*50 | Q9BUN1 | protein_coding | TCGA-BH-A0BM-01 | Breast | breast invasive carcinoma | Female | <65 | I/II | Chemotherapy | adriamycin | SD | ||
| C1orf56 | SNV | Missense_Mutation | c.137G>A | p.Arg46His | p.R46H | Q9BUN1 | protein_coding | tolerated(0.06) | benign(0.11) | TCGA-AA-3510-01 | Colorectum | colon adenocarcinoma | Male | >=65 | I/II | Unknown | Unknown | SD | |
| C1orf56 | SNV | Missense_Mutation | c.389N>C | p.Asn130Thr | p.N130T | Q9BUN1 | protein_coding | tolerated(0.67) | benign(0) | TCGA-CA-6718-01 | Colorectum | colon adenocarcinoma | Male | <65 | I/II | Unknown | Unknown | PD | |
| C1orf56 | SNV | Missense_Mutation | c.868C>A | p.Pro290Thr | p.P290T | Q9BUN1 | protein_coding | deleterious(0.04) | benign(0.217) | TCGA-CM-4743-01 | Colorectum | colon adenocarcinoma | Male | >=65 | I/II | Chemotherapy | capecitabine | SD | |
| C1orf56 | SNV | Missense_Mutation | novel | c.887N>T | p.Ser296Ile | p.S296I | Q9BUN1 | protein_coding | tolerated(0.26) | benign(0.037) | TCGA-EI-6917-01 | Colorectum | rectum adenocarcinoma | Male | <65 | III/IV | Chemotherapy | 5fluorouracil+oxaciplatina+l-folinian | SD |
| C1orf56 | SNV | Missense_Mutation | novel | c.84N>T | p.Gln28His | p.Q28H | Q9BUN1 | protein_coding | deleterious(0.02) | possibly_damaging(0.563) | TCGA-A5-A2K5-01 | Endometrium | uterine corpus endometrioid carcinoma | Female | >=65 | I/II | Unknown | Unknown | SD |
| C1orf56 | SNV | Missense_Mutation | novel | c.329N>T | p.Gly110Val | p.G110V | Q9BUN1 | protein_coding | deleterious(0) | possibly_damaging(0.839) | TCGA-AX-A3G9-01 | Endometrium | uterine corpus endometrioid carcinoma | Female | <65 | III/IV | Chemotherapy | carboplatin | SD |
| C1orf56 | SNV | Missense_Mutation | novel | c.467N>A | p.Arg156His | p.R156H | Q9BUN1 | protein_coding | tolerated(0.17) | benign(0) | TCGA-AX-A3G9-01 | Endometrium | uterine corpus endometrioid carcinoma | Female | <65 | III/IV | Chemotherapy | carboplatin | SD |
| C1orf56 | SNV | Missense_Mutation | c.386C>T | p.Pro129Leu | p.P129L | Q9BUN1 | protein_coding | tolerated_low_confidence(0.71) | benign(0.086) | TCGA-BS-A0UM-01 | Endometrium | uterine corpus endometrioid carcinoma | Female | <65 | I/II | Chemotherapy | adriamycin | SD |
| Page: 1 2 3 |
Top |
Related drugs of malignant transformation related genes |
| Identification of chemicals and drugs interact with genes involved in malignant transfromation |
| (DGIdb 4.0) |
| Entrez ID | Symbol | Category | Interaction Types | Drug Claim Name | Drug Name | PMIDs |
| Page: 1 |

Copyright 2023-Present -The University of Texas Health Science Center at Houston |