
|
|||||
|
 | |
| |
| |
| |
| |
| |
|
Gene: C1orf27 |
Gene summary for C1ORF27 |
| Gene information | Species | Human | Gene symbol | C1orf27 | Gene ID | 54953 |
| Gene name | odr-4 GPCR localization factor homolog | |
| Gene Alias | C1orf27 | |
| Cytomap | 1q31.1 | |
| Gene Type | protein-coding | GO ID | GO:0008104 | UniProtAcc | Q5SWX8 |
Top |
Malignant transformation analysis |
| Identification of the aberrant gene expression in precancerous and cancerous lesions by comparing the gene expression of stem-like cells in diseased tissues with normal stem cells |
| Entrez ID | Symbol | Replicates | Species | Organ | Tissue | Adj P-value | Log2FC | Malignancy |
| 54953 | C1orf27 | P1T-E | Human | Esophagus | ESCC | 1.51e-04 | 3.00e-01 | 0.0875 |
| 54953 | C1orf27 | P2T-E | Human | Esophagus | ESCC | 3.98e-34 | 4.89e-01 | 0.1177 |
| 54953 | C1orf27 | P4T-E | Human | Esophagus | ESCC | 4.51e-17 | 4.76e-01 | 0.1323 |
| 54953 | C1orf27 | P5T-E | Human | Esophagus | ESCC | 1.27e-21 | 4.04e-01 | 0.1327 |
| 54953 | C1orf27 | P8T-E | Human | Esophagus | ESCC | 4.53e-22 | 3.47e-01 | 0.0889 |
| 54953 | C1orf27 | P9T-E | Human | Esophagus | ESCC | 8.62e-19 | 3.96e-01 | 0.1131 |
| 54953 | C1orf27 | P10T-E | Human | Esophagus | ESCC | 1.83e-28 | 4.24e-01 | 0.116 |
| 54953 | C1orf27 | P11T-E | Human | Esophagus | ESCC | 2.82e-09 | 4.51e-01 | 0.1426 |
| 54953 | C1orf27 | P12T-E | Human | Esophagus | ESCC | 1.28e-18 | 2.81e-01 | 0.1122 |
| 54953 | C1orf27 | P15T-E | Human | Esophagus | ESCC | 9.08e-16 | 3.82e-01 | 0.1149 |
| 54953 | C1orf27 | P16T-E | Human | Esophagus | ESCC | 6.35e-28 | 4.78e-01 | 0.1153 |
| 54953 | C1orf27 | P20T-E | Human | Esophagus | ESCC | 8.06e-19 | 4.19e-01 | 0.1124 |
| 54953 | C1orf27 | P21T-E | Human | Esophagus | ESCC | 4.29e-22 | 3.92e-01 | 0.1617 |
| 54953 | C1orf27 | P22T-E | Human | Esophagus | ESCC | 8.18e-23 | 3.18e-01 | 0.1236 |
| 54953 | C1orf27 | P23T-E | Human | Esophagus | ESCC | 2.95e-23 | 5.05e-01 | 0.108 |
| 54953 | C1orf27 | P24T-E | Human | Esophagus | ESCC | 5.00e-21 | 2.99e-01 | 0.1287 |
| 54953 | C1orf27 | P26T-E | Human | Esophagus | ESCC | 6.57e-22 | 4.36e-01 | 0.1276 |
| 54953 | C1orf27 | P27T-E | Human | Esophagus | ESCC | 9.79e-15 | 2.41e-01 | 0.1055 |
| 54953 | C1orf27 | P28T-E | Human | Esophagus | ESCC | 3.86e-17 | 4.06e-01 | 0.1149 |
| 54953 | C1orf27 | P30T-E | Human | Esophagus | ESCC | 5.70e-22 | 7.19e-01 | 0.137 |
| Page: 1 2 3 4 |
| Tissue | Expression Dynamics | Abbreviation |
| Esophagus |  | ESCC: Esophageal squamous cell carcinoma |
| HGIN: High-grade intraepithelial neoplasias | ||
| LGIN: Low-grade intraepithelial neoplasias | ||
| Liver |  | HCC: Hepatocellular carcinoma |
| NAFLD: Non-alcoholic fatty liver disease | ||
| Oral Cavity | 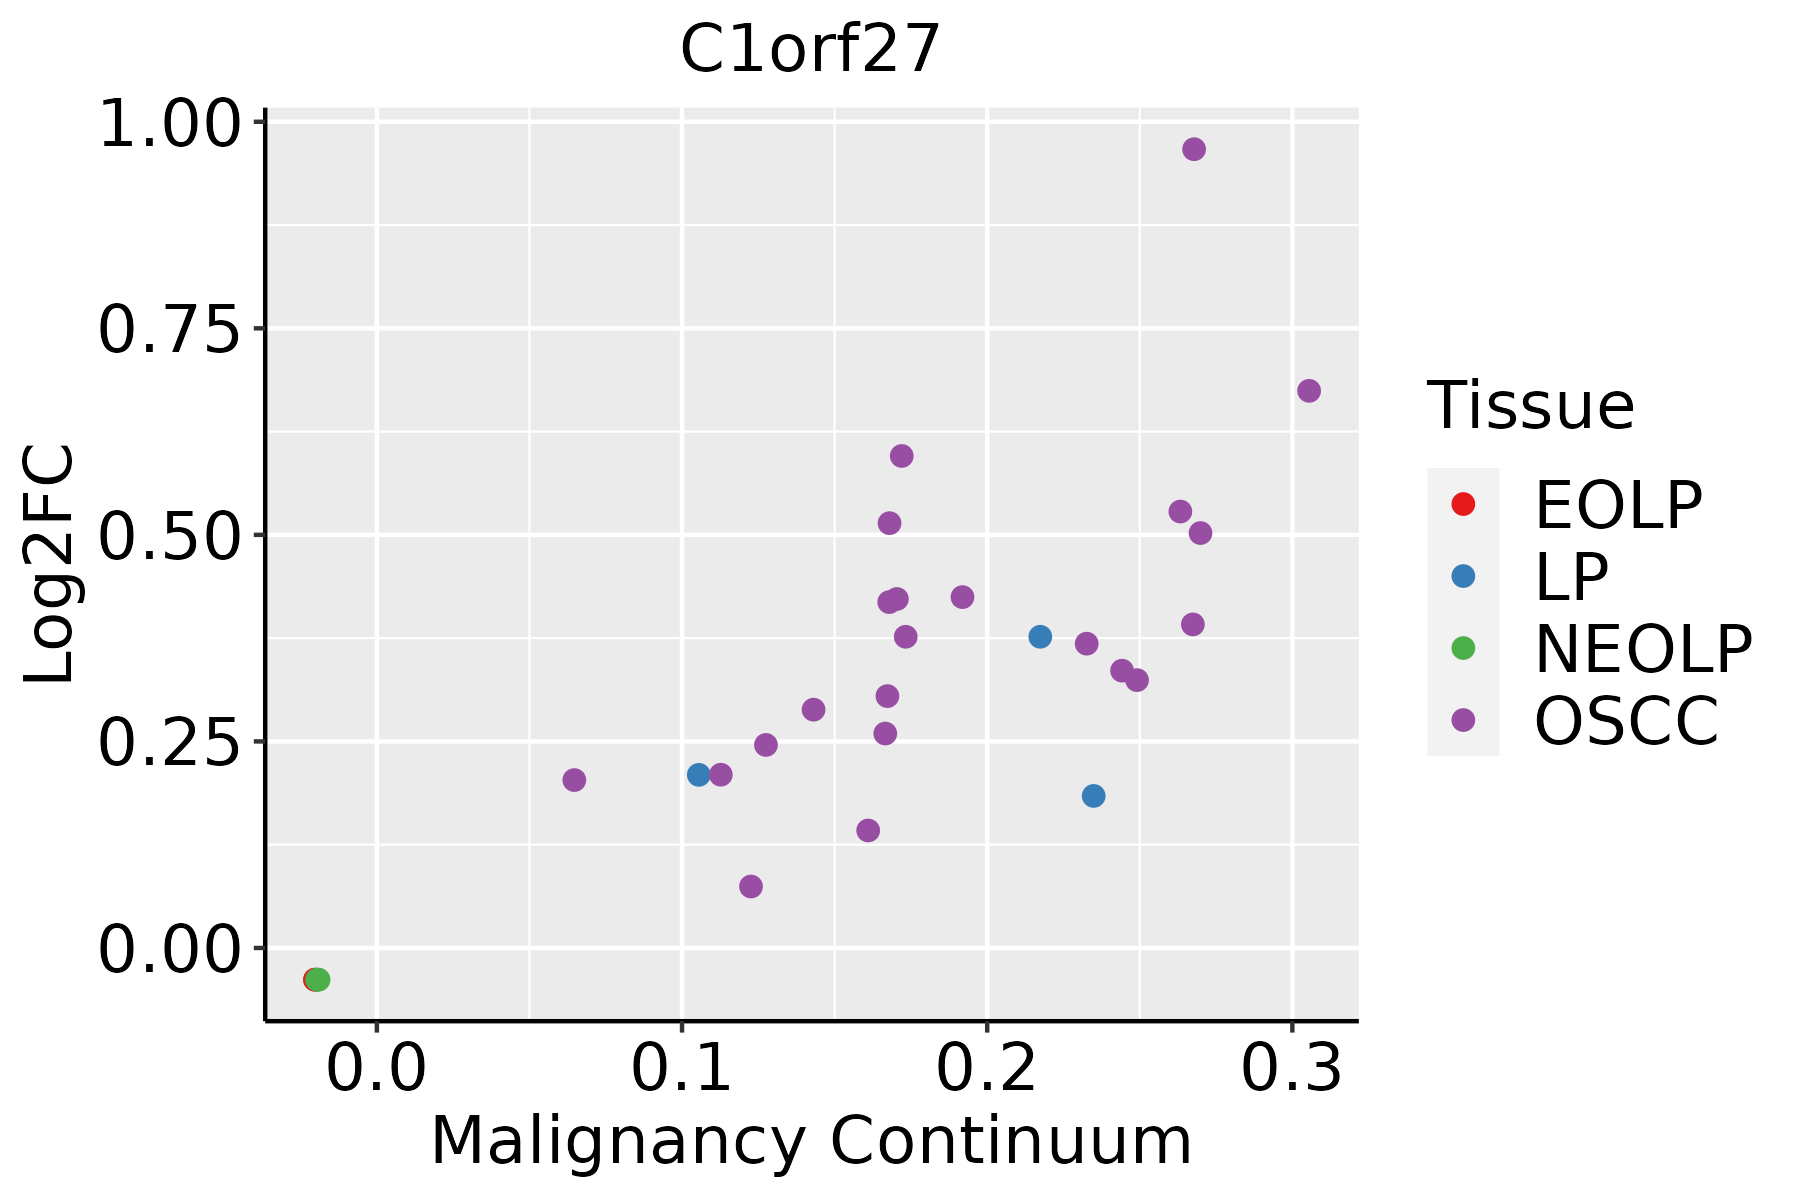 | EOLP: Erosive Oral lichen planus |
| LP: leukoplakia | ||
| NEOLP: Non-erosive oral lichen planus | ||
| OSCC: Oral squamous cell carcinoma | ||
| Skin | 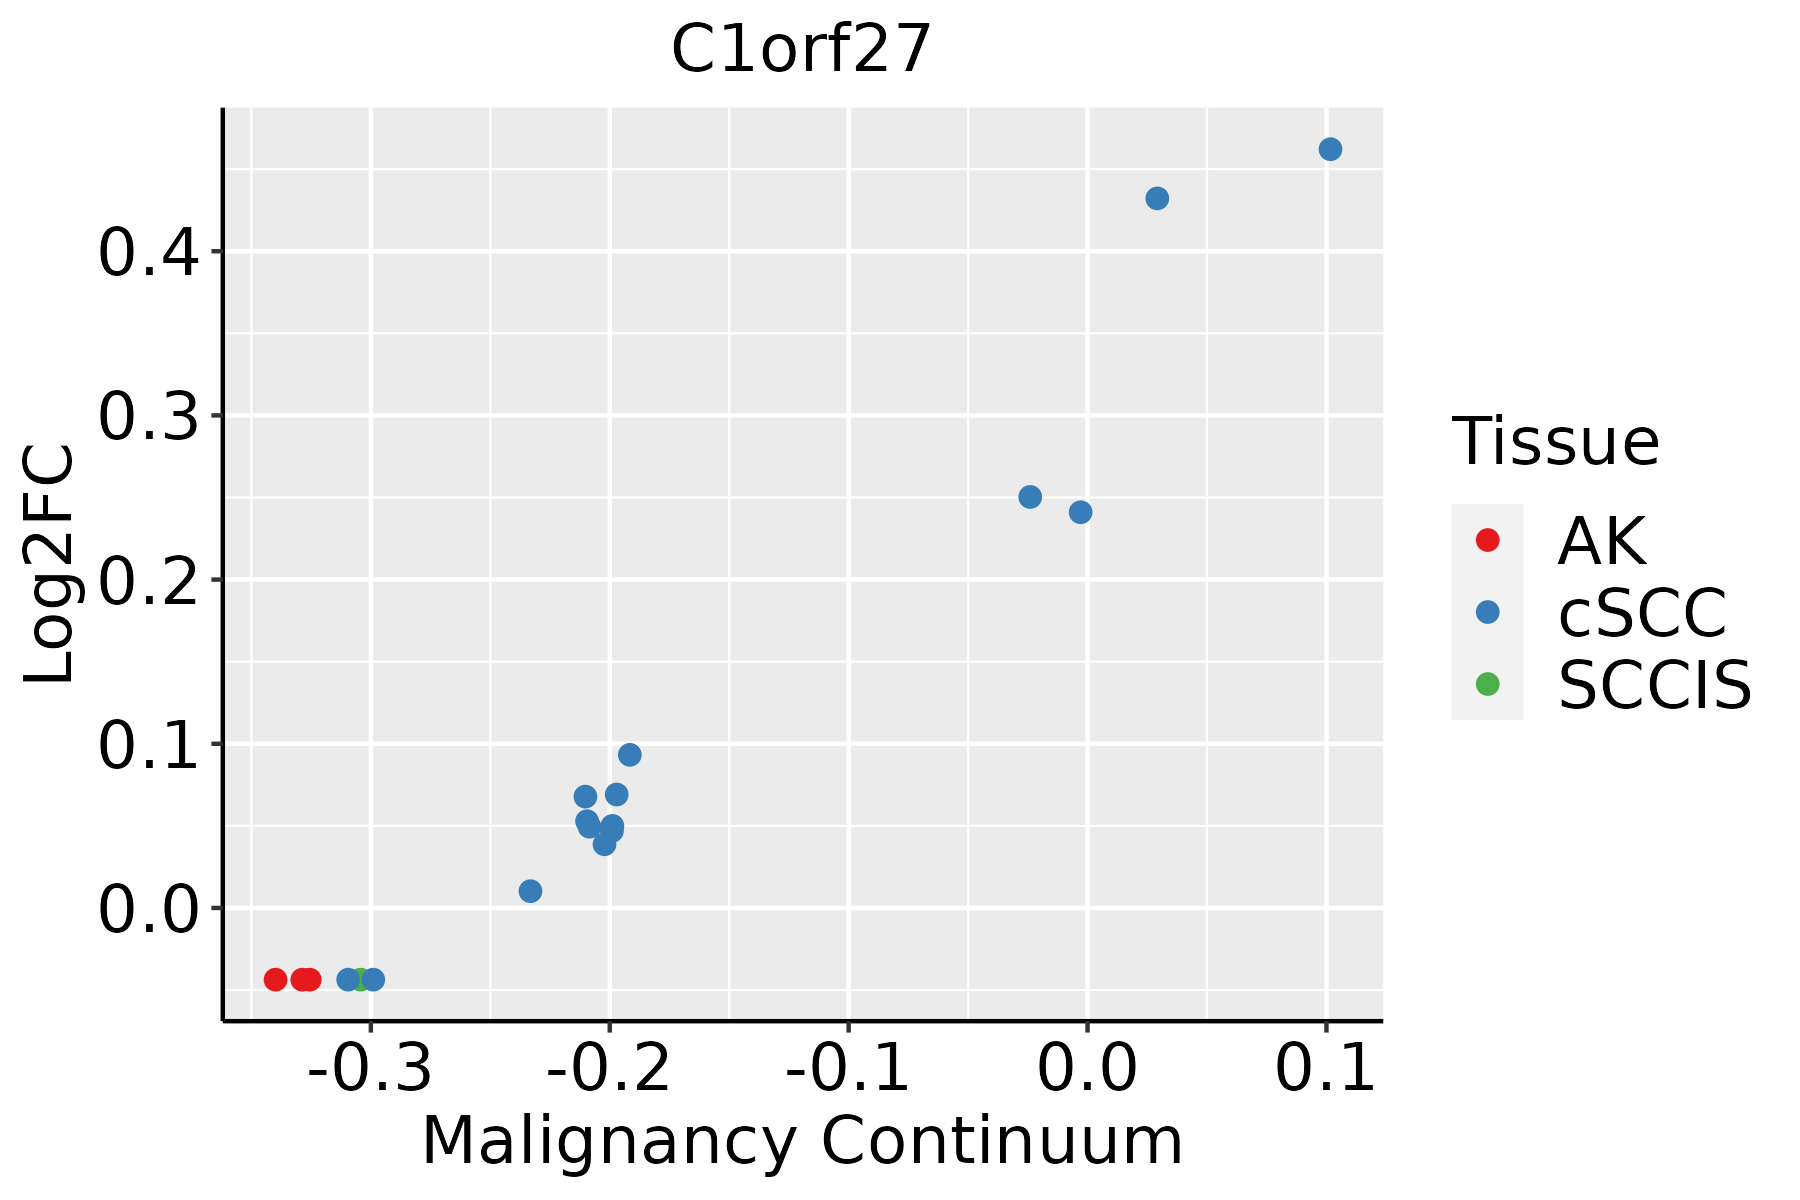 | AK: Actinic keratosis |
| cSCC: Cutaneous squamous cell carcinoma | ||
| SCCIS:squamous cell carcinoma in situ |
| ∗log2FC in expression of this searched gene in stem-like cells from each diseased tissue sample relative to stem-like cells in normal samples in each tissue plotted against the malignancy continuum. Samples are colored based on if they are from different disease stage. |
Top |
Malignant transformation related pathway analysis |
| Find out the enriched GO biological processes and KEGG pathways involved in transition from healthy to precancer to cancer |
| Tissue | Disease Stage | Enriched GO biological Processes |
| Colorectum | AD |  |
| Colorectum | SER |  |
| Colorectum | MSS |  |
| Colorectum | MSI-H |  |
| Colorectum | FAP |  |
| ∗Top 15 enriched GO BP terms are showed in the bar plot of each disease state in each tissue. Each row represents a significant GO biological process which is colored according to the -log10(p.adjust). |
| Page: 1 2 3 4 5 6 7 8 9 |
| GO ID | Tissue | Disease Stage | Description | Gene Ratio | Bg Ratio | pvalue | p.adjust | Count |
| Page: 1 |
| Pathway ID | Tissue | Disease Stage | Description | Gene Ratio | Bg Ratio | pvalue | p.adjust | qvalue | Count |
| Page: 1 |
Top |
Cell-cell communication analysis |
| Identification of potential cell-cell interactions between two cell types and their ligand-receptor pairs for different disease states |
| Ligand | Receptor | LRpair | Pathway | Tissue | Disease Stage |
| Page: 1 |
Top |
Single-cell gene regulatory network inference analysis |
| Find out the significant the regulons (TFs) and the target genes of each regulon across cell types for different disease states |
| TF | Cell Type | Tissue | Disease Stage | Target Gene | RSS | Regulon Activity |
| ∗The dot plots of a searched regulon are shown for all cell subpopulations in each disease state of each tissue based on the regulon specific score inferred using pySCENIC and by calculating the average expression. |
| Page: 1 |
Top |
Somatic mutation of malignant transformation related genes |
| Annotation of somatic variants for genes involved in malignant transformation |
| Hugo Symbol | Variant Class | Variant Classification | dbSNP RS | HGVSc | HGVSp | HGVSp Short | SWISSPROT | BIOTYPE | SIFT | PolyPhen | Tumor Sample Barcode | Tissue | Histology | Sex | Age | Stage | Therapy Types | Drugs | Outcome |
| C1orf27 | SNV | Missense_Mutation | novel | c.254G>T | p.Gly85Val | p.G85V | Q5SWX8 | protein_coding | deleterious(0) | probably_damaging(1) | TCGA-A7-A0DB-01 | Breast | breast invasive carcinoma | Female | <65 | I/II | Hormone Therapy | arimidex | SD |
| C1orf27 | SNV | Missense_Mutation | novel | c.1206N>A | p.Met402Ile | p.M402I | Q5SWX8 | protein_coding | tolerated(0.21) | benign(0) | TCGA-LQ-A4E4-01 | Breast | breast invasive carcinoma | Female | >=65 | III/IV | Hormone Therapy | anastrozole | PD |
| C1orf27 | SNV | Missense_Mutation | novel | c.1131N>A | p.Met377Ile | p.M377I | Q5SWX8 | protein_coding | tolerated(0.12) | benign(0.098) | TCGA-C5-A8XJ-01 | Cervix | cervical & endocervical cancer | Female | >=65 | I/II | Chemotherapy | cisplatin | SD |
| C1orf27 | SNV | Missense_Mutation | rs750735676 | c.325C>T | p.Arg109Cys | p.R109C | Q5SWX8 | protein_coding | deleterious(0) | probably_damaging(1) | TCGA-VS-A9U6-01 | Cervix | cervical & endocervical cancer | Female | <65 | I/II | Chemotherapy | cisplatin | PD |
| C1orf27 | SNV | Missense_Mutation | novel | c.652G>T | p.Gly218Cys | p.G218C | Q5SWX8 | protein_coding | deleterious(0) | probably_damaging(0.989) | TCGA-AG-3892-01 | Colorectum | rectum adenocarcinoma | Female | <65 | I/II | Unknown | Unknown | SD |
| C1orf27 | deletion | Frame_Shift_Del | rs776869231 | c.999delA | p.Asp334IlefsTer22 | p.D334Ifs*22 | Q5SWX8 | protein_coding | TCGA-A6-6781-01 | Colorectum | colon adenocarcinoma | Male | <65 | III/IV | Chemotherapy | oxaliplatin | SD | ||
| C1orf27 | deletion | Frame_Shift_Del | novel | c.72delN | p.Phe25LeufsTer6 | p.F25Lfs*6 | Q5SWX8 | protein_coding | TCGA-AA-3950-01 | Colorectum | colon adenocarcinoma | Female | >=65 | I/II | Unknown | Unknown | SD | ||
| C1orf27 | deletion | Frame_Shift_Del | rs776869231 | c.992delN | p.Asp334IlefsTer22 | p.D334Ifs*22 | Q5SWX8 | protein_coding | TCGA-AY-6197-01 | Colorectum | colon adenocarcinoma | Male | <65 | I/II | Unknown | Unknown | SD | ||
| C1orf27 | SNV | Missense_Mutation | c.1297G>T | p.Gly433Cys | p.G433C | Q5SWX8 | protein_coding | deleterious(0) | probably_damaging(1) | TCGA-AP-A051-01 | Endometrium | uterine corpus endometrioid carcinoma | Female | >=65 | I/II | Unknown | Unknown | SD | |
| C1orf27 | SNV | Missense_Mutation | novel | c.620G>A | p.Gly207Glu | p.G207E | Q5SWX8 | protein_coding | deleterious(0.02) | probably_damaging(0.998) | TCGA-AX-A1CE-01 | Endometrium | uterine corpus endometrioid carcinoma | Female | <65 | I/II | Unspecific | Paclitaxel | SD |
| Page: 1 2 3 4 |
Top |
Related drugs of malignant transformation related genes |
| Identification of chemicals and drugs interact with genes involved in malignant transfromation |
| (DGIdb 4.0) |
| Entrez ID | Symbol | Category | Interaction Types | Drug Claim Name | Drug Name | PMIDs |
| Page: 1 |

Copyright 2023-Present -The University of Texas Health Science Center at Houston |