
|
|||||
|
 | |
| |
| |
| |
| |
| |
|
Gene: C1orf21 |
Gene summary for C1ORF21 |
| Gene information | Species | Human | Gene symbol | C1orf21 | Gene ID | 81563 |
| Gene name | chromosome 1 open reading frame 21 | |
| Gene Alias | PIG13 | |
| Cytomap | 1q25.3 | |
| Gene Type | protein-coding | GO ID | GO:0003674 | UniProtAcc | A0A024R926 |
Top |
Malignant transformation analysis |
| Identification of the aberrant gene expression in precancerous and cancerous lesions by comparing the gene expression of stem-like cells in diseased tissues with normal stem cells |
| Entrez ID | Symbol | Replicates | Species | Organ | Tissue | Adj P-value | Log2FC | Malignancy |
| 81563 | C1orf21 | GSM4909285 | Human | Breast | IDC | 8.01e-03 | -2.31e-01 | 0.21 |
| 81563 | C1orf21 | GSM4909286 | Human | Breast | IDC | 9.95e-05 | 7.14e-03 | 0.1081 |
| 81563 | C1orf21 | GSM4909290 | Human | Breast | IDC | 2.08e-07 | -2.95e-01 | 0.2096 |
| 81563 | C1orf21 | GSM4909293 | Human | Breast | IDC | 3.27e-07 | 3.17e-01 | 0.1581 |
| 81563 | C1orf21 | GSM4909296 | Human | Breast | IDC | 4.08e-04 | -1.64e-02 | 0.1524 |
| 81563 | C1orf21 | GSM4909297 | Human | Breast | IDC | 2.41e-09 | -1.97e-01 | 0.1517 |
| 81563 | C1orf21 | GSM4909298 | Human | Breast | IDC | 1.15e-03 | 1.98e-01 | 0.1551 |
| 81563 | C1orf21 | GSM4909302 | Human | Breast | IDC | 1.34e-24 | 7.21e-01 | 0.1545 |
| 81563 | C1orf21 | GSM4909303 | Human | Breast | IDC | 4.93e-03 | 5.19e-01 | 0.0438 |
| 81563 | C1orf21 | GSM4909304 | Human | Breast | IDC | 8.93e-17 | 4.94e-01 | 0.1636 |
| 81563 | C1orf21 | GSM4909306 | Human | Breast | IDC | 3.33e-04 | 3.66e-01 | 0.1564 |
| 81563 | C1orf21 | GSM4909307 | Human | Breast | IDC | 1.99e-02 | 3.43e-01 | 0.1569 |
| 81563 | C1orf21 | GSM4909308 | Human | Breast | IDC | 3.87e-37 | 7.80e-01 | 0.158 |
| 81563 | C1orf21 | GSM4909309 | Human | Breast | IDC | 3.16e-04 | -2.27e-01 | 0.0483 |
| 81563 | C1orf21 | GSM4909311 | Human | Breast | IDC | 1.73e-14 | -1.15e-01 | 0.1534 |
| 81563 | C1orf21 | GSM4909312 | Human | Breast | IDC | 3.36e-03 | 8.79e-02 | 0.1552 |
| 81563 | C1orf21 | GSM4909313 | Human | Breast | IDC | 2.84e-02 | 2.72e-01 | 0.0391 |
| 81563 | C1orf21 | GSM4909317 | Human | Breast | IDC | 4.86e-02 | -2.22e-01 | 0.1355 |
| 81563 | C1orf21 | GSM4909319 | Human | Breast | IDC | 6.83e-25 | 6.00e-03 | 0.1563 |
| 81563 | C1orf21 | GSM4909321 | Human | Breast | IDC | 9.77e-05 | -6.22e-02 | 0.1559 |
| Page: 1 2 3 4 5 6 7 8 9 |
| Tissue | Expression Dynamics | Abbreviation |
| Breast |  | IDC: Invasive ductal carcinoma |
| DCIS: Ductal carcinoma in situ | ||
| Precancer(BRCA1-mut): Precancerous lesion from BRCA1 mutation carriers | ||
| Colorectum (GSE201348) |  | FAP: Familial adenomatous polyposis |
| CRC: Colorectal cancer | ||
| Colorectum (HTA11) |  | AD: Adenomas |
| SER: Sessile serrated lesions | ||
| MSI-H: Microsatellite-high colorectal cancer | ||
| MSS: Microsatellite stable colorectal cancer | ||
| Esophagus | 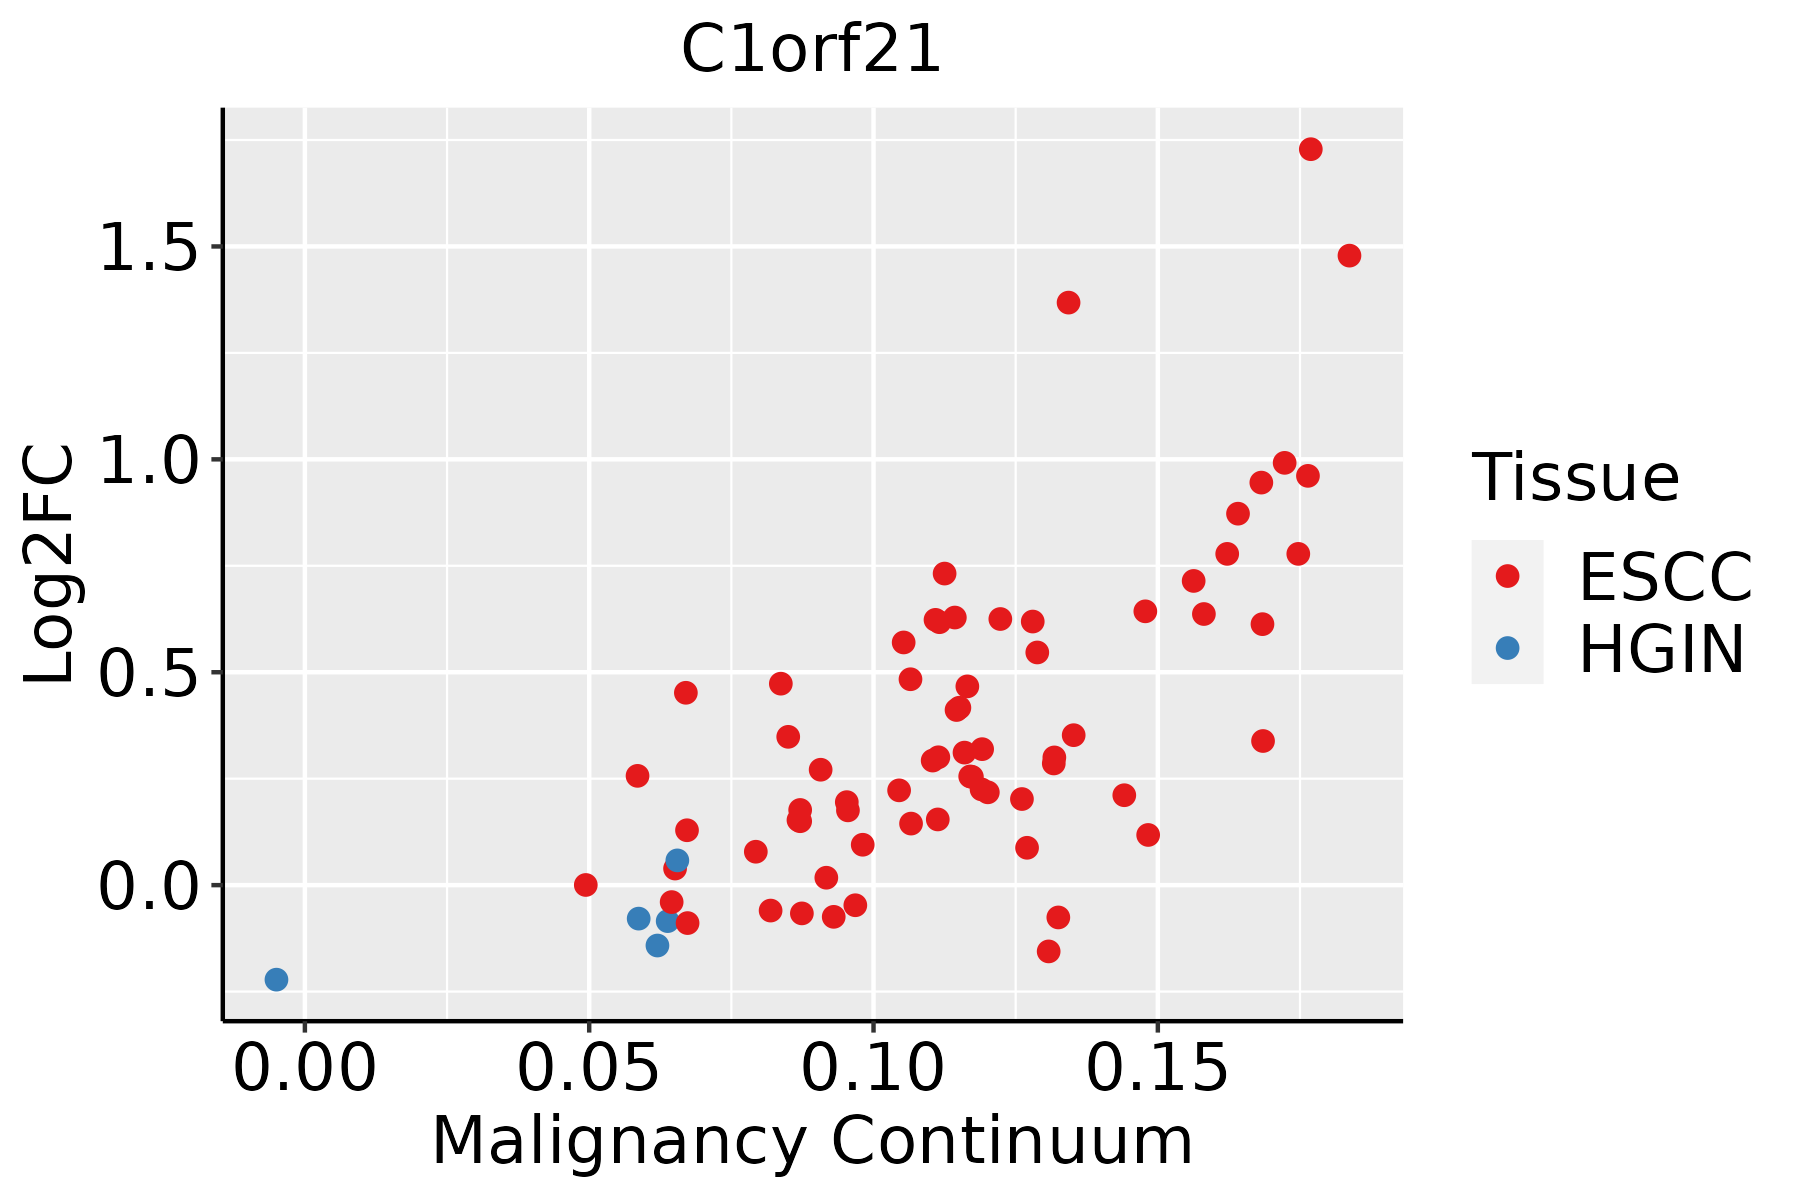 | ESCC: Esophageal squamous cell carcinoma |
| HGIN: High-grade intraepithelial neoplasias | ||
| LGIN: Low-grade intraepithelial neoplasias | ||
| Lung | 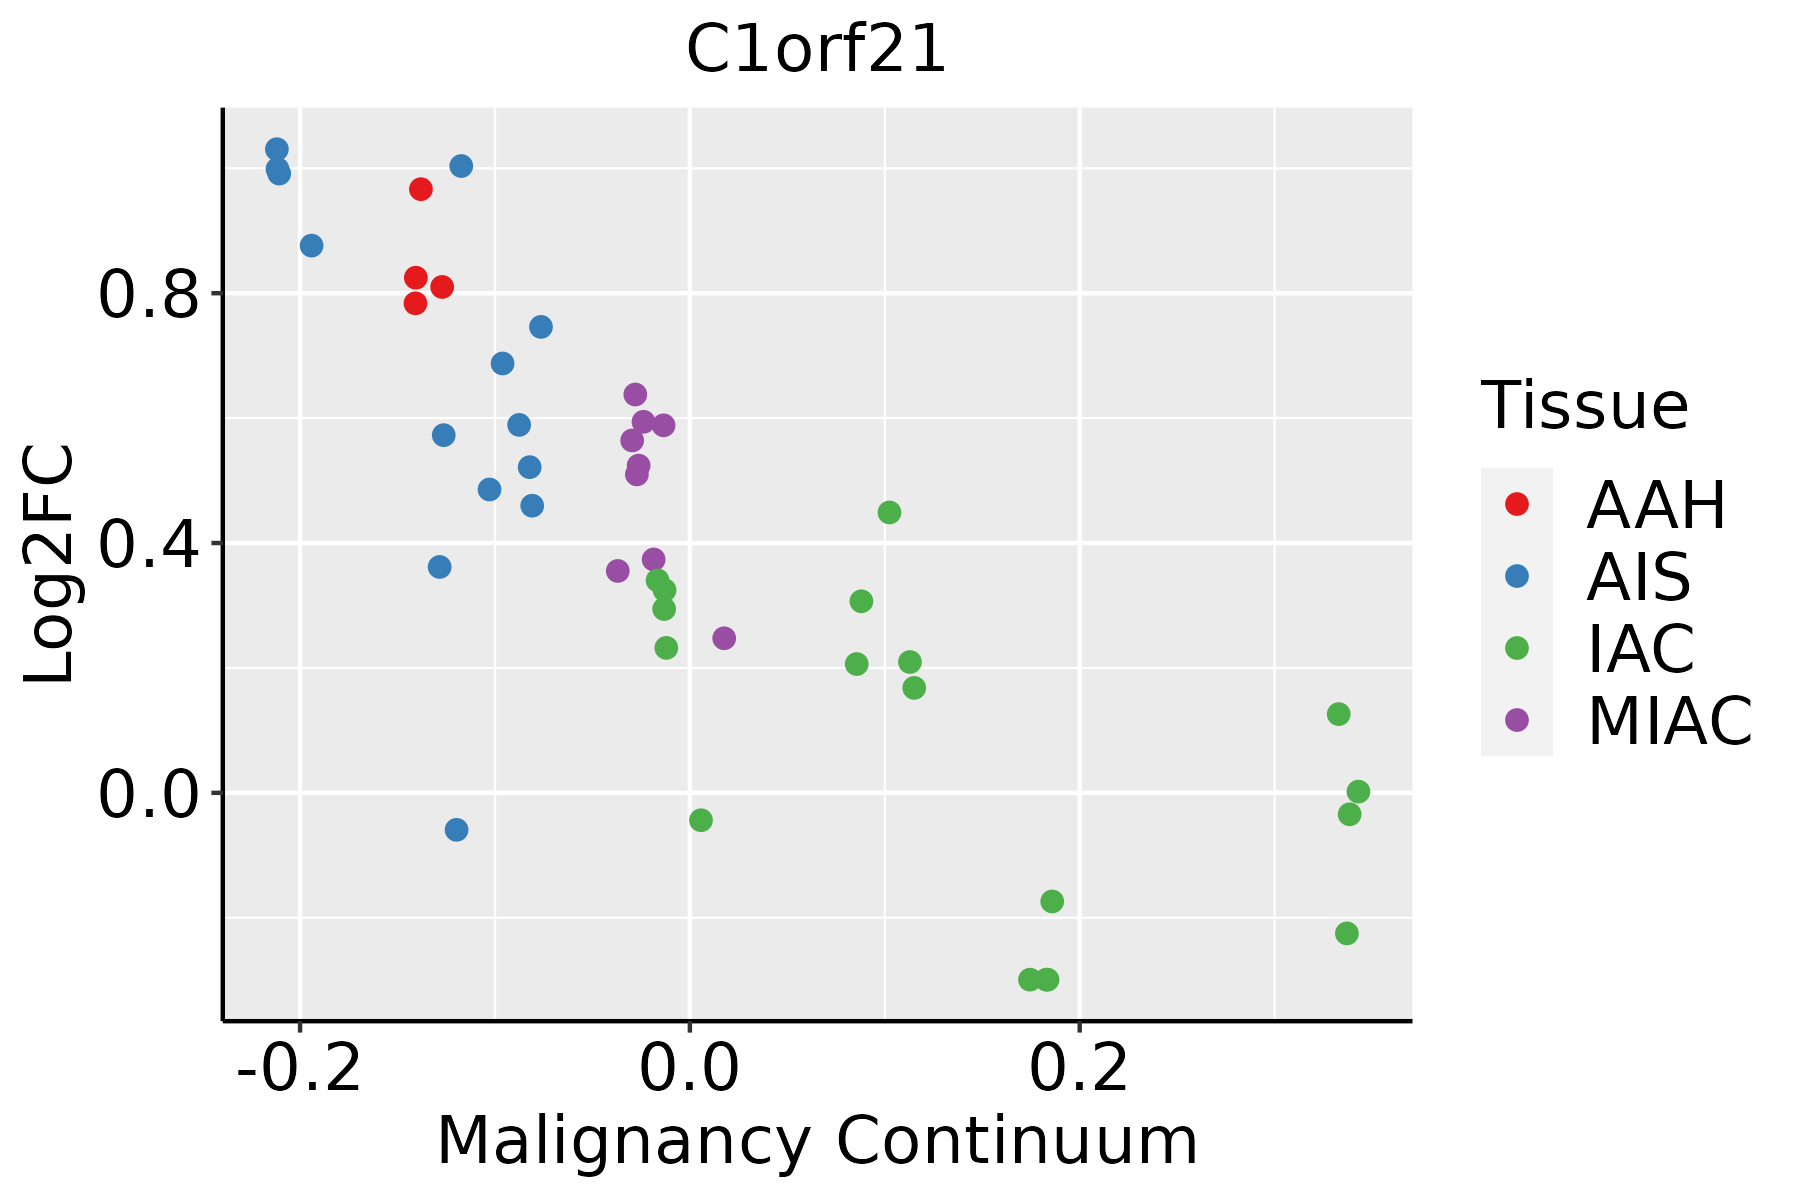 | AAH: Atypical adenomatous hyperplasia |
| AIS: Adenocarcinoma in situ | ||
| IAC: Invasive lung adenocarcinoma | ||
| MIA: Minimally invasive adenocarcinoma | ||
| Oral Cavity |  | EOLP: Erosive Oral lichen planus |
| LP: leukoplakia | ||
| NEOLP: Non-erosive oral lichen planus | ||
| OSCC: Oral squamous cell carcinoma | ||
| Skin |  | AK: Actinic keratosis |
| cSCC: Cutaneous squamous cell carcinoma | ||
| SCCIS:squamous cell carcinoma in situ |
| ∗log2FC in expression of this searched gene in stem-like cells from each diseased tissue sample relative to stem-like cells in normal samples in each tissue plotted against the malignancy continuum. Samples are colored based on if they are from different disease stage. |
Top |
Malignant transformation related pathway analysis |
| Find out the enriched GO biological processes and KEGG pathways involved in transition from healthy to precancer to cancer |
| Tissue | Disease Stage | Enriched GO biological Processes |
| Colorectum | AD |  |
| Colorectum | SER |  |
| Colorectum | MSS |  |
| Colorectum | MSI-H |  |
| Colorectum | FAP |  |
| ∗Top 15 enriched GO BP terms are showed in the bar plot of each disease state in each tissue. Each row represents a significant GO biological process which is colored according to the -log10(p.adjust). |
| Page: 1 2 3 4 5 6 7 8 9 |
| GO ID | Tissue | Disease Stage | Description | Gene Ratio | Bg Ratio | pvalue | p.adjust | Count |
| Page: 1 |
| Pathway ID | Tissue | Disease Stage | Description | Gene Ratio | Bg Ratio | pvalue | p.adjust | qvalue | Count |
| Page: 1 |
Top |
Cell-cell communication analysis |
| Identification of potential cell-cell interactions between two cell types and their ligand-receptor pairs for different disease states |
| Ligand | Receptor | LRpair | Pathway | Tissue | Disease Stage |
| Page: 1 |
Top |
Single-cell gene regulatory network inference analysis |
| Find out the significant the regulons (TFs) and the target genes of each regulon across cell types for different disease states |
| TF | Cell Type | Tissue | Disease Stage | Target Gene | RSS | Regulon Activity |
| ∗The dot plots of a searched regulon are shown for all cell subpopulations in each disease state of each tissue based on the regulon specific score inferred using pySCENIC and by calculating the average expression. |
| Page: 1 |
Top |
Somatic mutation of malignant transformation related genes |
| Annotation of somatic variants for genes involved in malignant transformation |
| Hugo Symbol | Variant Class | Variant Classification | dbSNP RS | HGVSc | HGVSp | HGVSp Short | SWISSPROT | BIOTYPE | SIFT | PolyPhen | Tumor Sample Barcode | Tissue | Histology | Sex | Age | Stage | Therapy Types | Drugs | Outcome |
| C1orf21 | SNV | Missense_Mutation | c.349N>C | p.Glu117Gln | p.E117Q | Q9H246 | protein_coding | tolerated(0.06) | possibly_damaging(0.607) | TCGA-A2-A0YK-01 | Breast | breast invasive carcinoma | Female | <65 | I/II | Chemotherapy | cytoxan | SD | |
| C1orf21 | SNV | Missense_Mutation | c.310N>T | p.Asp104Tyr | p.D104Y | Q9H246 | protein_coding | deleterious(0) | probably_damaging(0.979) | TCGA-C5-A2LT-01 | Cervix | cervical & endocervical cancer | Female | <65 | I/II | Chemotherapy | cisplatin | SD | |
| C1orf21 | SNV | Missense_Mutation | c.14N>T | p.Ser5Phe | p.S5F | Q9H246 | protein_coding | deleterious(0) | probably_damaging(0.983) | TCGA-LP-A4AX-01 | Cervix | cervical & endocervical cancer | Female | <65 | I/II | Unknown | Unknown | SD | |
| C1orf21 | SNV | Missense_Mutation | c.242G>A | p.Gly81Glu | p.G81E | Q9H246 | protein_coding | deleterious(0.01) | probably_damaging(0.988) | TCGA-A6-2681-01 | Colorectum | colon adenocarcinoma | Female | >=65 | I/II | Unknown | Unknown | PD | |
| C1orf21 | SNV | Missense_Mutation | c.314A>G | p.Glu105Gly | p.E105G | Q9H246 | protein_coding | deleterious(0) | benign(0.025) | TCGA-AD-6964-01 | Colorectum | colon adenocarcinoma | Male | <65 | III/IV | Chemotherapy | folfox | PD | |
| C1orf21 | SNV | Missense_Mutation | c.28N>A | p.Ala10Thr | p.A10T | Q9H246 | protein_coding | deleterious(0.01) | benign(0.015) | TCGA-AY-6197-01 | Colorectum | colon adenocarcinoma | Male | <65 | I/II | Unknown | Unknown | SD | |
| C1orf21 | SNV | Missense_Mutation | novel | c.317A>G | p.Lys106Arg | p.K106R | Q9H246 | protein_coding | deleterious(0) | possibly_damaging(0.801) | TCGA-AG-3726-01 | Colorectum | rectum adenocarcinoma | Female | <65 | I/II | Unknown | Unknown | SD |
| C1orf21 | SNV | Missense_Mutation | novel | c.200N>T | p.Ala67Val | p.A67V | Q9H246 | protein_coding | tolerated(0.09) | benign(0.001) | TCGA-AP-A0LM-01 | Endometrium | uterine corpus endometrioid carcinoma | Female | <65 | III/IV | Chemotherapy | cisplatin | SD |
| C1orf21 | SNV | Missense_Mutation | c.250N>T | p.His84Tyr | p.H84Y | Q9H246 | protein_coding | tolerated(0.31) | possibly_damaging(0.607) | TCGA-BS-A0UF-01 | Endometrium | uterine corpus endometrioid carcinoma | Female | >=65 | I/II | Unknown | Unknown | SD | |
| C1orf21 | SNV | Missense_Mutation | c.297N>A | p.Phe99Leu | p.F99L | Q9H246 | protein_coding | deleterious(0.01) | possibly_damaging(0.682) | TCGA-BS-A0UV-01 | Endometrium | uterine corpus endometrioid carcinoma | Female | <65 | III/IV | Unknown | Unknown | SD |
| Page: 1 2 |
Top |
Related drugs of malignant transformation related genes |
| Identification of chemicals and drugs interact with genes involved in malignant transfromation |
| (DGIdb 4.0) |
| Entrez ID | Symbol | Category | Interaction Types | Drug Claim Name | Drug Name | PMIDs |
| Page: 1 |

Copyright 2023-Present -The University of Texas Health Science Center at Houston |