
|
|||||
|
 | |
| |
| |
| |
| |
| |
|
Gene: C1orf174 |
Gene summary for C1ORF174 |
| Gene information | Species | Human | Gene symbol | C1orf174 | Gene ID | 339448 |
| Gene name | chromosome 1 open reading frame 174 | |
| Gene Alias | C1orf174 | |
| Cytomap | 1p36.32 | |
| Gene Type | protein-coding | GO ID | GO:0005575 | UniProtAcc | Q8IYL3 |
Top |
Malignant transformation analysis |
| Identification of the aberrant gene expression in precancerous and cancerous lesions by comparing the gene expression of stem-like cells in diseased tissues with normal stem cells |
| Entrez ID | Symbol | Replicates | Species | Organ | Tissue | Adj P-value | Log2FC | Malignancy |
| 339448 | C1orf174 | LZE4T | Human | Esophagus | ESCC | 7.79e-09 | 2.71e-01 | 0.0811 |
| 339448 | C1orf174 | LZE7T | Human | Esophagus | ESCC | 5.01e-03 | 1.58e-01 | 0.0667 |
| 339448 | C1orf174 | LZE8T | Human | Esophagus | ESCC | 1.68e-04 | 2.10e-01 | 0.067 |
| 339448 | C1orf174 | LZE20T | Human | Esophagus | ESCC | 3.31e-10 | 2.46e-01 | 0.0662 |
| 339448 | C1orf174 | LZE22D1 | Human | Esophagus | HGIN | 2.62e-02 | 1.82e-01 | 0.0595 |
| 339448 | C1orf174 | LZE24T | Human | Esophagus | ESCC | 3.20e-15 | 4.84e-01 | 0.0596 |
| 339448 | C1orf174 | LZE6T | Human | Esophagus | ESCC | 2.22e-04 | 1.95e-01 | 0.0845 |
| 339448 | C1orf174 | P1T-E | Human | Esophagus | ESCC | 1.47e-03 | 3.09e-01 | 0.0875 |
| 339448 | C1orf174 | P2T-E | Human | Esophagus | ESCC | 4.97e-44 | 7.08e-01 | 0.1177 |
| 339448 | C1orf174 | P4T-E | Human | Esophagus | ESCC | 3.19e-33 | 8.91e-01 | 0.1323 |
| 339448 | C1orf174 | P5T-E | Human | Esophagus | ESCC | 1.87e-21 | 4.14e-01 | 0.1327 |
| 339448 | C1orf174 | P8T-E | Human | Esophagus | ESCC | 1.30e-32 | 5.66e-01 | 0.0889 |
| 339448 | C1orf174 | P9T-E | Human | Esophagus | ESCC | 3.83e-11 | 2.47e-01 | 0.1131 |
| 339448 | C1orf174 | P10T-E | Human | Esophagus | ESCC | 8.18e-45 | 6.74e-01 | 0.116 |
| 339448 | C1orf174 | P11T-E | Human | Esophagus | ESCC | 4.48e-09 | 4.22e-01 | 0.1426 |
| 339448 | C1orf174 | P12T-E | Human | Esophagus | ESCC | 7.66e-16 | 3.52e-01 | 0.1122 |
| 339448 | C1orf174 | P15T-E | Human | Esophagus | ESCC | 3.95e-23 | 4.61e-01 | 0.1149 |
| 339448 | C1orf174 | P16T-E | Human | Esophagus | ESCC | 2.14e-26 | 4.32e-01 | 0.1153 |
| 339448 | C1orf174 | P17T-E | Human | Esophagus | ESCC | 1.11e-09 | 3.73e-01 | 0.1278 |
| 339448 | C1orf174 | P19T-E | Human | Esophagus | ESCC | 4.21e-12 | 8.43e-01 | 0.1662 |
| Page: 1 2 3 4 5 |
| Tissue | Expression Dynamics | Abbreviation |
| Esophagus |  | ESCC: Esophageal squamous cell carcinoma |
| HGIN: High-grade intraepithelial neoplasias | ||
| LGIN: Low-grade intraepithelial neoplasias | ||
| Liver |  | HCC: Hepatocellular carcinoma |
| NAFLD: Non-alcoholic fatty liver disease | ||
| Oral Cavity | 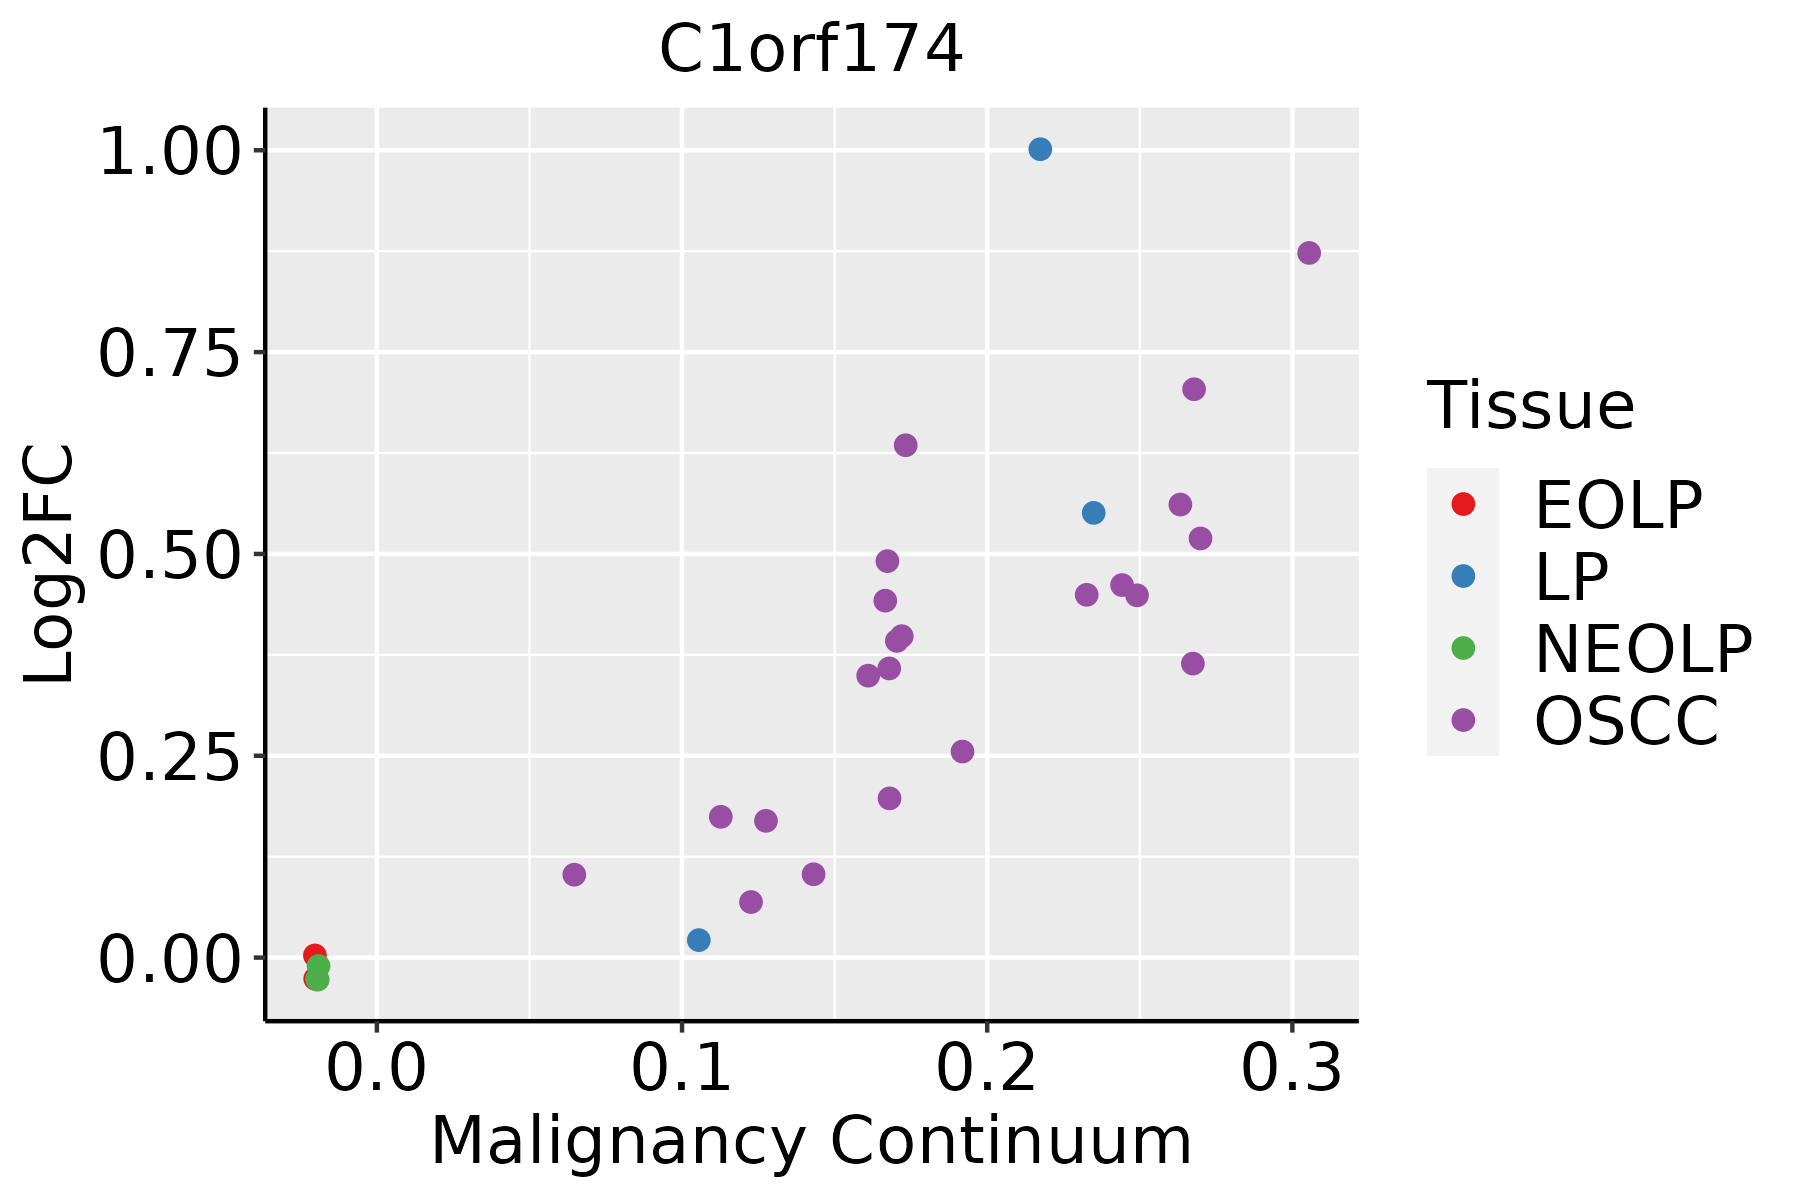 | EOLP: Erosive Oral lichen planus |
| LP: leukoplakia | ||
| NEOLP: Non-erosive oral lichen planus | ||
| OSCC: Oral squamous cell carcinoma | ||
| Skin | 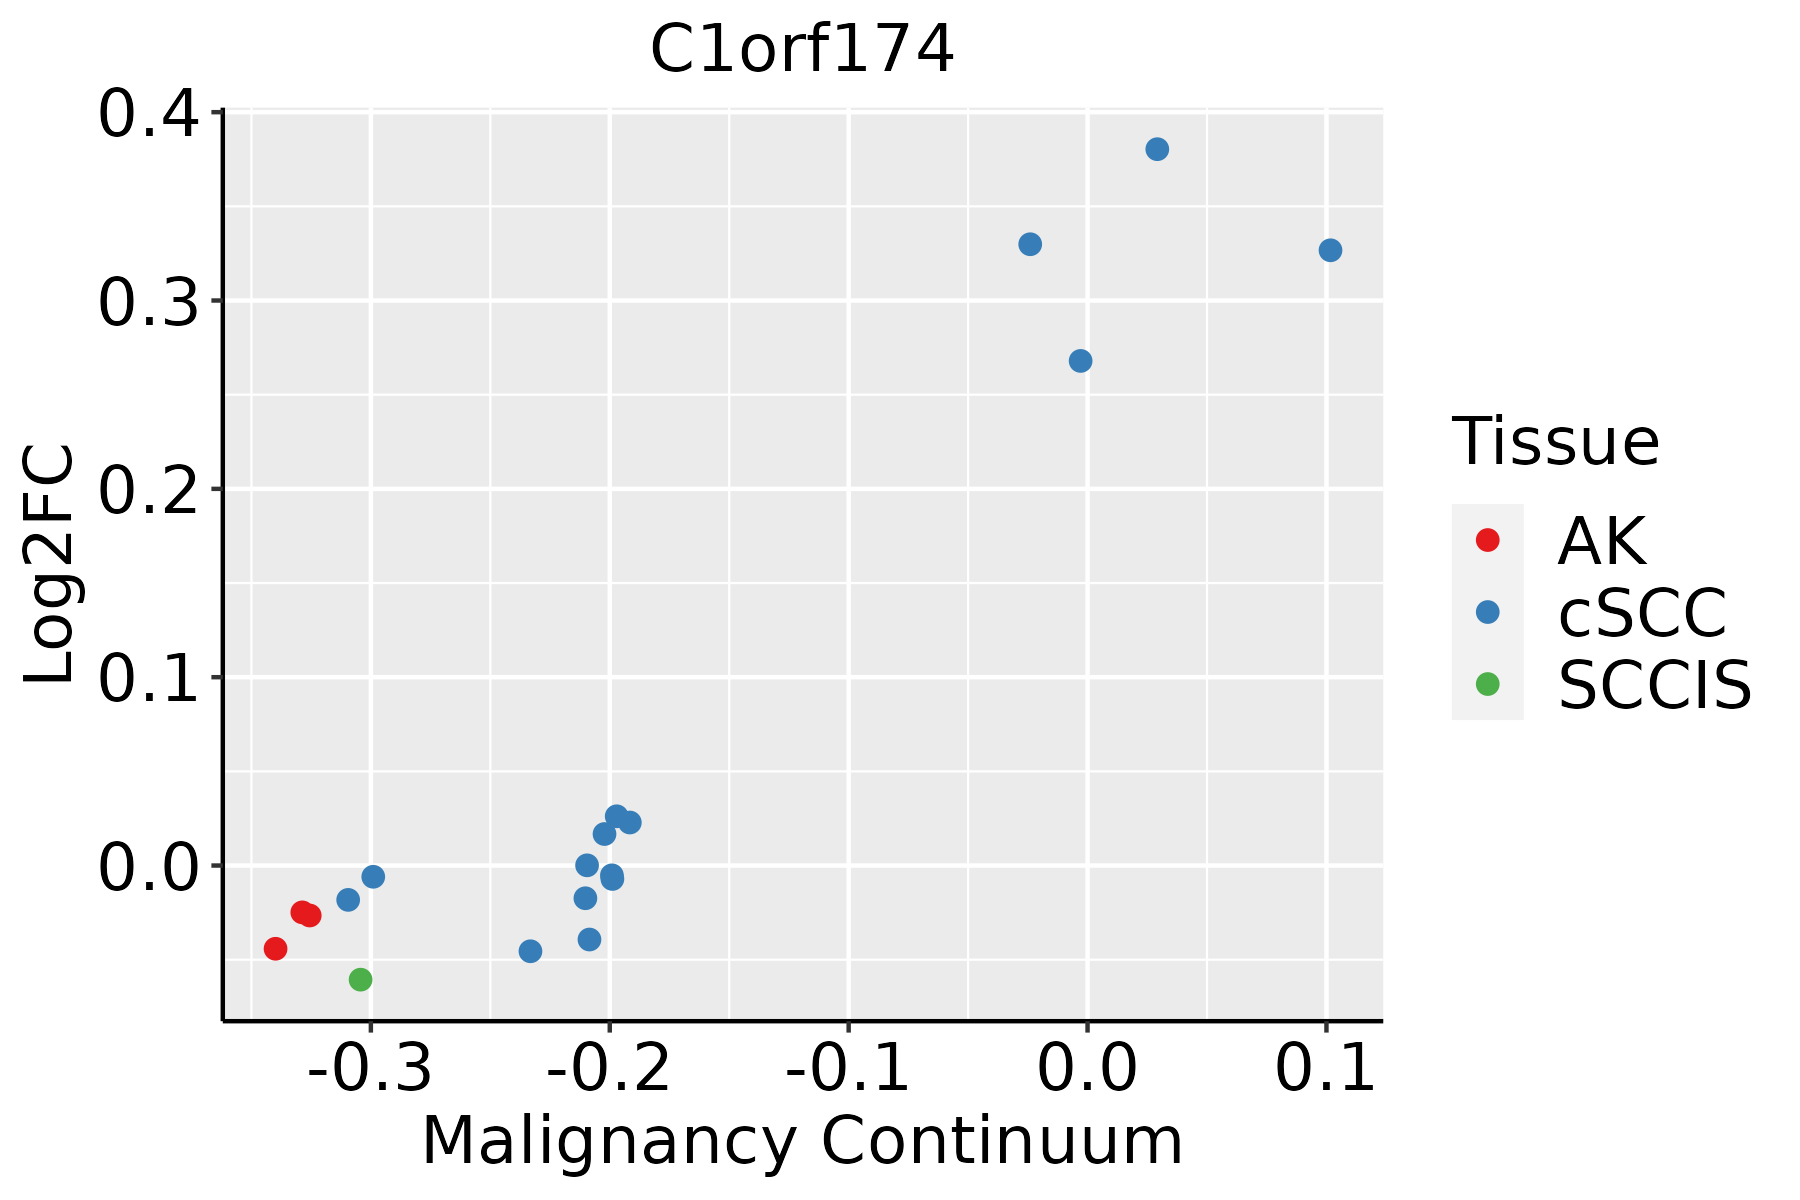 | AK: Actinic keratosis |
| cSCC: Cutaneous squamous cell carcinoma | ||
| SCCIS:squamous cell carcinoma in situ |
| ∗log2FC in expression of this searched gene in stem-like cells from each diseased tissue sample relative to stem-like cells in normal samples in each tissue plotted against the malignancy continuum. Samples are colored based on if they are from different disease stage. |
Top |
Malignant transformation related pathway analysis |
| Find out the enriched GO biological processes and KEGG pathways involved in transition from healthy to precancer to cancer |
| Tissue | Disease Stage | Enriched GO biological Processes |
| Colorectum | AD |  |
| Colorectum | SER |  |
| Colorectum | MSS |  |
| Colorectum | MSI-H |  |
| Colorectum | FAP |  |
| ∗Top 15 enriched GO BP terms are showed in the bar plot of each disease state in each tissue. Each row represents a significant GO biological process which is colored according to the -log10(p.adjust). |
| Page: 1 2 3 4 5 6 7 8 9 |
| GO ID | Tissue | Disease Stage | Description | Gene Ratio | Bg Ratio | pvalue | p.adjust | Count |
| Page: 1 |
| Pathway ID | Tissue | Disease Stage | Description | Gene Ratio | Bg Ratio | pvalue | p.adjust | qvalue | Count |
| Page: 1 |
Top |
Cell-cell communication analysis |
| Identification of potential cell-cell interactions between two cell types and their ligand-receptor pairs for different disease states |
| Ligand | Receptor | LRpair | Pathway | Tissue | Disease Stage |
| Page: 1 |
Top |
Single-cell gene regulatory network inference analysis |
| Find out the significant the regulons (TFs) and the target genes of each regulon across cell types for different disease states |
| TF | Cell Type | Tissue | Disease Stage | Target Gene | RSS | Regulon Activity |
| ∗The dot plots of a searched regulon are shown for all cell subpopulations in each disease state of each tissue based on the regulon specific score inferred using pySCENIC and by calculating the average expression. |
| Page: 1 |
Top |
Somatic mutation of malignant transformation related genes |
| Annotation of somatic variants for genes involved in malignant transformation |
| Hugo Symbol | Variant Class | Variant Classification | dbSNP RS | HGVSc | HGVSp | HGVSp Short | SWISSPROT | BIOTYPE | SIFT | PolyPhen | Tumor Sample Barcode | Tissue | Histology | Sex | Age | Stage | Therapy Types | Drugs | Outcome |
| C1orf174 | SNV | Missense_Mutation | c.607N>C | p.Glu203Gln | p.E203Q | Q8IYL3 | protein_coding | deleterious(0) | probably_damaging(0.998) | TCGA-A8-A07R-01 | Breast | breast invasive carcinoma | Female | >=65 | III/IV | Ancillary | zoledronic | SD | |
| C1orf174 | SNV | Missense_Mutation | rs367965839 | c.547N>A | p.Val183Ile | p.V183I | Q8IYL3 | protein_coding | tolerated(0.32) | benign(0.003) | TCGA-GM-A3NY-01 | Breast | breast invasive carcinoma | Female | >=65 | I/II | Hormone Therapy | arimidex | SD |
| C1orf174 | insertion | Frame_Shift_Ins | novel | c.455_456insCA | p.Glu152AspfsTer35 | p.E152Dfs*35 | Q8IYL3 | protein_coding | TCGA-A2-A0D1-01 | Breast | breast invasive carcinoma | Female | >=65 | I/II | Chemotherapy | taxotere | SD | ||
| C1orf174 | insertion | Frame_Shift_Ins | novel | c.453_454insAAATGCATTTCAGAGCCAAAGATGATGATGATGAC | p.Glu152LysfsTer46 | p.E152Kfs*46 | Q8IYL3 | protein_coding | TCGA-A2-A0D1-01 | Breast | breast invasive carcinoma | Female | >=65 | I/II | Chemotherapy | taxotere | SD | ||
| C1orf174 | SNV | Missense_Mutation | rs140673232 | c.319G>A | p.Glu107Lys | p.E107K | Q8IYL3 | protein_coding | tolerated(0.68) | benign(0.013) | TCGA-MA-AA42-01 | Cervix | cervical & endocervical cancer | Female | >=65 | I/II | Unknown | Unknown | SD |
| C1orf174 | SNV | Missense_Mutation | rs149232221 | c.241G>A | p.Ala81Thr | p.A81T | Q8IYL3 | protein_coding | tolerated(0.28) | benign(0.072) | TCGA-ZJ-AAXF-01 | Cervix | cervical & endocervical cancer | Female | <65 | I/II | Unknown | Unknown | SD |
| C1orf174 | SNV | Missense_Mutation | novel | c.283N>A | p.Glu95Lys | p.E95K | Q8IYL3 | protein_coding | tolerated(0.15) | benign(0.038) | TCGA-ZJ-AAXU-01 | Cervix | cervical & endocervical cancer | Female | <65 | I/II | Unknown | Unknown | SD |
| C1orf174 | SNV | Missense_Mutation | c.594N>A | p.Phe198Leu | p.F198L | Q8IYL3 | protein_coding | deleterious(0) | probably_damaging(0.997) | TCGA-AA-A010-01 | Colorectum | colon adenocarcinoma | Female | <65 | I/II | Chemotherapy | folinic | CR | |
| C1orf174 | SNV | Missense_Mutation | novel | c.350N>T | p.Ala117Val | p.A117V | Q8IYL3 | protein_coding | tolerated(0.17) | benign(0.359) | TCGA-AP-A1DK-01 | Endometrium | uterine corpus endometrioid carcinoma | Female | <65 | I/II | Unknown | Unknown | SD |
| C1orf174 | SNV | Missense_Mutation | rs751234275 | c.437N>T | p.Ala146Val | p.A146V | Q8IYL3 | protein_coding | tolerated(0.21) | benign(0.344) | TCGA-AX-A06F-01 | Endometrium | uterine corpus endometrioid carcinoma | Female | <65 | III/IV | Chemotherapy | carboplatin | SD |
| Page: 1 2 3 |
Top |
Related drugs of malignant transformation related genes |
| Identification of chemicals and drugs interact with genes involved in malignant transfromation |
| (DGIdb 4.0) |
| Entrez ID | Symbol | Category | Interaction Types | Drug Claim Name | Drug Name | PMIDs |
| Page: 1 |

Copyright 2023-Present -The University of Texas Health Science Center at Houston |