
|
|||||
|
 | |
| |
| |
| |
| |
| |
|
Gene: C1orf115 |
Gene summary for C1ORF115 |
| Gene information | Species | Human | Gene symbol | C1orf115 | Gene ID | 79762 |
| Gene name | chromosome 1 open reading frame 115 | |
| Gene Alias | RDD1 | |
| Cytomap | 1q41 | |
| Gene Type | protein-coding | GO ID | GO:0005575 | UniProtAcc | Q9H7X2 |
Top |
Malignant transformation analysis |
| Identification of the aberrant gene expression in precancerous and cancerous lesions by comparing the gene expression of stem-like cells in diseased tissues with normal stem cells |
| Entrez ID | Symbol | Replicates | Species | Organ | Tissue | Adj P-value | Log2FC | Malignancy |
| 79762 | C1orf115 | HTA11_2487_2000001011 | Human | Colorectum | SER | 2.65e-11 | 5.12e-01 | -0.1808 |
| 79762 | C1orf115 | HTA11_1938_2000001011 | Human | Colorectum | AD | 2.60e-02 | 2.35e-01 | -0.0811 |
| 79762 | C1orf115 | HTA11_347_2000001011 | Human | Colorectum | AD | 3.04e-05 | 2.61e-01 | -0.1954 |
| 79762 | C1orf115 | HTA11_3361_2000001011 | Human | Colorectum | AD | 1.05e-02 | 2.87e-01 | -0.1207 |
| 79762 | C1orf115 | HTA11_696_2000001011 | Human | Colorectum | AD | 2.87e-02 | 1.23e-01 | -0.1464 |
| 79762 | C1orf115 | HTA11_1391_2000001011 | Human | Colorectum | AD | 9.91e-08 | 2.75e-01 | -0.059 |
| 79762 | C1orf115 | HTA11_5212_2000001011 | Human | Colorectum | AD | 5.04e-03 | 3.00e-01 | -0.2061 |
| 79762 | C1orf115 | HTA11_7696_3000711011 | Human | Colorectum | AD | 2.88e-04 | 1.18e-01 | 0.0674 |
| 79762 | C1orf115 | HCC1_Meng | Human | Liver | HCC | 2.08e-64 | 1.52e-01 | 0.0246 |
| 79762 | C1orf115 | HCC2_Meng | Human | Liver | HCC | 1.01e-07 | 6.66e-02 | 0.0107 |
| 79762 | C1orf115 | HCC1 | Human | Liver | HCC | 5.90e-13 | 3.30e+00 | 0.5336 |
| 79762 | C1orf115 | HCC2 | Human | Liver | HCC | 1.51e-23 | 3.61e+00 | 0.5341 |
| 79762 | C1orf115 | Pt13.b | Human | Liver | HCC | 2.88e-08 | 1.05e-01 | 0.0251 |
| 79762 | C1orf115 | S014 | Human | Liver | HCC | 3.34e-03 | 1.90e-01 | 0.2254 |
| 79762 | C1orf115 | S027 | Human | Liver | HCC | 4.24e-08 | 3.91e-01 | 0.2446 |
| 79762 | C1orf115 | S028 | Human | Liver | HCC | 7.36e-15 | 5.63e-01 | 0.2503 |
| 79762 | C1orf115 | S029 | Human | Liver | HCC | 2.08e-14 | 5.16e-01 | 0.2581 |
| 79762 | C1orf115 | male-WTA | Human | Thyroid | PTC | 5.68e-49 | 6.55e-01 | 0.1037 |
| 79762 | C1orf115 | PTC01 | Human | Thyroid | PTC | 1.25e-13 | 4.42e-01 | 0.1899 |
| 79762 | C1orf115 | PTC04 | Human | Thyroid | PTC | 5.78e-14 | 3.38e-01 | 0.1927 |
| Page: 1 2 |
| Tissue | Expression Dynamics | Abbreviation |
| Colorectum (GSE201348) |  | FAP: Familial adenomatous polyposis |
| CRC: Colorectal cancer | ||
| Colorectum (HTA11) |  | AD: Adenomas |
| SER: Sessile serrated lesions | ||
| MSI-H: Microsatellite-high colorectal cancer | ||
| MSS: Microsatellite stable colorectal cancer | ||
| Liver | 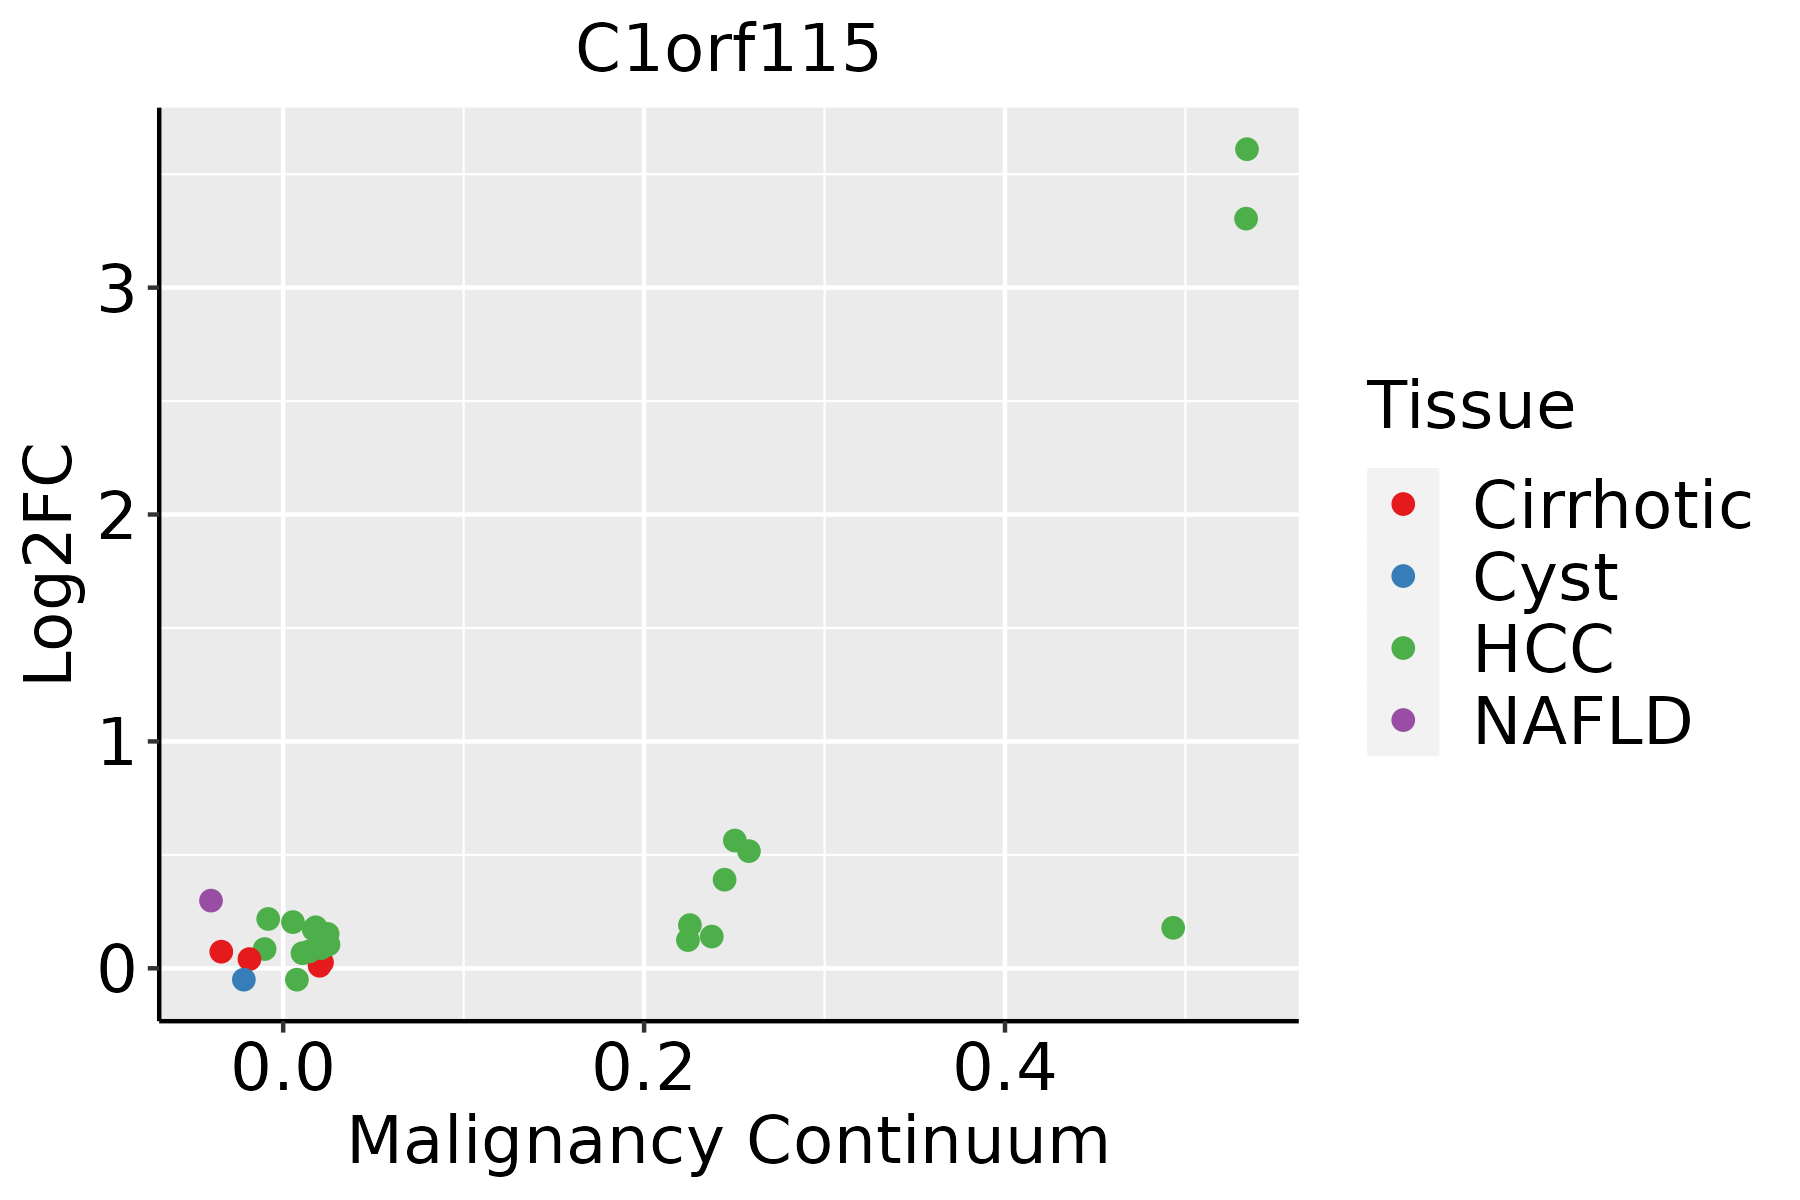 | HCC: Hepatocellular carcinoma |
| NAFLD: Non-alcoholic fatty liver disease | ||
| Prostate | 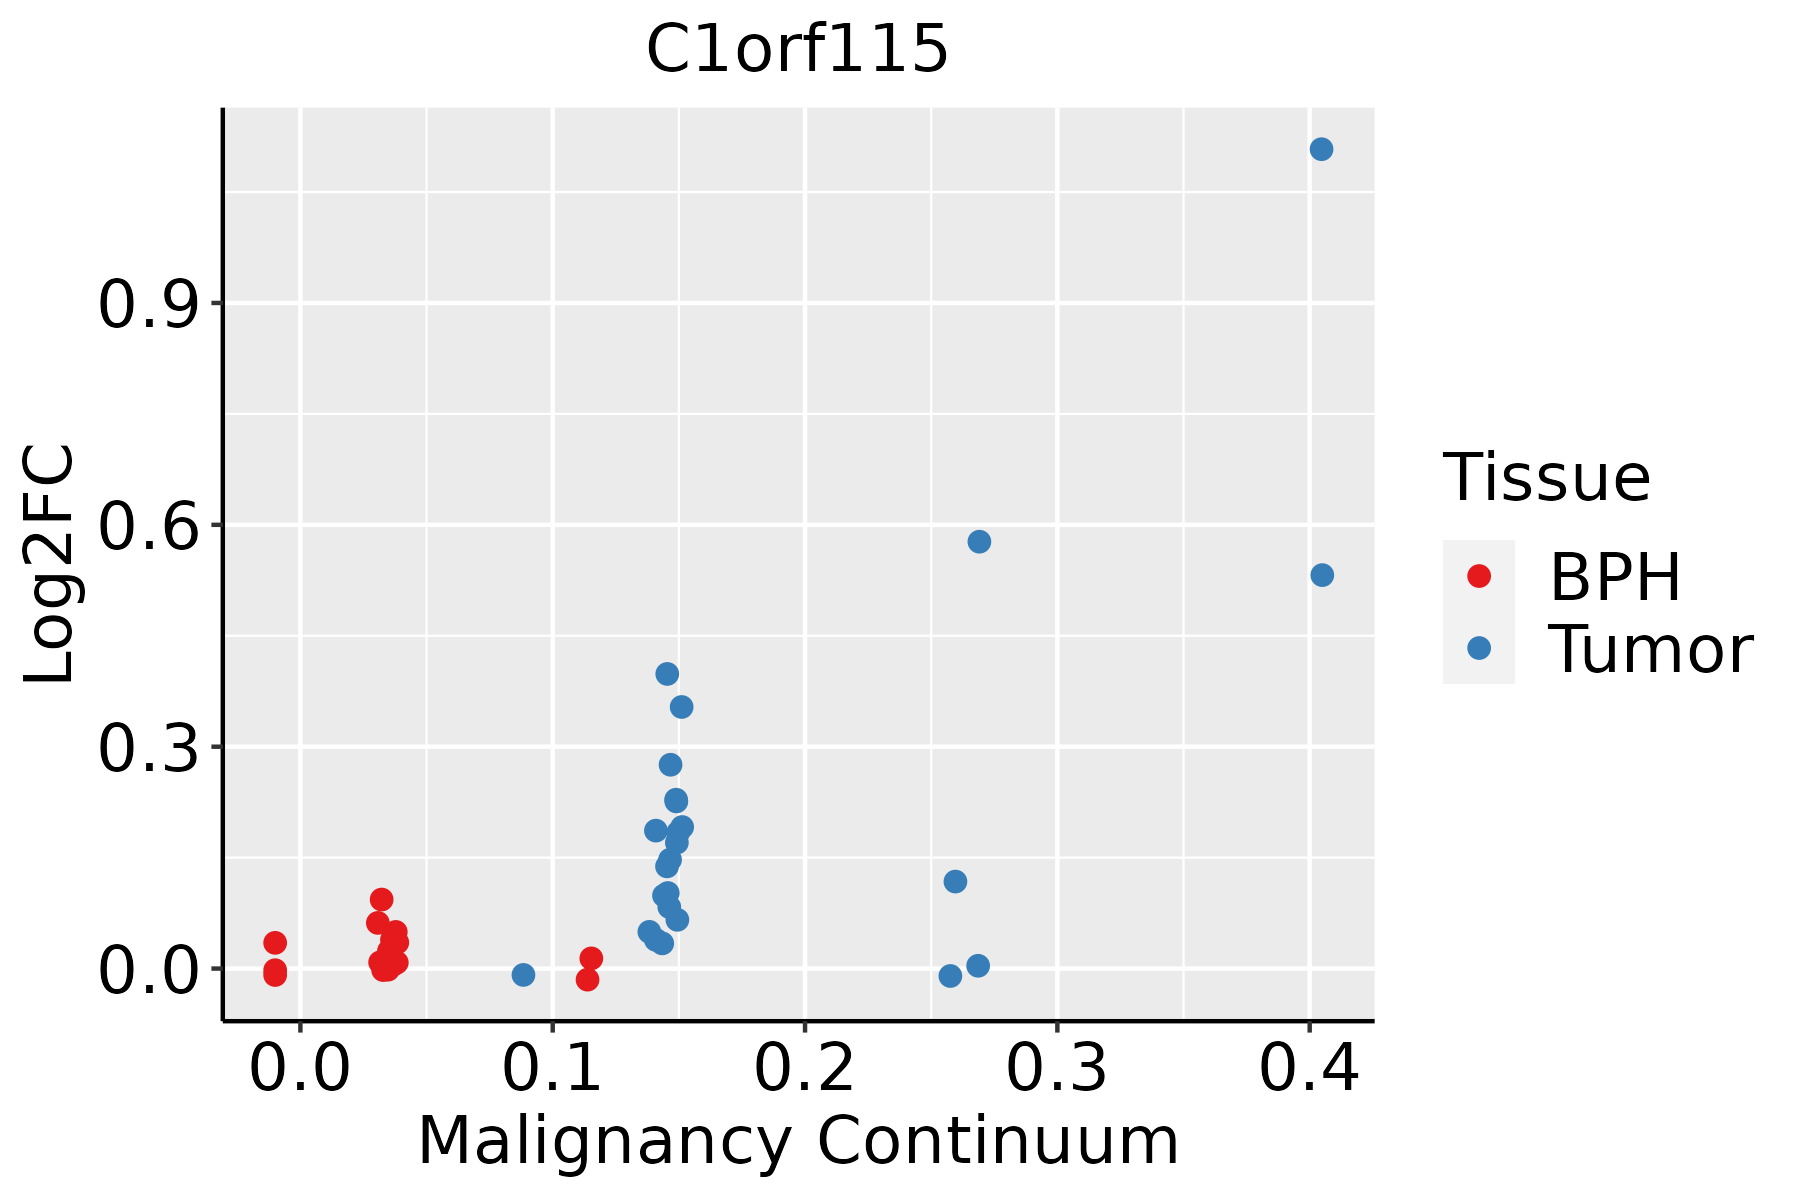 | BPH: Benign Prostatic Hyperplasia |
| Thyroid |  | ATC: Anaplastic thyroid cancer |
| HT: Hashimoto's thyroiditis | ||
| PTC: Papillary thyroid cancer |
| ∗log2FC in expression of this searched gene in stem-like cells from each diseased tissue sample relative to stem-like cells in normal samples in each tissue plotted against the malignancy continuum. Samples are colored based on if they are from different disease stage. |
Top |
Malignant transformation related pathway analysis |
| Find out the enriched GO biological processes and KEGG pathways involved in transition from healthy to precancer to cancer |
| Tissue | Disease Stage | Enriched GO biological Processes |
| Colorectum | AD |  |
| Colorectum | SER |  |
| Colorectum | MSS |  |
| Colorectum | MSI-H |  |
| Colorectum | FAP |  |
| ∗Top 15 enriched GO BP terms are showed in the bar plot of each disease state in each tissue. Each row represents a significant GO biological process which is colored according to the -log10(p.adjust). |
| Page: 1 2 3 4 5 6 7 8 9 |
| GO ID | Tissue | Disease Stage | Description | Gene Ratio | Bg Ratio | pvalue | p.adjust | Count |
| Page: 1 |
| Pathway ID | Tissue | Disease Stage | Description | Gene Ratio | Bg Ratio | pvalue | p.adjust | qvalue | Count |
| Page: 1 |
Top |
Cell-cell communication analysis |
| Identification of potential cell-cell interactions between two cell types and their ligand-receptor pairs for different disease states |
| Ligand | Receptor | LRpair | Pathway | Tissue | Disease Stage |
| Page: 1 |
Top |
Single-cell gene regulatory network inference analysis |
| Find out the significant the regulons (TFs) and the target genes of each regulon across cell types for different disease states |
| TF | Cell Type | Tissue | Disease Stage | Target Gene | RSS | Regulon Activity |
| ∗The dot plots of a searched regulon are shown for all cell subpopulations in each disease state of each tissue based on the regulon specific score inferred using pySCENIC and by calculating the average expression. |
| Page: 1 |
Top |
Somatic mutation of malignant transformation related genes |
| Annotation of somatic variants for genes involved in malignant transformation |
| Hugo Symbol | Variant Class | Variant Classification | dbSNP RS | HGVSc | HGVSp | HGVSp Short | SWISSPROT | BIOTYPE | SIFT | PolyPhen | Tumor Sample Barcode | Tissue | Histology | Sex | Age | Stage | Therapy Types | Drugs | Outcome |
| C1orf115 | SNV | Missense_Mutation | rs763165764 | c.316G>A | p.Gly106Arg | p.G106R | Q9H7X2 | protein_coding | tolerated(0.06) | probably_damaging(0.994) | TCGA-D8-A1X5-01 | Breast | breast invasive carcinoma | Female | >=65 | III/IV | Hormone Therapy | tamoxiphen | SD |
| C1orf115 | SNV | Missense_Mutation | c.36N>C | p.Glu12Asp | p.E12D | Q9H7X2 | protein_coding | tolerated(0.55) | benign(0) | TCGA-HM-A4S6-01 | Cervix | cervical & endocervical cancer | Female | <65 | III/IV | Chemotherapy | cisplatin | CR | |
| C1orf115 | SNV | Missense_Mutation | rs753438102 | c.340N>T | p.Arg114Cys | p.R114C | Q9H7X2 | protein_coding | deleterious(0.03) | possibly_damaging(0.855) | TCGA-A6-2672-01 | Colorectum | colon adenocarcinoma | Female | >=65 | III/IV | Unknown | Unknown | SD |
| C1orf115 | SNV | Missense_Mutation | c.323N>C | p.Val108Ala | p.V108A | Q9H7X2 | protein_coding | tolerated(0.5) | benign(0.009) | TCGA-AZ-6598-01 | Colorectum | colon adenocarcinoma | Female | >=65 | I/II | Unknown | Unknown | SD | |
| C1orf115 | SNV | Missense_Mutation | c.302N>G | p.Tyr101Cys | p.Y101C | Q9H7X2 | protein_coding | tolerated(0.15) | probably_damaging(0.976) | TCGA-CK-5916-01 | Colorectum | colon adenocarcinoma | Female | >=65 | I/II | Unknown | Unknown | PD | |
| C1orf115 | SNV | Missense_Mutation | rs774058620 | c.385N>A | p.Ala129Thr | p.A129T | Q9H7X2 | protein_coding | tolerated(0.31) | possibly_damaging(0.573) | TCGA-F4-6570-01 | Colorectum | colon adenocarcinoma | Female | >=65 | I/II | Unknown | Unknown | SD |
| C1orf115 | SNV | Missense_Mutation | c.316N>T | p.Gly106Trp | p.G106W | Q9H7X2 | protein_coding | deleterious(0) | probably_damaging(0.999) | TCGA-CN-6010-01 | Oral cavity | head & neck squamous cell carcinoma | Male | <65 | I/II | Chemotherapy | cisplatin | PD | |
| C1orf115 | SNV | Missense_Mutation | rs763165764 | c.316N>A | p.Gly106Arg | p.G106R | Q9H7X2 | protein_coding | tolerated(0.06) | probably_damaging(0.994) | TCGA-F1-6874-01 | Stomach | stomach adenocarcinoma | Male | >=65 | I/II | Unknown | Unknown | SD |
| C1orf115 | SNV | Missense_Mutation | c.350T>C | p.Val117Ala | p.V117A | Q9H7X2 | protein_coding | tolerated(0.06) | possibly_damaging(0.655) | TCGA-HU-A4H4-01 | Stomach | stomach adenocarcinoma | Female | <65 | I/II | Chemotherapy | ts-1 | CR |
| Page: 1 |
Top |
Related drugs of malignant transformation related genes |
| Identification of chemicals and drugs interact with genes involved in malignant transfromation |
| (DGIdb 4.0) |
| Entrez ID | Symbol | Category | Interaction Types | Drug Claim Name | Drug Name | PMIDs |
| Page: 1 |

Copyright 2023-Present -The University of Texas Health Science Center at Houston |