
|
|||||
|
 | |
| |
| |
| |
| |
| |
|
Gene: C1RL |
Gene summary for C1RL |
| Gene information | Species | Human | Gene symbol | C1RL | Gene ID | 51279 |
| Gene name | complement C1r subcomponent like | |
| Gene Alias | C1RL1 | |
| Cytomap | 12p13.31 | |
| Gene Type | protein-coding | GO ID | GO:0002250 | UniProtAcc | Q9NZP8 |
Top |
Malignant transformation analysis |
| Identification of the aberrant gene expression in precancerous and cancerous lesions by comparing the gene expression of stem-like cells in diseased tissues with normal stem cells |
| Entrez ID | Symbol | Replicates | Species | Organ | Tissue | Adj P-value | Log2FC | Malignancy |
| 51279 | C1RL | LZE4T | Human | Esophagus | ESCC | 8.92e-03 | 1.43e-01 | 0.0811 |
| 51279 | C1RL | LZE8T | Human | Esophagus | ESCC | 1.72e-09 | 3.64e-01 | 0.067 |
| 51279 | C1RL | LZE20T | Human | Esophagus | ESCC | 3.70e-04 | 8.53e-02 | 0.0662 |
| 51279 | C1RL | LZE22T | Human | Esophagus | ESCC | 1.12e-02 | 1.72e-01 | 0.068 |
| 51279 | C1RL | LZE24T | Human | Esophagus | ESCC | 1.02e-06 | 1.80e-01 | 0.0596 |
| 51279 | C1RL | LZE6T | Human | Esophagus | ESCC | 4.19e-02 | 2.02e-01 | 0.0845 |
| 51279 | C1RL | P1T-E | Human | Esophagus | ESCC | 1.49e-03 | 3.03e-01 | 0.0875 |
| 51279 | C1RL | P2T-E | Human | Esophagus | ESCC | 2.07e-45 | 7.30e-01 | 0.1177 |
| 51279 | C1RL | P4T-E | Human | Esophagus | ESCC | 5.15e-08 | 2.90e-01 | 0.1323 |
| 51279 | C1RL | P5T-E | Human | Esophagus | ESCC | 1.40e-10 | 1.09e-01 | 0.1327 |
| 51279 | C1RL | P8T-E | Human | Esophagus | ESCC | 1.46e-23 | 4.43e-01 | 0.0889 |
| 51279 | C1RL | P9T-E | Human | Esophagus | ESCC | 1.25e-14 | 3.73e-01 | 0.1131 |
| 51279 | C1RL | P10T-E | Human | Esophagus | ESCC | 1.85e-18 | 1.31e-01 | 0.116 |
| 51279 | C1RL | P11T-E | Human | Esophagus | ESCC | 5.44e-06 | 2.29e-01 | 0.1426 |
| 51279 | C1RL | P12T-E | Human | Esophagus | ESCC | 9.63e-28 | 3.98e-01 | 0.1122 |
| 51279 | C1RL | P15T-E | Human | Esophagus | ESCC | 4.54e-12 | 2.92e-01 | 0.1149 |
| 51279 | C1RL | P16T-E | Human | Esophagus | ESCC | 6.87e-75 | 1.36e+00 | 0.1153 |
| 51279 | C1RL | P17T-E | Human | Esophagus | ESCC | 1.78e-03 | 3.08e-01 | 0.1278 |
| 51279 | C1RL | P19T-E | Human | Esophagus | ESCC | 8.72e-05 | 3.84e-01 | 0.1662 |
| 51279 | C1RL | P20T-E | Human | Esophagus | ESCC | 2.17e-10 | 3.48e-01 | 0.1124 |
| Page: 1 2 3 4 5 |
| Tissue | Expression Dynamics | Abbreviation |
| Esophagus | 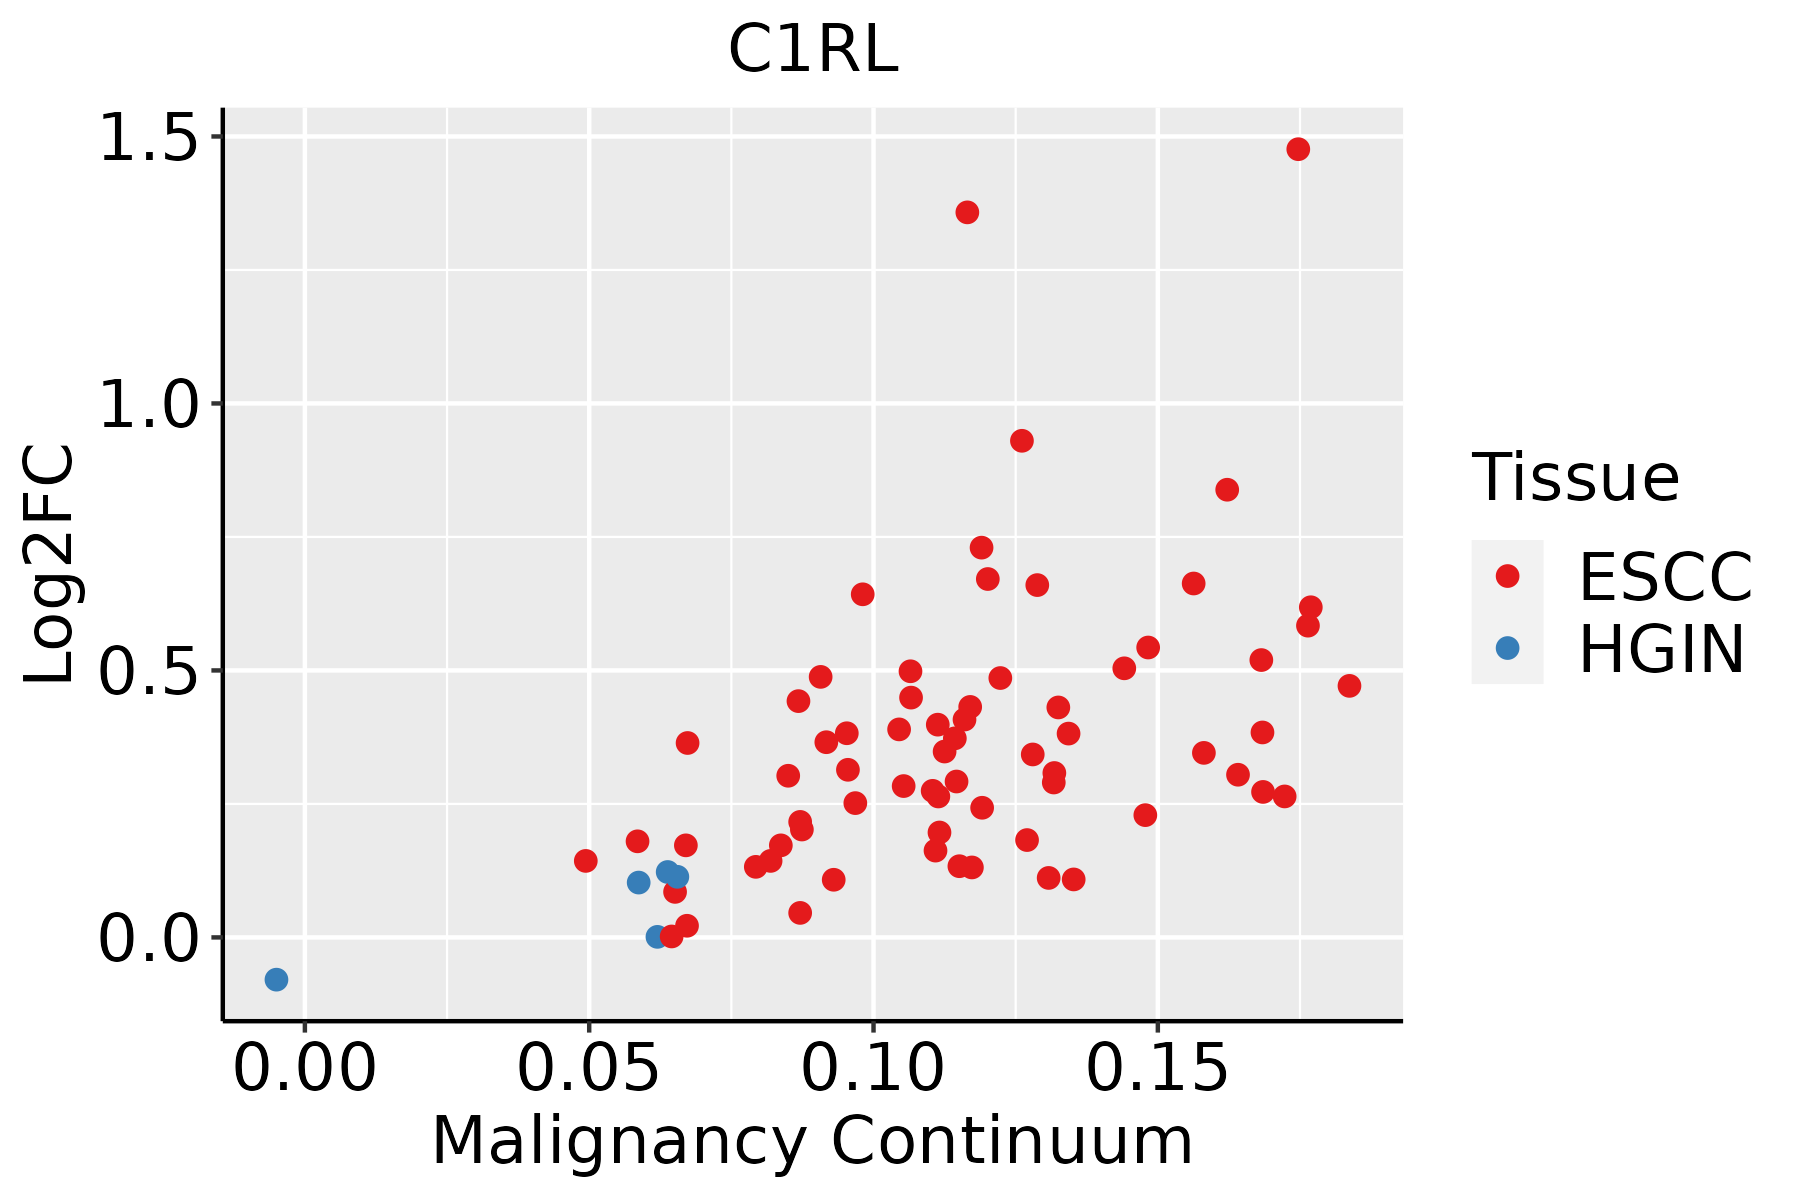 | ESCC: Esophageal squamous cell carcinoma |
| HGIN: High-grade intraepithelial neoplasias | ||
| LGIN: Low-grade intraepithelial neoplasias | ||
| Liver | 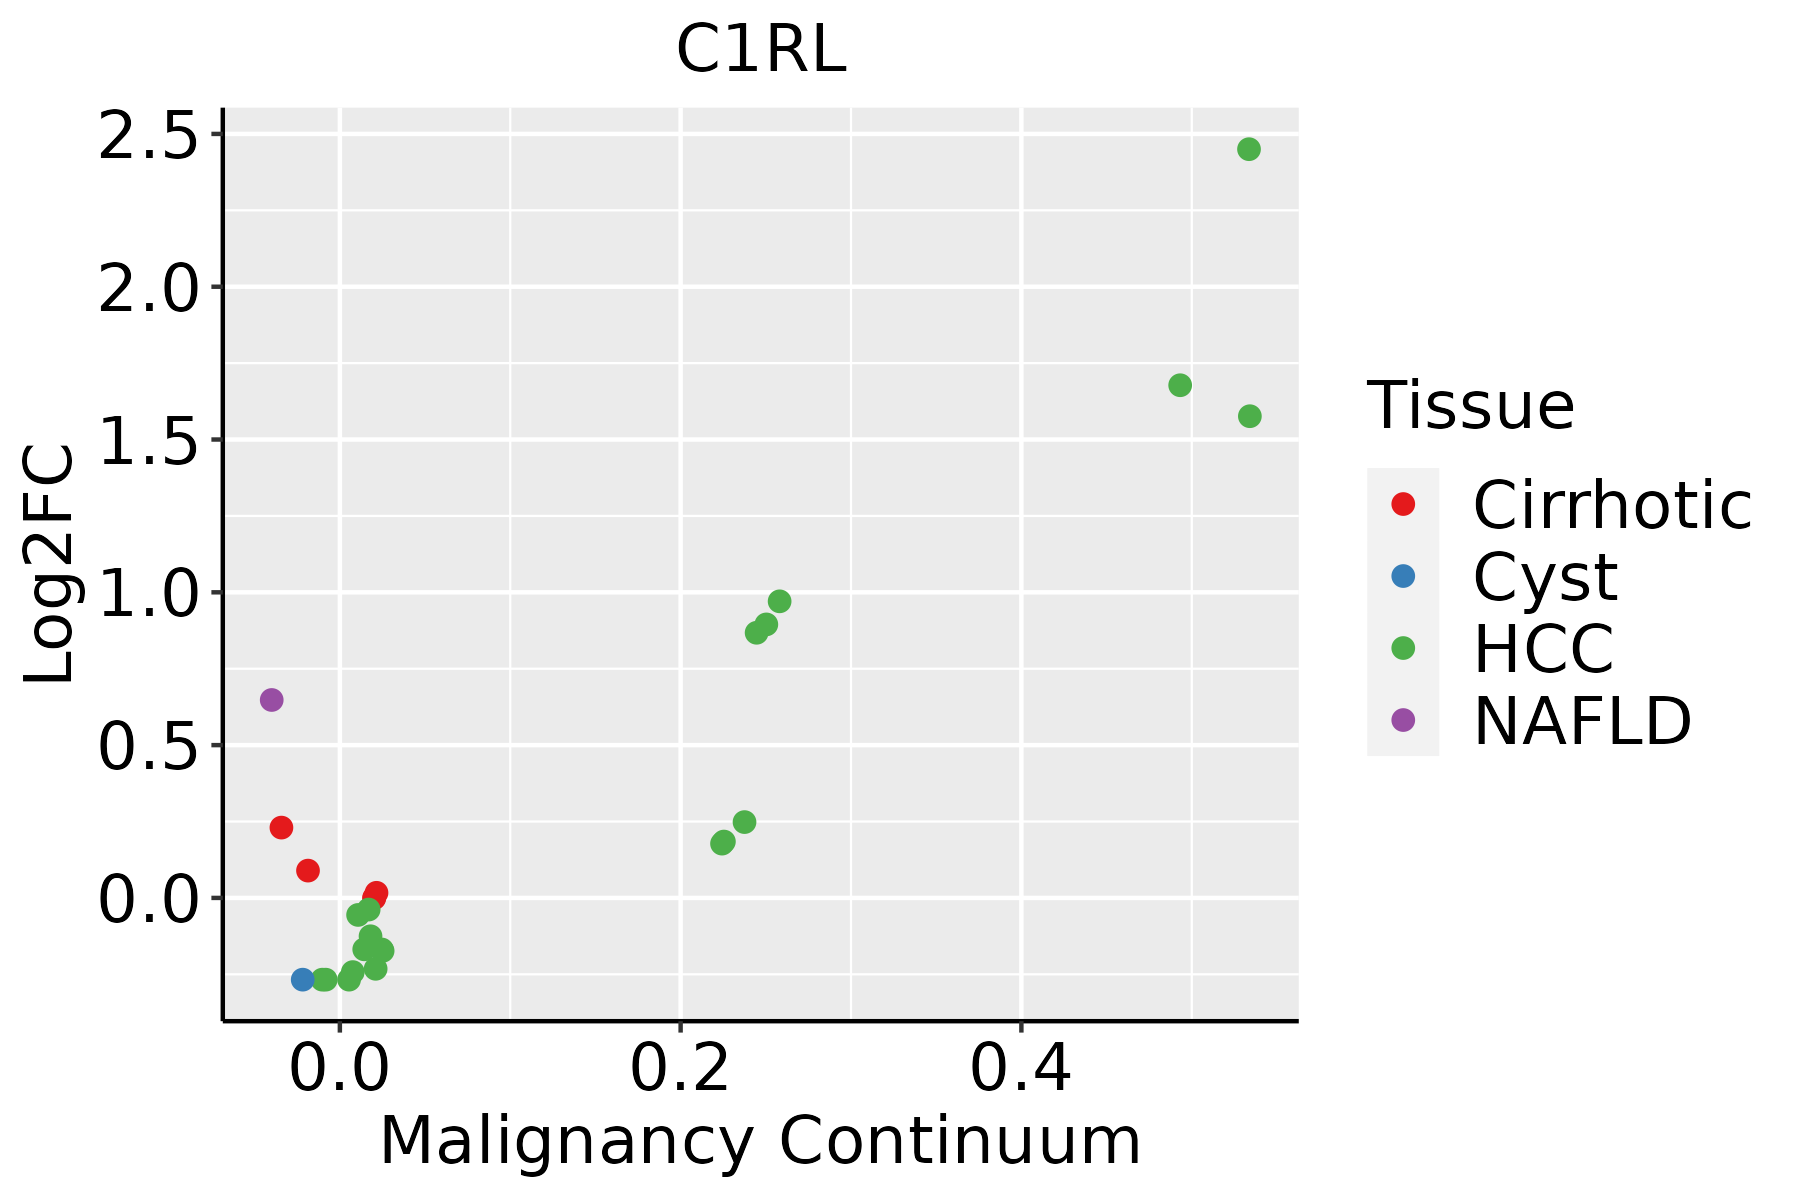 | HCC: Hepatocellular carcinoma |
| NAFLD: Non-alcoholic fatty liver disease | ||
| Oral Cavity |  | EOLP: Erosive Oral lichen planus |
| LP: leukoplakia | ||
| NEOLP: Non-erosive oral lichen planus | ||
| OSCC: Oral squamous cell carcinoma |
| ∗log2FC in expression of this searched gene in stem-like cells from each diseased tissue sample relative to stem-like cells in normal samples in each tissue plotted against the malignancy continuum. Samples are colored based on if they are from different disease stage. |
Top |
Malignant transformation related pathway analysis |
| Find out the enriched GO biological processes and KEGG pathways involved in transition from healthy to precancer to cancer |
| Tissue | Disease Stage | Enriched GO biological Processes |
| Colorectum | AD |  |
| Colorectum | SER |  |
| Colorectum | MSS |  |
| Colorectum | MSI-H |  |
| Colorectum | FAP |  |
| ∗Top 15 enriched GO BP terms are showed in the bar plot of each disease state in each tissue. Each row represents a significant GO biological process which is colored according to the -log10(p.adjust). |
| Page: 1 2 3 4 5 6 7 8 9 |
| GO ID | Tissue | Disease Stage | Description | Gene Ratio | Bg Ratio | pvalue | p.adjust | Count |
| GO:005160418 | Esophagus | ESCC | protein maturation | 189/8552 | 294/18723 | 7.64e-11 | 2.39e-09 | 189 |
| GO:001648514 | Esophagus | ESCC | protein processing | 134/8552 | 225/18723 | 1.81e-05 | 1.60e-04 | 134 |
| GO:0031638 | Liver | NAFLD | zymogen activation | 16/1882 | 60/18723 | 2.08e-04 | 3.60e-03 | 16 |
| GO:00516046 | Liver | Cirrhotic | protein maturation | 121/4634 | 294/18723 | 3.54e-10 | 1.68e-08 | 121 |
| GO:00316381 | Liver | Cirrhotic | zymogen activation | 31/4634 | 60/18723 | 6.48e-06 | 1.02e-04 | 31 |
| GO:00164853 | Liver | Cirrhotic | protein processing | 85/4634 | 225/18723 | 9.01e-06 | 1.32e-04 | 85 |
| GO:005160412 | Liver | HCC | protein maturation | 171/7958 | 294/18723 | 3.80e-08 | 8.30e-07 | 171 |
| GO:001648511 | Liver | HCC | protein processing | 121/7958 | 225/18723 | 4.01e-04 | 2.71e-03 | 121 |
| GO:00316382 | Liver | HCC | zymogen activation | 38/7958 | 60/18723 | 9.06e-04 | 5.33e-03 | 38 |
| GO:005160410 | Oral cavity | OSCC | protein maturation | 170/7305 | 294/18723 | 3.97e-11 | 1.28e-09 | 170 |
| GO:00164856 | Oral cavity | OSCC | protein processing | 121/7305 | 225/18723 | 4.56e-06 | 5.23e-05 | 121 |
| GO:005160432 | Oral cavity | NEOLP | protein maturation | 50/2005 | 294/18723 | 6.46e-04 | 5.47e-03 | 50 |
| GO:001648521 | Oral cavity | NEOLP | protein processing | 39/2005 | 225/18723 | 1.68e-03 | 1.17e-02 | 39 |
| GO:000225313 | Oral cavity | NEOLP | activation of immune response | 55/2005 | 375/18723 | 9.87e-03 | 4.62e-02 | 55 |
| Page: 1 |
| Pathway ID | Tissue | Disease Stage | Description | Gene Ratio | Bg Ratio | pvalue | p.adjust | qvalue | Count |
| Page: 1 |
Top |
Cell-cell communication analysis |
| Identification of potential cell-cell interactions between two cell types and their ligand-receptor pairs for different disease states |
| Ligand | Receptor | LRpair | Pathway | Tissue | Disease Stage |
| Page: 1 |
Top |
Single-cell gene regulatory network inference analysis |
| Find out the significant the regulons (TFs) and the target genes of each regulon across cell types for different disease states |
| TF | Cell Type | Tissue | Disease Stage | Target Gene | RSS | Regulon Activity |
| ∗The dot plots of a searched regulon are shown for all cell subpopulations in each disease state of each tissue based on the regulon specific score inferred using pySCENIC and by calculating the average expression. |
| Page: 1 |
Top |
Somatic mutation of malignant transformation related genes |
| Annotation of somatic variants for genes involved in malignant transformation |
| Hugo Symbol | Variant Class | Variant Classification | dbSNP RS | HGVSc | HGVSp | HGVSp Short | SWISSPROT | BIOTYPE | SIFT | PolyPhen | Tumor Sample Barcode | Tissue | Histology | Sex | Age | Stage | Therapy Types | Drugs | Outcome |
| C1RL | SNV | Missense_Mutation | novel | c.1286N>G | p.His429Arg | p.H429R | Q9NZP8 | protein_coding | tolerated(0.1) | benign(0.012) | TCGA-AN-A046-01 | Breast | breast invasive carcinoma | Female | >=65 | I/II | Unknown | Unknown | SD |
| C1RL | SNV | Missense_Mutation | novel | c.681G>T | p.Gln227His | p.Q227H | Q9NZP8 | protein_coding | tolerated(0.23) | benign(0.003) | TCGA-D8-A1X5-01 | Breast | breast invasive carcinoma | Female | >=65 | III/IV | Hormone Therapy | tamoxiphen | SD |
| C1RL | SNV | Missense_Mutation | c.1090N>A | p.Glu364Lys | p.E364K | Q9NZP8 | protein_coding | tolerated(0.09) | possibly_damaging(0.752) | TCGA-D8-A27G-01 | Breast | breast invasive carcinoma | Female | >=65 | I/II | Unknown | Unknown | SD | |
| C1RL | SNV | Missense_Mutation | novel | c.121N>C | p.Ser41Pro | p.S41P | Q9NZP8 | protein_coding | deleterious(0.02) | probably_damaging(0.984) | TCGA-E9-A1R5-01 | Breast | breast invasive carcinoma | Female | <65 | I/II | Hormone Therapy | tamoxiphen | SD |
| C1RL | SNV | Missense_Mutation | novel | c.836T>G | p.Leu279Arg | p.L279R | Q9NZP8 | protein_coding | deleterious(0) | probably_damaging(0.997) | TCGA-OL-A6VQ-01 | Breast | breast invasive carcinoma | Female | <65 | I/II | Unknown | Unknown | SD |
| C1RL | SNV | Missense_Mutation | rs771340998 | c.1277N>T | p.Thr426Met | p.T426M | Q9NZP8 | protein_coding | tolerated(0.44) | benign(0.044) | TCGA-2W-A8YY-01 | Cervix | cervical & endocervical cancer | Female | <65 | I/II | Chemotherapy | cisplatin | CR |
| C1RL | SNV | Missense_Mutation | novel | c.661G>A | p.Asp221Asn | p.D221N | Q9NZP8 | protein_coding | tolerated(0.35) | benign(0.001) | TCGA-C5-A901-01 | Cervix | cervical & endocervical cancer | Female | <65 | I/II | Unknown | Unknown | SD |
| C1RL | SNV | Missense_Mutation | rs758559770 | c.1141N>C | p.Glu381Gln | p.E381Q | Q9NZP8 | protein_coding | tolerated(0.11) | benign(0.117) | TCGA-EK-A3GK-01 | Cervix | cervical & endocervical cancer | Female | <65 | I/II | Unknown | Unknown | SD |
| C1RL | SNV | Missense_Mutation | c.739N>T | p.Gly247Cys | p.G247C | Q9NZP8 | protein_coding | deleterious(0) | probably_damaging(0.978) | TCGA-CM-5860-01 | Colorectum | colon adenocarcinoma | Male | <65 | I/II | Ancillary | leucovorin | SD | |
| C1RL | SNV | Missense_Mutation | rs753114917 | c.1319N>G | p.Tyr440Cys | p.Y440C | Q9NZP8 | protein_coding | deleterious(0) | probably_damaging(0.95) | TCGA-F4-6703-01 | Colorectum | colon adenocarcinoma | Male | <65 | I/II | Unknown | Unknown | SD |
| Page: 1 2 3 4 5 |
Top |
Related drugs of malignant transformation related genes |
| Identification of chemicals and drugs interact with genes involved in malignant transfromation |
| (DGIdb 4.0) |
| Entrez ID | Symbol | Category | Interaction Types | Drug Claim Name | Drug Name | PMIDs |
| Page: 1 |

Copyright 2023-Present -The University of Texas Health Science Center at Houston |