
|
|||||
|
 | |
| |
| |
| |
| |
| |
|
Gene: C1R |
Gene summary for C1R |
| Gene information | Species | Human | Gene symbol | C1R | Gene ID | 715 |
| Gene name | complement C1r | |
| Gene Alias | EDSPD1 | |
| Cytomap | 12p13.31 | |
| Gene Type | protein-coding | GO ID | GO:0002250 | UniProtAcc | P00736 |
Top |
Malignant transformation analysis |
| Identification of the aberrant gene expression in precancerous and cancerous lesions by comparing the gene expression of stem-like cells in diseased tissues with normal stem cells |
| Entrez ID | Symbol | Replicates | Species | Organ | Tissue | Adj P-value | Log2FC | Malignancy |
| 715 | C1R | CA_HPV_1 | Human | Cervix | CC | 1.01e-07 | -2.85e-01 | 0.0264 |
| 715 | C1R | CA_HPV_3 | Human | Cervix | CC | 2.03e-04 | 1.99e-02 | 0.0414 |
| 715 | C1R | HSIL_HPV_1 | Human | Cervix | HSIL_HPV | 7.95e-03 | -2.67e-01 | 0.0116 |
| 715 | C1R | Tumor | Human | Cervix | CC | 1.84e-04 | 1.95e-01 | 0.1241 |
| 715 | C1R | sample1 | Human | Cervix | CC | 8.35e-19 | 7.78e-01 | 0.0959 |
| 715 | C1R | sample3 | Human | Cervix | CC | 1.06e-02 | 1.39e-01 | 0.1387 |
| 715 | C1R | L1 | Human | Cervix | CC | 1.92e-03 | -2.76e-01 | 0.0802 |
| 715 | C1R | T1 | Human | Cervix | CC | 3.92e-22 | 6.44e-01 | 0.0918 |
| 715 | C1R | AEH-subject1 | Human | Endometrium | AEH | 3.34e-13 | -4.03e-01 | -0.3059 |
| 715 | C1R | AEH-subject2 | Human | Endometrium | AEH | 8.20e-26 | -5.95e-01 | -0.2525 |
| 715 | C1R | AEH-subject3 | Human | Endometrium | AEH | 3.23e-24 | -5.37e-01 | -0.2576 |
| 715 | C1R | AEH-subject4 | Human | Endometrium | AEH | 2.41e-15 | -5.44e-01 | -0.2657 |
| 715 | C1R | AEH-subject5 | Human | Endometrium | AEH | 1.61e-35 | -6.20e-01 | -0.2953 |
| 715 | C1R | EEC-subject1 | Human | Endometrium | EEC | 1.32e-25 | -5.87e-01 | -0.2682 |
| 715 | C1R | EEC-subject2 | Human | Endometrium | EEC | 7.16e-20 | -4.51e-01 | -0.2607 |
| 715 | C1R | EEC-subject3 | Human | Endometrium | EEC | 6.29e-46 | -6.02e-01 | -0.2525 |
| 715 | C1R | EEC-subject4 | Human | Endometrium | EEC | 1.09e-16 | -4.82e-01 | -0.2571 |
| 715 | C1R | EEC-subject5 | Human | Endometrium | EEC | 6.25e-31 | -6.10e-01 | -0.249 |
| 715 | C1R | GSM5276935 | Human | Endometrium | EEC | 3.91e-22 | -5.60e-01 | -0.123 |
| 715 | C1R | GSM6177620_NYU_UCEC1_lib1_lib1 | Human | Endometrium | EEC | 4.63e-21 | -4.15e-01 | -0.1869 |
| Page: 1 2 3 4 5 6 7 8 |
| Tissue | Expression Dynamics | Abbreviation |
| Cervix |  | CC: Cervix cancer |
| HSIL_HPV: HPV-infected high-grade squamous intraepithelial lesions | ||
| N_HPV: HPV-infected normal cervix | ||
| Endometrium | 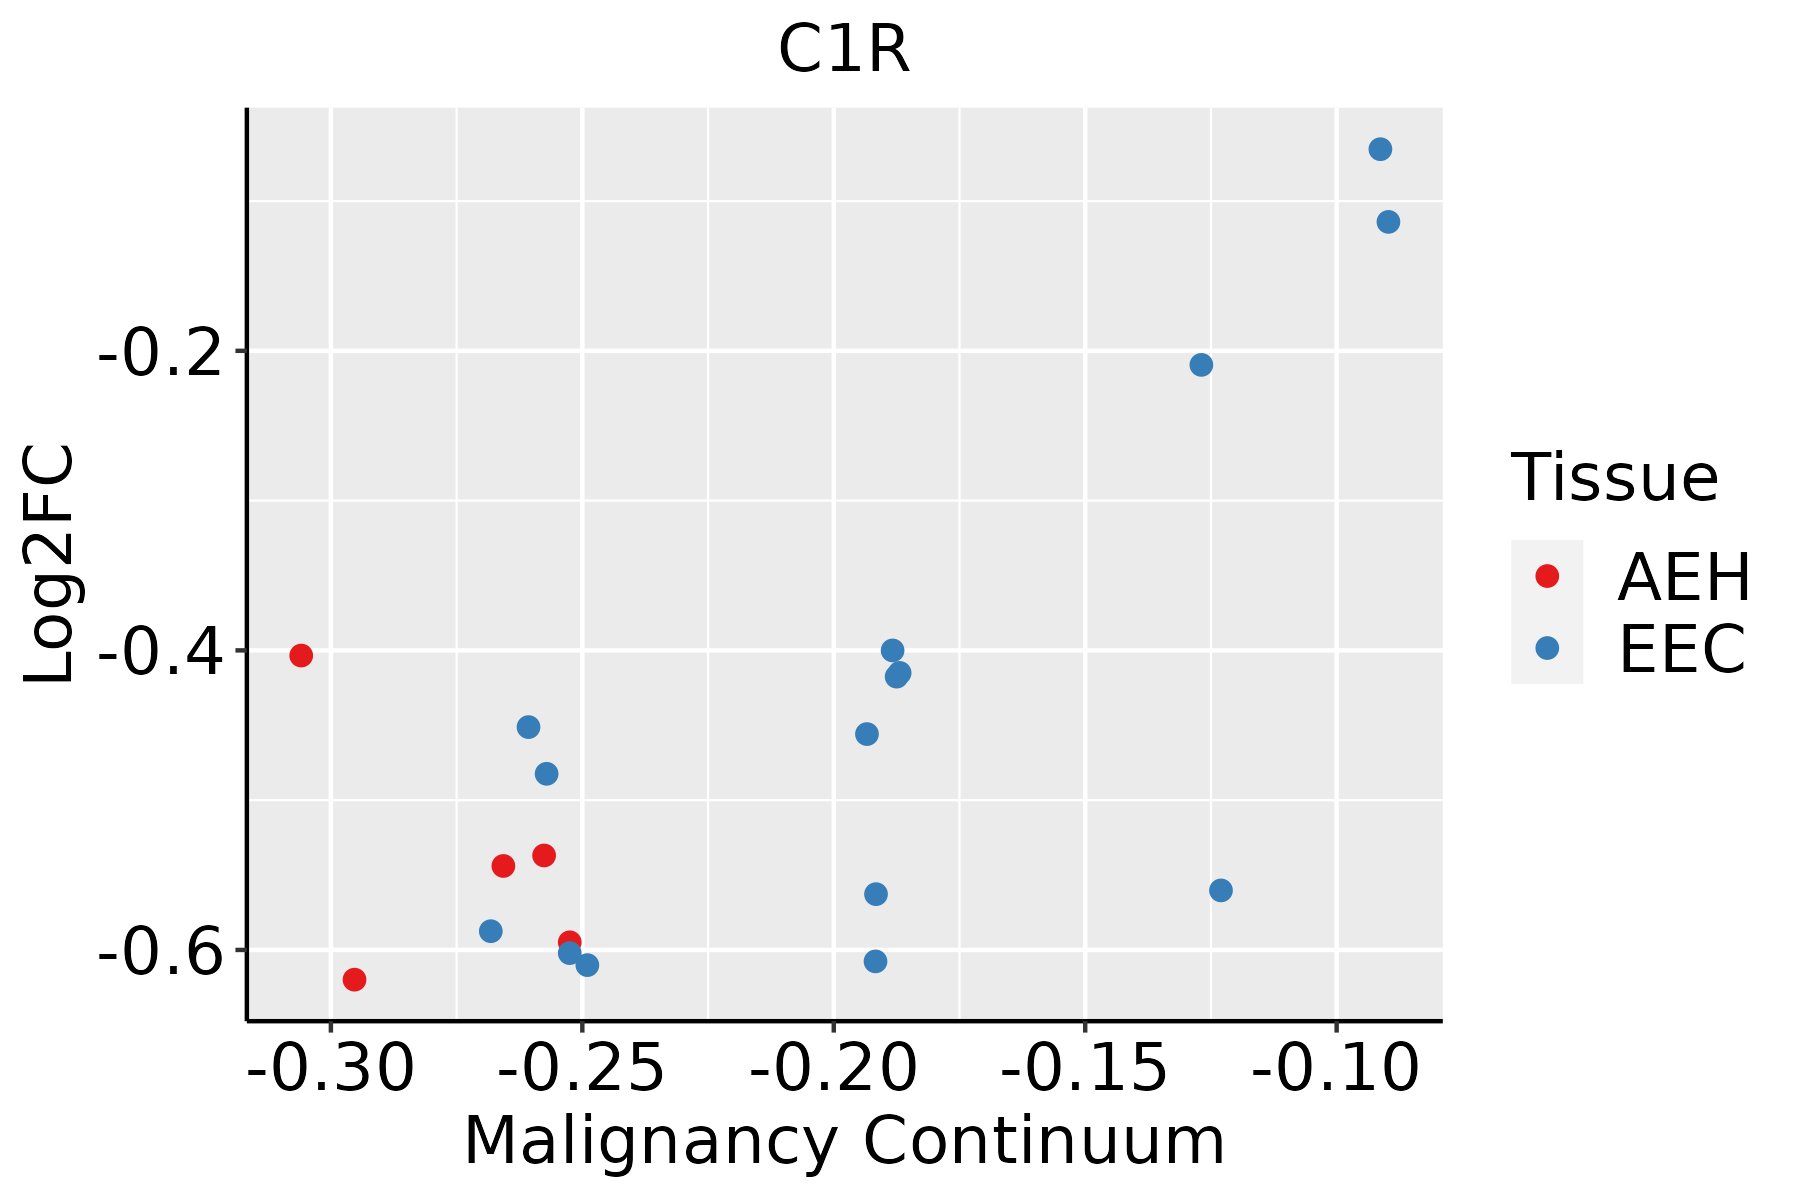 | AEH: Atypical endometrial hyperplasia |
| EEC: Endometrioid Cancer | ||
| Esophagus |  | ESCC: Esophageal squamous cell carcinoma |
| HGIN: High-grade intraepithelial neoplasias | ||
| LGIN: Low-grade intraepithelial neoplasias | ||
| Liver |  | HCC: Hepatocellular carcinoma |
| NAFLD: Non-alcoholic fatty liver disease | ||
| Oral Cavity | 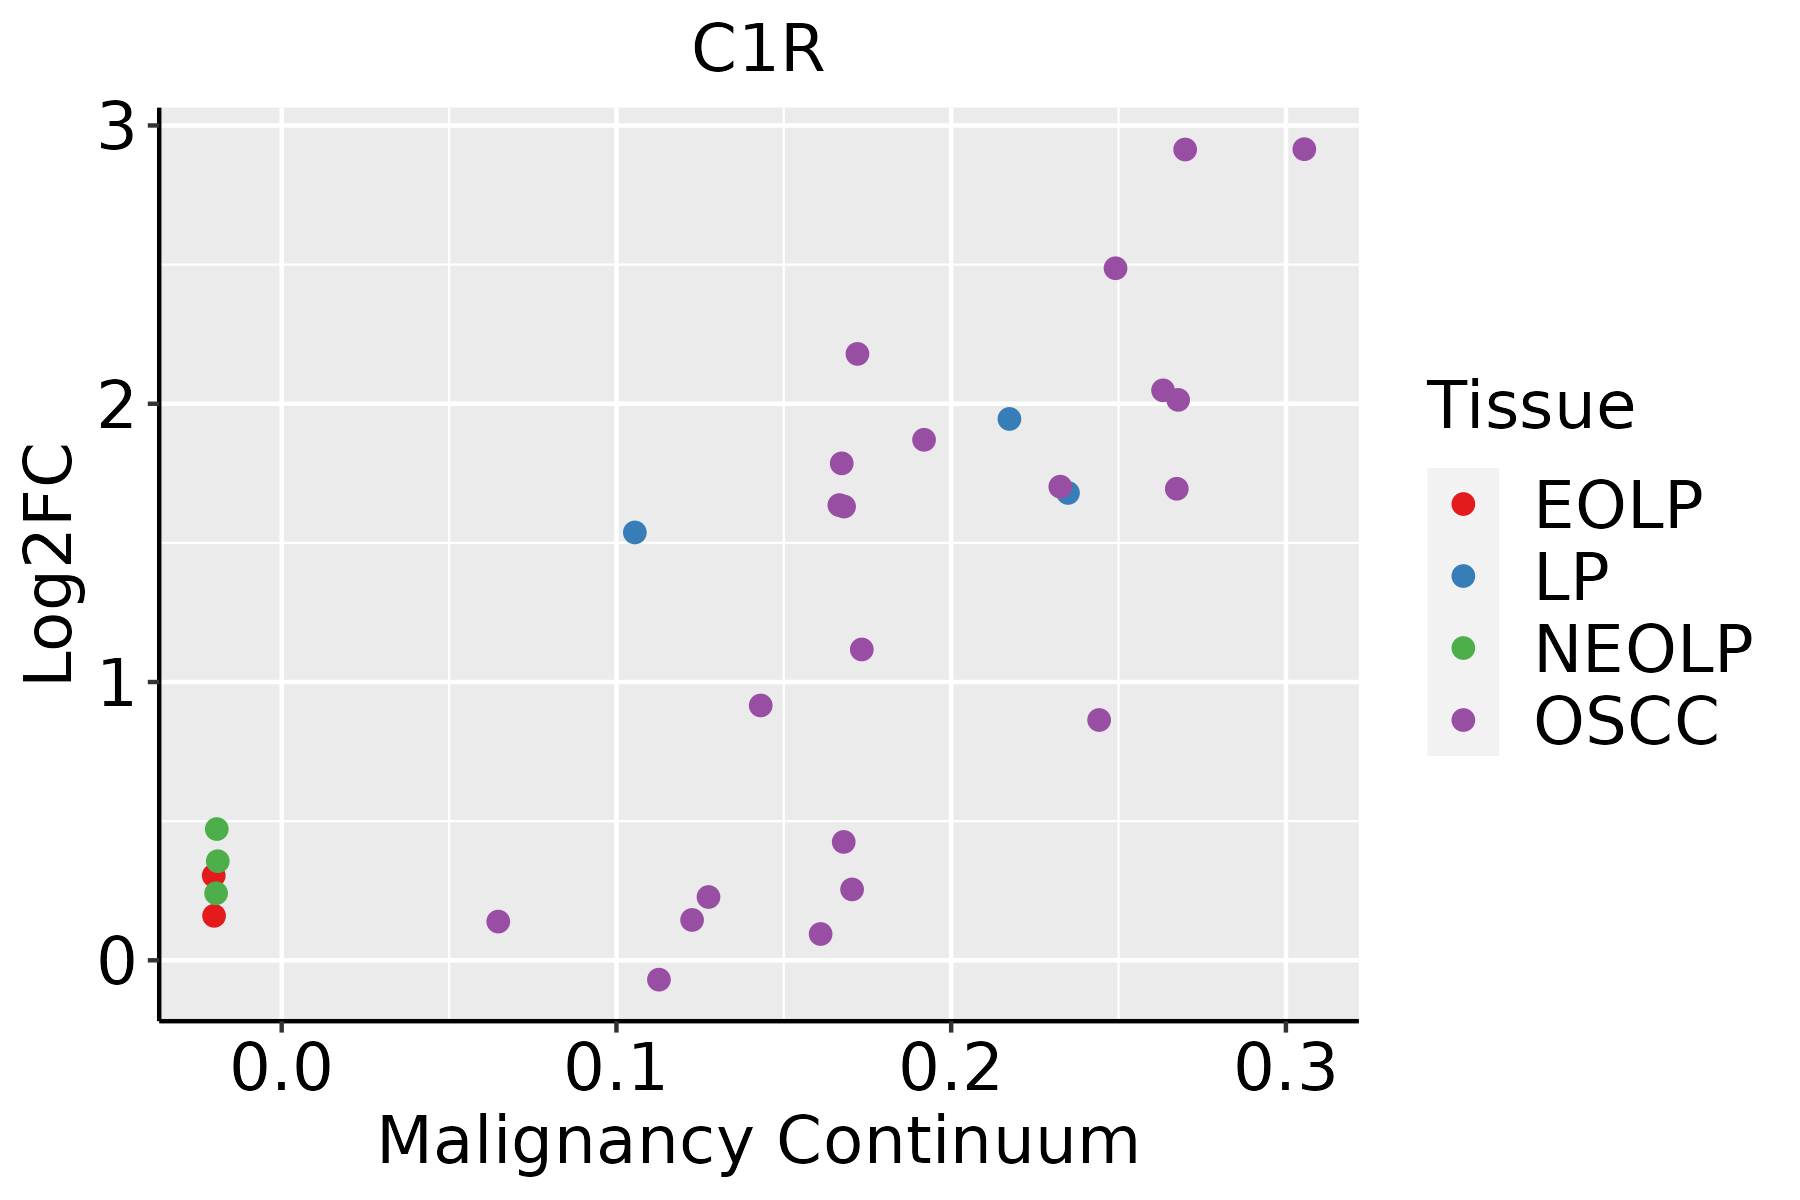 | EOLP: Erosive Oral lichen planus |
| LP: leukoplakia | ||
| NEOLP: Non-erosive oral lichen planus | ||
| OSCC: Oral squamous cell carcinoma | ||
| Prostate | 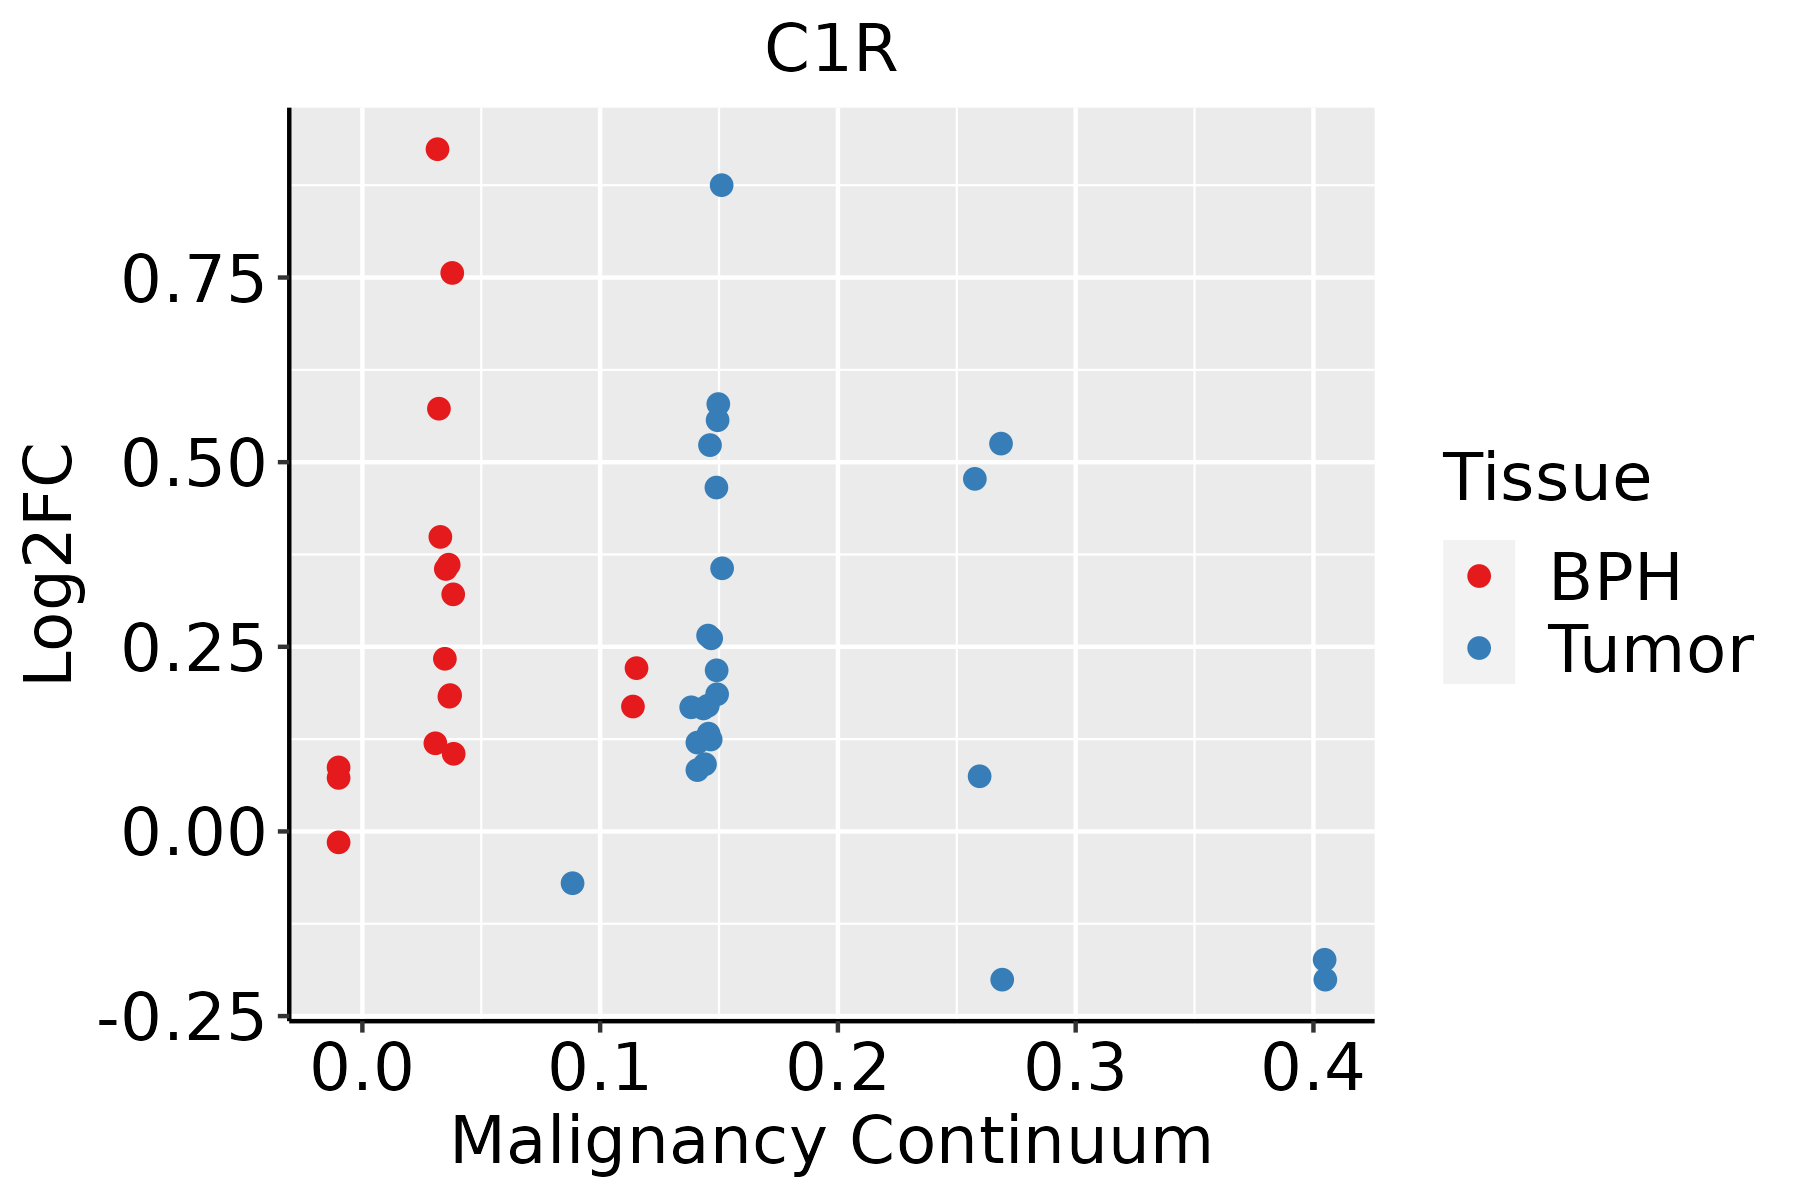 | BPH: Benign Prostatic Hyperplasia |
| Skin | 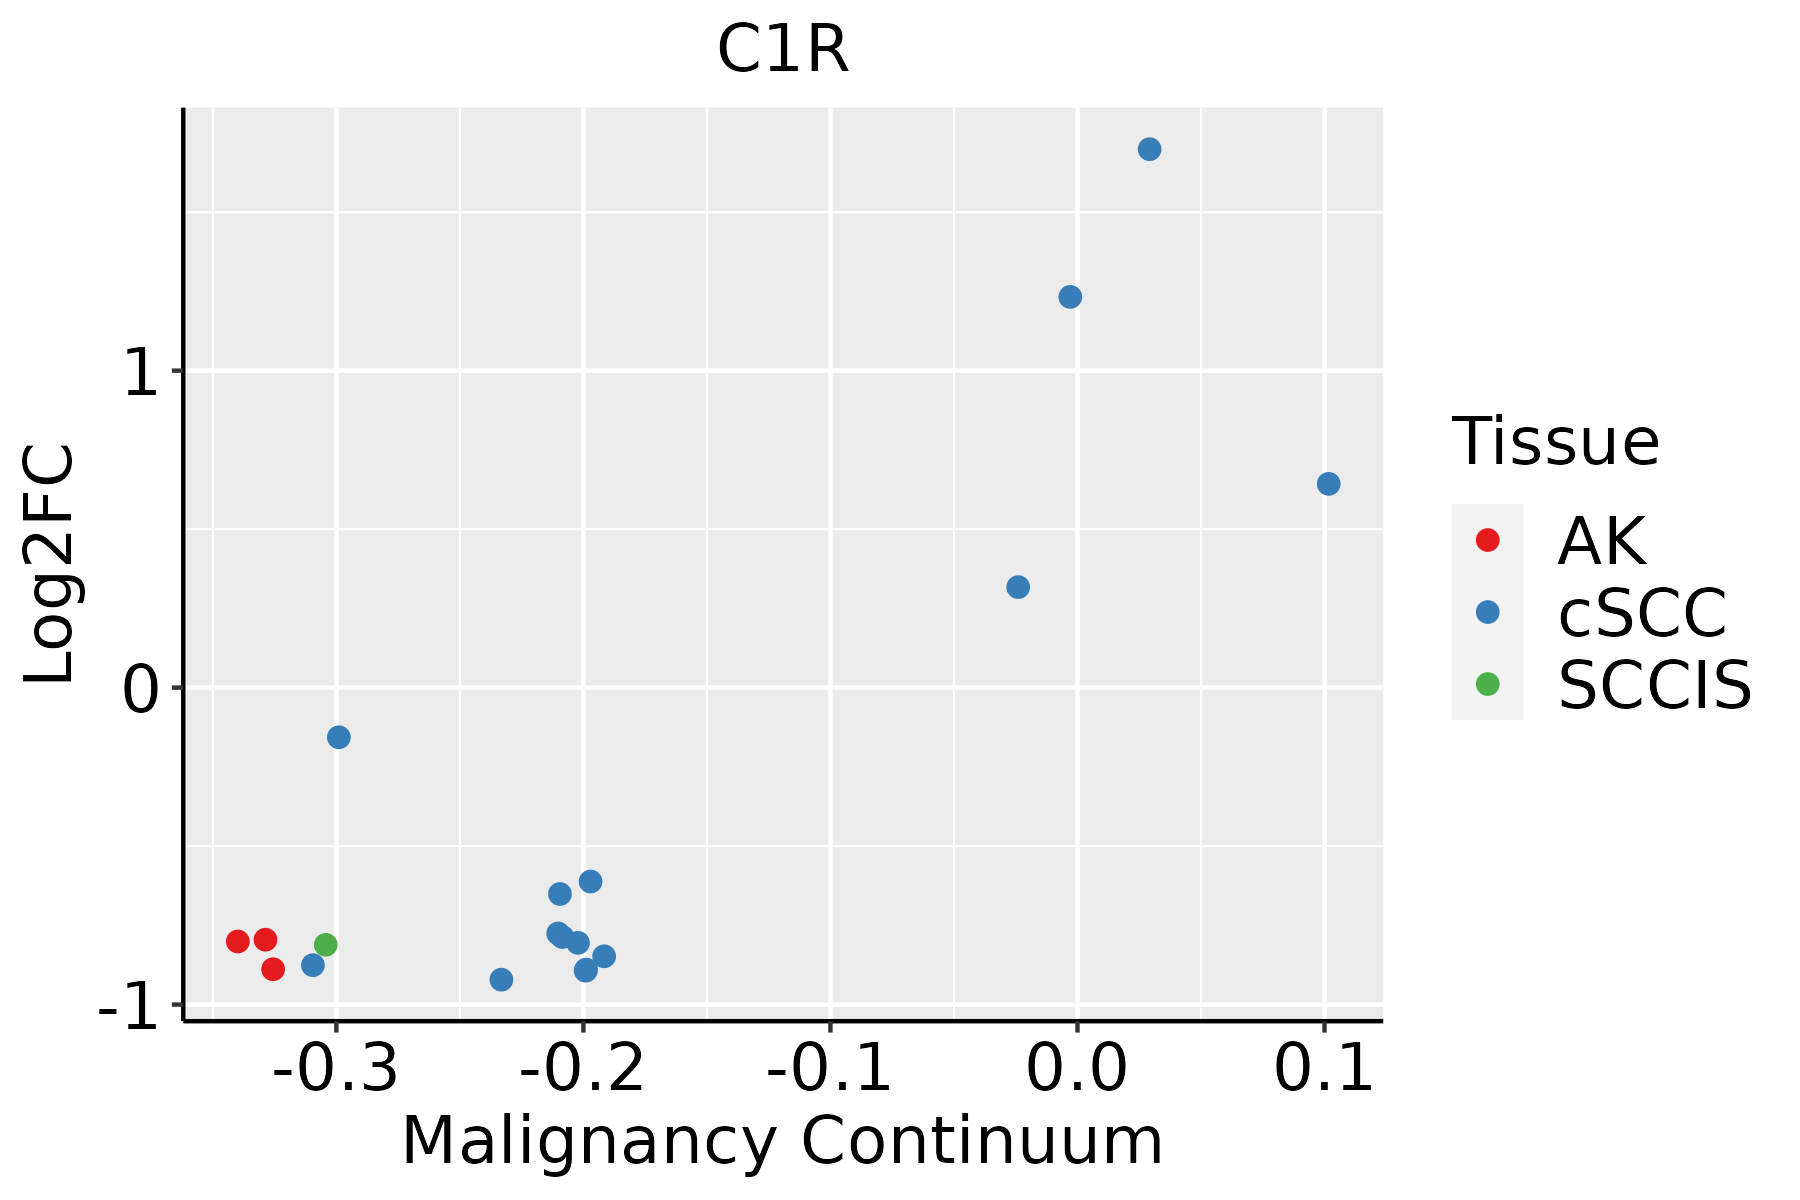 | AK: Actinic keratosis |
| cSCC: Cutaneous squamous cell carcinoma | ||
| SCCIS:squamous cell carcinoma in situ | ||
| Thyroid | 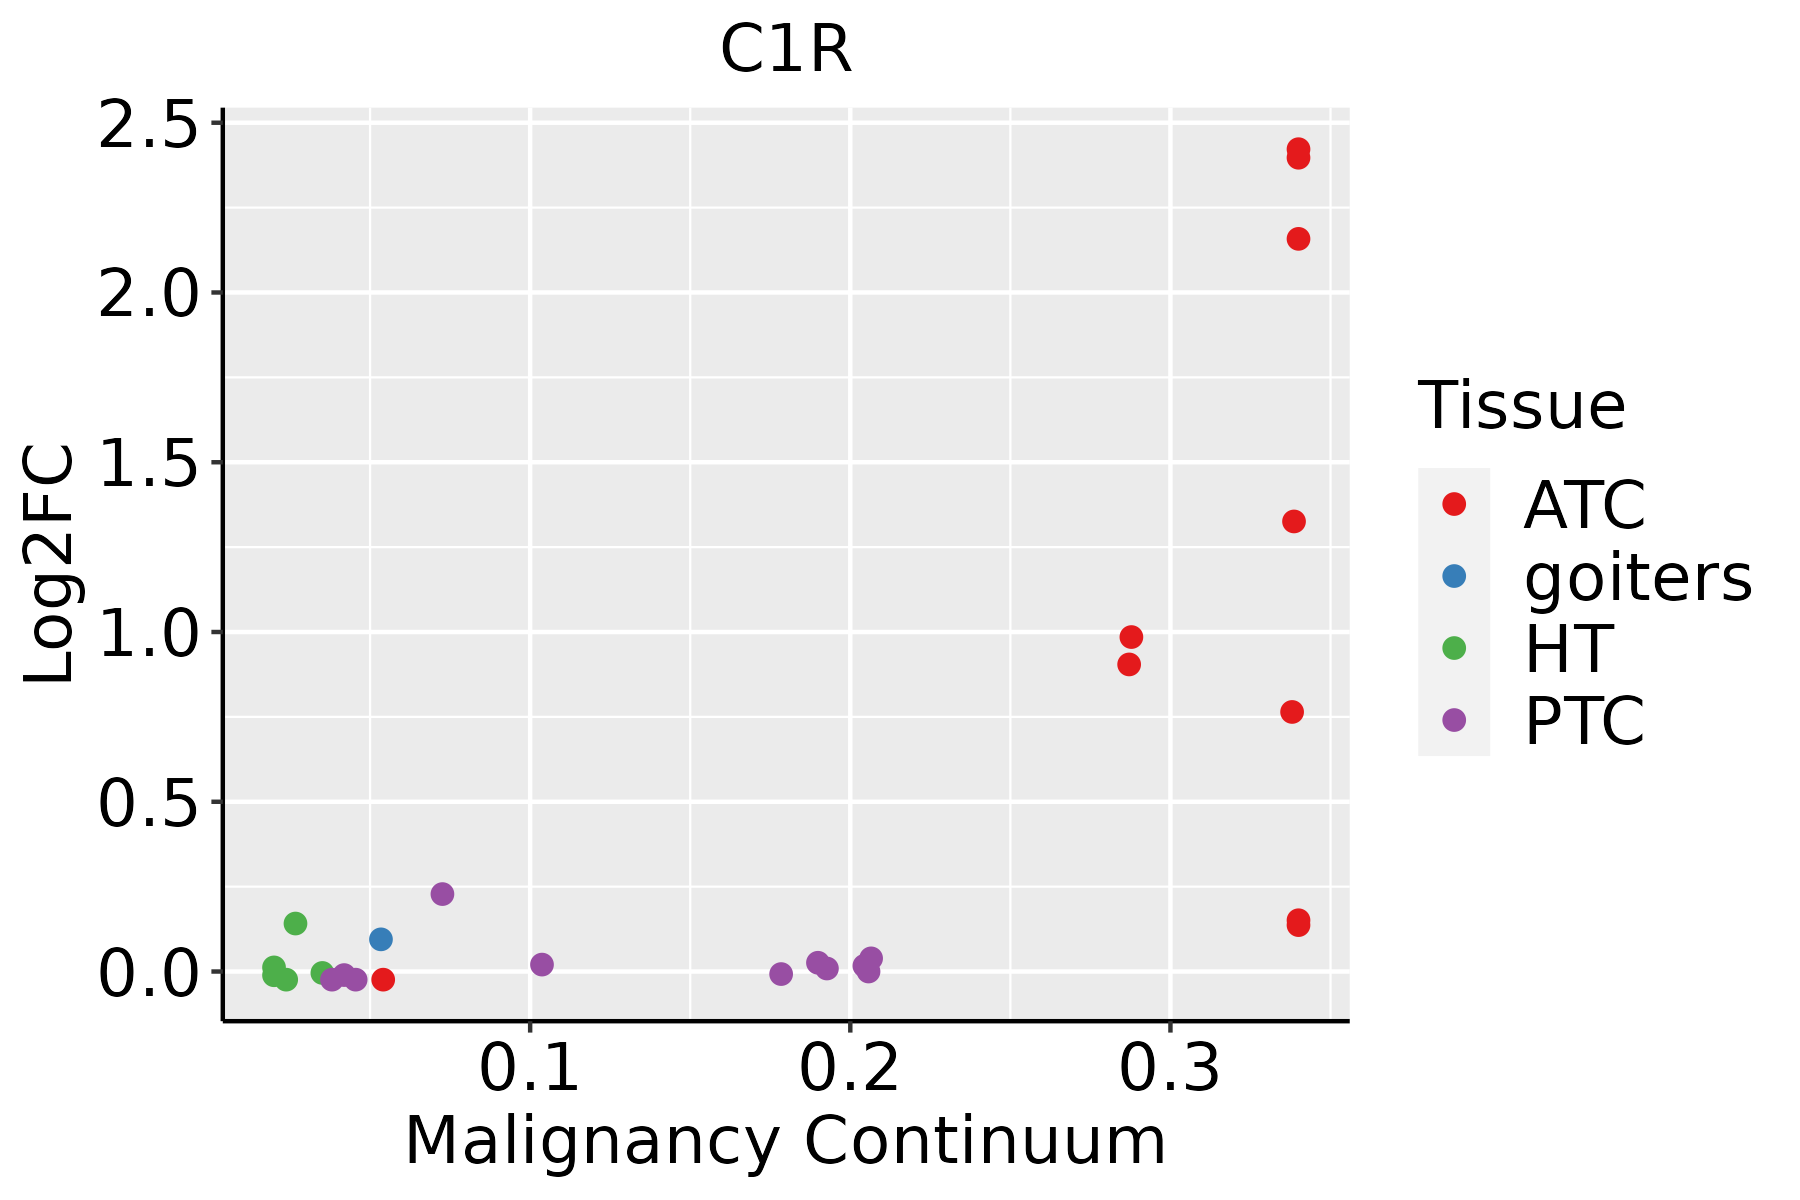 | ATC: Anaplastic thyroid cancer |
| HT: Hashimoto's thyroiditis | ||
| PTC: Papillary thyroid cancer |
| ∗log2FC in expression of this searched gene in stem-like cells from each diseased tissue sample relative to stem-like cells in normal samples in each tissue plotted against the malignancy continuum. Samples are colored based on if they are from different disease stage. |
Top |
Malignant transformation related pathway analysis |
| Find out the enriched GO biological processes and KEGG pathways involved in transition from healthy to precancer to cancer |
| Tissue | Disease Stage | Enriched GO biological Processes |
| Colorectum | AD |  |
| Colorectum | SER |  |
| Colorectum | MSS |  |
| Colorectum | MSI-H |  |
| Colorectum | FAP |  |
| ∗Top 15 enriched GO BP terms are showed in the bar plot of each disease state in each tissue. Each row represents a significant GO biological process which is colored according to the -log10(p.adjust). |
| Page: 1 2 3 4 5 6 7 8 9 |
| GO ID | Tissue | Disease Stage | Description | Gene Ratio | Bg Ratio | pvalue | p.adjust | Count |
| GO:00022533 | Cervix | CC | activation of immune response | 72/2311 | 375/18723 | 8.26e-05 | 1.11e-03 | 72 |
| GO:00516048 | Cervix | CC | protein maturation | 56/2311 | 294/18723 | 5.90e-04 | 5.59e-03 | 56 |
| GO:00024603 | Cervix | CC | adaptive immune response based on somatic recombination of immune receptors built from immunoglobulin superfamily domains | 62/2311 | 356/18723 | 3.09e-03 | 2.03e-02 | 62 |
| GO:0002443 | Cervix | CC | leukocyte mediated immunity | 73/2311 | 440/18723 | 5.01e-03 | 2.98e-02 | 73 |
| GO:00069597 | Cervix | CC | humoral immune response | 54/2311 | 317/18723 | 8.57e-03 | 4.42e-02 | 54 |
| GO:000695912 | Cervix | HSIL_HPV | humoral immune response | 39/737 | 317/18723 | 2.88e-10 | 7.02e-08 | 39 |
| GO:000225312 | Cervix | HSIL_HPV | activation of immune response | 40/737 | 375/18723 | 1.12e-08 | 1.30e-06 | 40 |
| GO:00160643 | Cervix | HSIL_HPV | immunoglobulin mediated immune response | 27/737 | 207/18723 | 4.74e-08 | 3.59e-06 | 27 |
| GO:00197243 | Cervix | HSIL_HPV | B cell mediated immunity | 27/737 | 210/18723 | 6.42e-08 | 4.49e-06 | 27 |
| GO:000246011 | Cervix | HSIL_HPV | adaptive immune response based on somatic recombination of immune receptors built from immunoglobulin superfamily domains | 37/737 | 356/18723 | 7.84e-08 | 5.32e-06 | 37 |
| GO:00024431 | Cervix | HSIL_HPV | leukocyte mediated immunity | 41/737 | 440/18723 | 3.14e-07 | 1.76e-05 | 41 |
| GO:00024493 | Cervix | HSIL_HPV | lymphocyte mediated immunity | 35/737 | 350/18723 | 4.45e-07 | 2.36e-05 | 35 |
| GO:00069563 | Cervix | HSIL_HPV | complement activation | 16/737 | 130/18723 | 5.24e-05 | 1.29e-03 | 16 |
| GO:0002455 | Cervix | HSIL_HPV | humoral immune response mediated by circulating immunoglobulin | 15/737 | 121/18723 | 8.19e-05 | 1.84e-03 | 15 |
| GO:00069582 | Cervix | HSIL_HPV | complement activation, classical pathway | 13/737 | 108/18723 | 3.22e-04 | 5.19e-03 | 13 |
| GO:005160418 | Esophagus | ESCC | protein maturation | 189/8552 | 294/18723 | 7.64e-11 | 2.39e-09 | 189 |
| GO:001648514 | Esophagus | ESCC | protein processing | 134/8552 | 225/18723 | 1.81e-05 | 1.60e-04 | 134 |
| GO:0031638 | Liver | NAFLD | zymogen activation | 16/1882 | 60/18723 | 2.08e-04 | 3.60e-03 | 16 |
| GO:00516046 | Liver | Cirrhotic | protein maturation | 121/4634 | 294/18723 | 3.54e-10 | 1.68e-08 | 121 |
| GO:00316381 | Liver | Cirrhotic | zymogen activation | 31/4634 | 60/18723 | 6.48e-06 | 1.02e-04 | 31 |
| Page: 1 2 3 |
| Pathway ID | Tissue | Disease Stage | Description | Gene Ratio | Bg Ratio | pvalue | p.adjust | qvalue | Count |
| hsa0414520 | Cervix | CC | Phagosome | 47/1267 | 152/8465 | 3.95e-07 | 4.26e-06 | 2.52e-06 | 47 |
| hsa04145110 | Cervix | CC | Phagosome | 47/1267 | 152/8465 | 3.95e-07 | 4.26e-06 | 2.52e-06 | 47 |
| hsa0414523 | Cervix | HSIL_HPV | Phagosome | 27/459 | 152/8465 | 3.58e-08 | 1.50e-06 | 1.21e-06 | 27 |
| hsa0414533 | Cervix | HSIL_HPV | Phagosome | 27/459 | 152/8465 | 3.58e-08 | 1.50e-06 | 1.21e-06 | 27 |
| hsa0517126 | Endometrium | AEH | Coronavirus disease - COVID-19 | 99/1197 | 232/8465 | 5.19e-27 | 3.37e-25 | 2.47e-25 | 99 |
| hsa0414524 | Endometrium | AEH | Phagosome | 41/1197 | 152/8465 | 2.12e-05 | 2.22e-04 | 1.63e-04 | 41 |
| hsa05171112 | Endometrium | AEH | Coronavirus disease - COVID-19 | 99/1197 | 232/8465 | 5.19e-27 | 3.37e-25 | 2.47e-25 | 99 |
| hsa04145111 | Endometrium | AEH | Phagosome | 41/1197 | 152/8465 | 2.12e-05 | 2.22e-04 | 1.63e-04 | 41 |
| hsa0517127 | Endometrium | EEC | Coronavirus disease - COVID-19 | 99/1237 | 232/8465 | 7.43e-26 | 4.89e-24 | 3.65e-24 | 99 |
| hsa0414525 | Endometrium | EEC | Phagosome | 42/1237 | 152/8465 | 2.01e-05 | 2.28e-04 | 1.70e-04 | 42 |
| hsa0517136 | Endometrium | EEC | Coronavirus disease - COVID-19 | 99/1237 | 232/8465 | 7.43e-26 | 4.89e-24 | 3.65e-24 | 99 |
| hsa0414534 | Endometrium | EEC | Phagosome | 42/1237 | 152/8465 | 2.01e-05 | 2.28e-04 | 1.70e-04 | 42 |
| hsa05171211 | Esophagus | ESCC | Coronavirus disease - COVID-19 | 156/4205 | 232/8465 | 3.18e-08 | 2.68e-07 | 1.37e-07 | 156 |
| hsa0414530 | Esophagus | ESCC | Phagosome | 100/4205 | 152/8465 | 3.81e-05 | 1.72e-04 | 8.82e-05 | 100 |
| hsa051339 | Esophagus | ESCC | Pertussis | 48/4205 | 76/8465 | 1.21e-02 | 2.77e-02 | 1.42e-02 | 48 |
| hsa05171310 | Esophagus | ESCC | Coronavirus disease - COVID-19 | 156/4205 | 232/8465 | 3.18e-08 | 2.68e-07 | 1.37e-07 | 156 |
| hsa04145114 | Esophagus | ESCC | Phagosome | 100/4205 | 152/8465 | 3.81e-05 | 1.72e-04 | 8.82e-05 | 100 |
| hsa0513314 | Esophagus | ESCC | Pertussis | 48/4205 | 76/8465 | 1.21e-02 | 2.77e-02 | 1.42e-02 | 48 |
| hsa0517114 | Liver | NAFLD | Coronavirus disease - COVID-19 | 111/1043 | 232/8465 | 1.01e-41 | 3.32e-39 | 2.67e-39 | 111 |
| hsa04610 | Liver | NAFLD | Complement and coagulation cascades | 35/1043 | 86/8465 | 2.48e-11 | 2.04e-09 | 1.64e-09 | 35 |
| Page: 1 2 3 |
Top |
Cell-cell communication analysis |
| Identification of potential cell-cell interactions between two cell types and their ligand-receptor pairs for different disease states |
| Ligand | Receptor | LRpair | Pathway | Tissue | Disease Stage |
| Page: 1 |
Top |
Single-cell gene regulatory network inference analysis |
| Find out the significant the regulons (TFs) and the target genes of each regulon across cell types for different disease states |
| TF | Cell Type | Tissue | Disease Stage | Target Gene | RSS | Regulon Activity |
| ∗The dot plots of a searched regulon are shown for all cell subpopulations in each disease state of each tissue based on the regulon specific score inferred using pySCENIC and by calculating the average expression. |
| Page: 1 |
Top |
Somatic mutation of malignant transformation related genes |
| Annotation of somatic variants for genes involved in malignant transformation |
| Hugo Symbol | Variant Class | Variant Classification | dbSNP RS | HGVSc | HGVSp | HGVSp Short | SWISSPROT | BIOTYPE | SIFT | PolyPhen | Tumor Sample Barcode | Tissue | Histology | Sex | Age | Stage | Therapy Types | Drugs | Outcome |
| C1R | SNV | Missense_Mutation | c.134N>T | p.Thr45Ile | p.T45I | P00736 | protein_coding | tolerated(0.11) | probably_damaging(0.978) | TCGA-A8-A09Z-01 | Breast | breast invasive carcinoma | Female | >=65 | I/II | Unknown | Unknown | SD | |
| C1R | SNV | Missense_Mutation | rs763682218 | c.823G>A | p.Asp275Asn | p.D275N | P00736 | protein_coding | tolerated(0.51) | benign(0.011) | TCGA-AN-A0AK-01 | Breast | breast invasive carcinoma | Female | >=65 | I/II | Unknown | Unknown | SD |
| C1R | SNV | Missense_Mutation | c.256N>T | p.Gly86Trp | p.G86W | P00736 | protein_coding | tolerated(0.08) | probably_damaging(1) | TCGA-BH-A18G-01 | Breast | breast invasive carcinoma | Female | >=65 | I/II | Unknown | Unknown | SD | |
| C1R | SNV | Missense_Mutation | c.1996N>T | p.Asp666Tyr | p.D666Y | P00736 | protein_coding | deleterious(0.02) | probably_damaging(0.941) | TCGA-EK-A3GK-01 | Cervix | cervical & endocervical cancer | Female | <65 | I/II | Unknown | Unknown | SD | |
| C1R | deletion | In_Frame_Del | novel | c.899_901delNNN | p.Leu300del | p.L300del | P00736 | protein_coding | TCGA-IR-A3LC-01 | Cervix | cervical & endocervical cancer | Female | <65 | I/II | Unspecific | Cisplatin | Complete Response | ||
| C1R | SNV | Missense_Mutation | c.1945N>A | p.Ala649Thr | p.A649T | P00736 | protein_coding | tolerated(0.72) | possibly_damaging(0.731) | TCGA-A6-2677-01 | Colorectum | colon adenocarcinoma | Female | >=65 | III/IV | Ancillary | leucovorin | SD | |
| C1R | SNV | Missense_Mutation | rs772306231 | c.949N>A | p.Glu317Lys | p.E317K | P00736 | protein_coding | tolerated(0.72) | benign(0.006) | TCGA-A6-A56B-01 | Colorectum | colon adenocarcinoma | Male | <65 | III/IV | Chemotherapy | fluorouracil | PD |
| C1R | SNV | Missense_Mutation | c.1881N>T | p.Lys627Asn | p.K627N | P00736 | protein_coding | tolerated(0.1) | benign(0.023) | TCGA-AA-3502-01 | Colorectum | colon adenocarcinoma | Male | >=65 | I/II | Unknown | Unknown | SD | |
| C1R | SNV | Missense_Mutation | novel | c.260N>T | p.Arg87Met | p.R87M | P00736 | protein_coding | deleterious(0) | benign(0.358) | TCGA-AA-3950-01 | Colorectum | colon adenocarcinoma | Female | >=65 | I/II | Unknown | Unknown | SD |
| C1R | SNV | Missense_Mutation | c.360N>A | p.Phe120Leu | p.F120L | P00736 | protein_coding | tolerated(0.05) | probably_damaging(0.999) | TCGA-AA-3984-01 | Colorectum | colon adenocarcinoma | Female | <65 | I/II | Unknown | Unknown | SD |
| Page: 1 2 3 4 5 6 7 |
Top |
Related drugs of malignant transformation related genes |
| Identification of chemicals and drugs interact with genes involved in malignant transfromation |
| (DGIdb 4.0) |
| Entrez ID | Symbol | Category | Interaction Types | Drug Claim Name | Drug Name | PMIDs |
| 715 | C1R | PROTEASE, DRUGGABLE GENOME, ENZYME | inhibitor | 178101079 | NAFAMOSTAT |
| Page: 1 |

Copyright 2023-Present -The University of Texas Health Science Center at Houston |