
|
|||||
|
 | |
| |
| |
| |
| |
| |
|
Gene: C1QTNF6 |
Gene summary for C1QTNF6 |
| Gene information | Species | Human | Gene symbol | C1QTNF6 | Gene ID | 114904 |
| Gene name | C1q and TNF related 6 | |
| Gene Alias | CTFP6 | |
| Cytomap | 22q12.3 | |
| Gene Type | protein-coding | GO ID | GO:0005575 | UniProtAcc | A0A024R1J0 |
Top |
Malignant transformation analysis |
| Identification of the aberrant gene expression in precancerous and cancerous lesions by comparing the gene expression of stem-like cells in diseased tissues with normal stem cells |
| Entrez ID | Symbol | Replicates | Species | Organ | Tissue | Adj P-value | Log2FC | Malignancy |
| 114904 | C1QTNF6 | P2T-E | Human | Esophagus | ESCC | 9.44e-07 | 1.43e-01 | 0.1177 |
| 114904 | C1QTNF6 | P4T-E | Human | Esophagus | ESCC | 7.93e-07 | 2.00e-01 | 0.1323 |
| 114904 | C1QTNF6 | P8T-E | Human | Esophagus | ESCC | 2.02e-06 | 1.32e-01 | 0.0889 |
| 114904 | C1QTNF6 | P9T-E | Human | Esophagus | ESCC | 3.82e-08 | 2.18e-01 | 0.1131 |
| 114904 | C1QTNF6 | P10T-E | Human | Esophagus | ESCC | 1.88e-04 | 1.24e-01 | 0.116 |
| 114904 | C1QTNF6 | P11T-E | Human | Esophagus | ESCC | 1.85e-29 | 1.14e+00 | 0.1426 |
| 114904 | C1QTNF6 | P17T-E | Human | Esophagus | ESCC | 1.49e-02 | 1.38e-01 | 0.1278 |
| 114904 | C1QTNF6 | P19T-E | Human | Esophagus | ESCC | 1.65e-10 | 6.70e-01 | 0.1662 |
| 114904 | C1QTNF6 | P21T-E | Human | Esophagus | ESCC | 1.88e-11 | 2.39e-01 | 0.1617 |
| 114904 | C1QTNF6 | P22T-E | Human | Esophagus | ESCC | 1.62e-13 | 3.07e-01 | 0.1236 |
| 114904 | C1QTNF6 | P24T-E | Human | Esophagus | ESCC | 9.20e-06 | 1.69e-01 | 0.1287 |
| 114904 | C1QTNF6 | P26T-E | Human | Esophagus | ESCC | 8.40e-04 | 1.03e-01 | 0.1276 |
| 114904 | C1QTNF6 | P32T-E | Human | Esophagus | ESCC | 8.40e-04 | 1.12e-01 | 0.1666 |
| 114904 | C1QTNF6 | P37T-E | Human | Esophagus | ESCC | 5.50e-16 | 3.45e-01 | 0.1371 |
| 114904 | C1QTNF6 | P40T-E | Human | Esophagus | ESCC | 1.20e-04 | 2.19e-01 | 0.109 |
| 114904 | C1QTNF6 | P42T-E | Human | Esophagus | ESCC | 2.42e-06 | 2.63e-01 | 0.1175 |
| 114904 | C1QTNF6 | P44T-E | Human | Esophagus | ESCC | 1.67e-06 | 4.07e-01 | 0.1096 |
| 114904 | C1QTNF6 | P47T-E | Human | Esophagus | ESCC | 8.56e-12 | 2.28e-01 | 0.1067 |
| 114904 | C1QTNF6 | P49T-E | Human | Esophagus | ESCC | 3.75e-07 | 5.95e-01 | 0.1768 |
| 114904 | C1QTNF6 | P52T-E | Human | Esophagus | ESCC | 8.40e-04 | 1.09e-01 | 0.1555 |
| Page: 1 2 3 |
| Tissue | Expression Dynamics | Abbreviation |
| Esophagus | 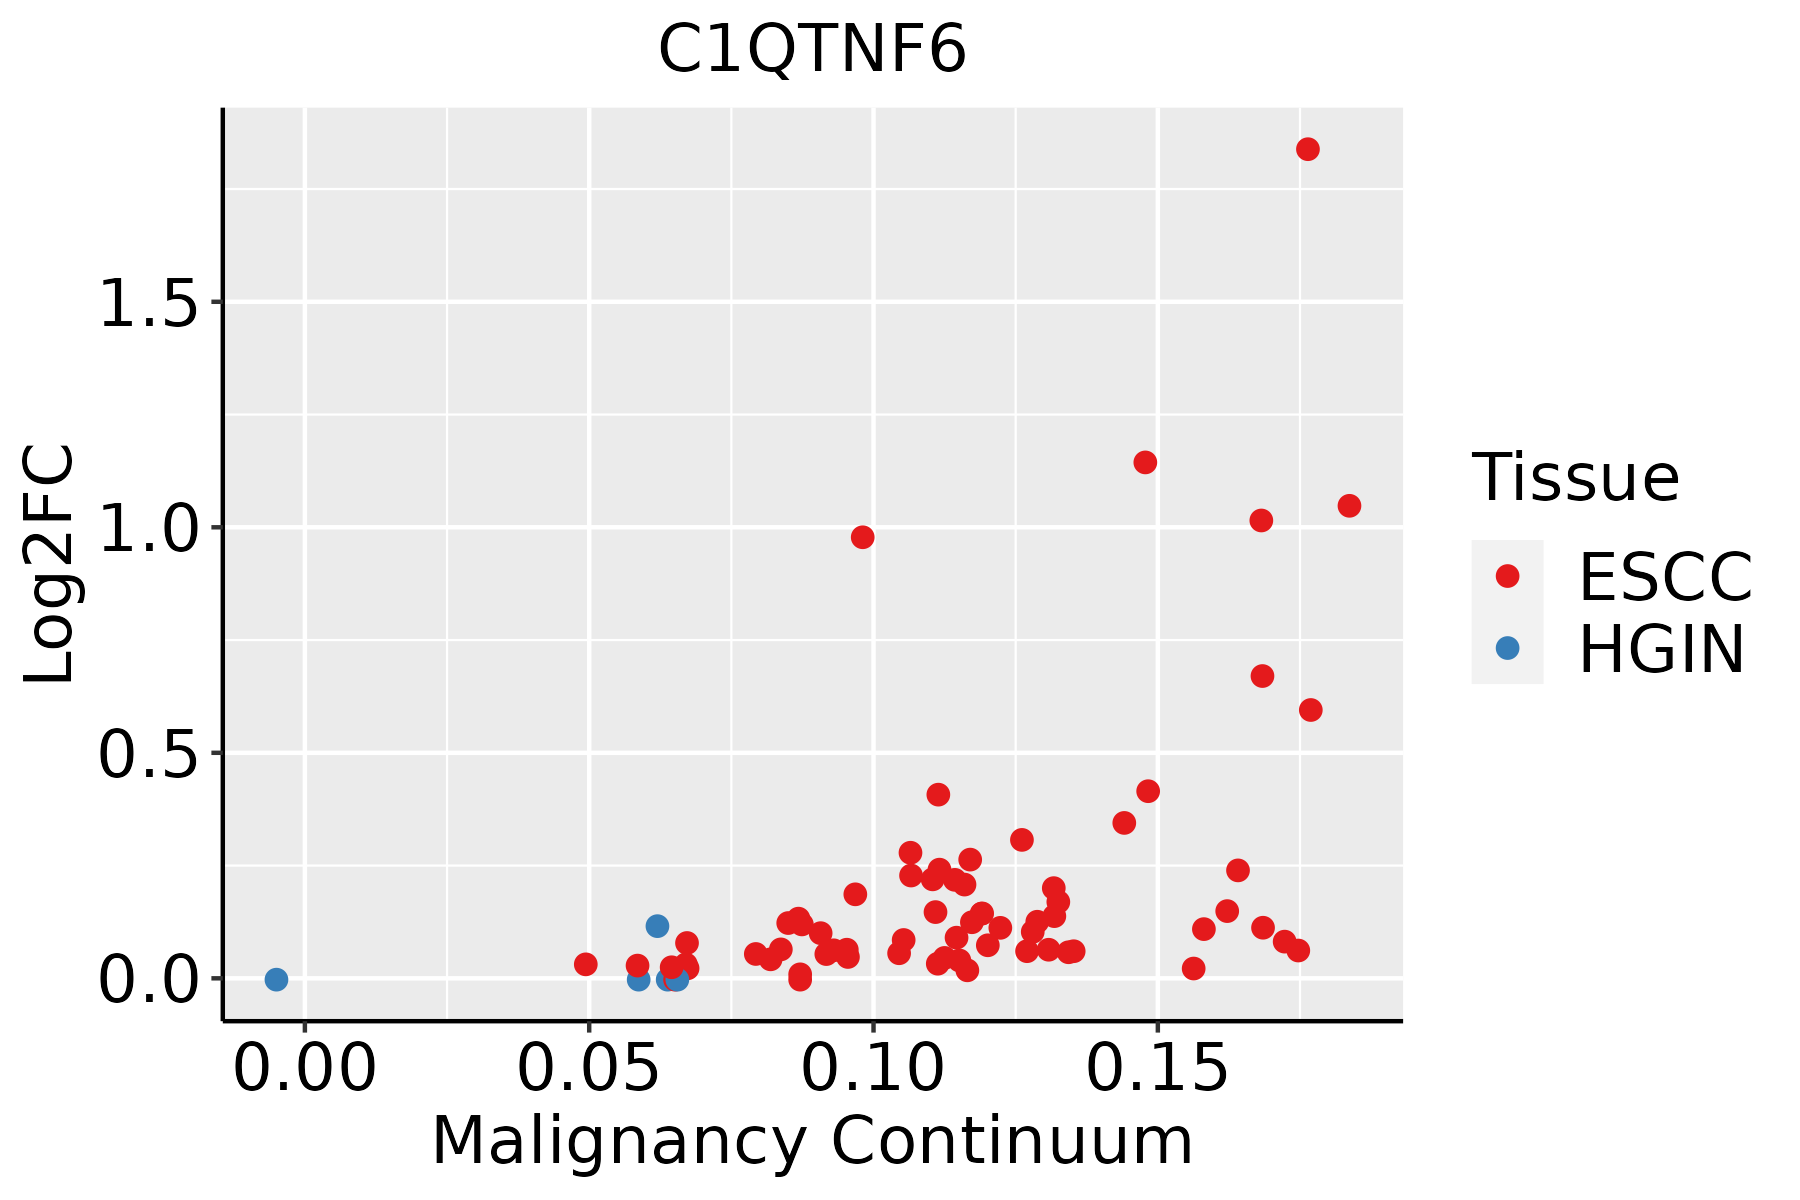 | ESCC: Esophageal squamous cell carcinoma |
| HGIN: High-grade intraepithelial neoplasias | ||
| LGIN: Low-grade intraepithelial neoplasias | ||
| Oral Cavity | 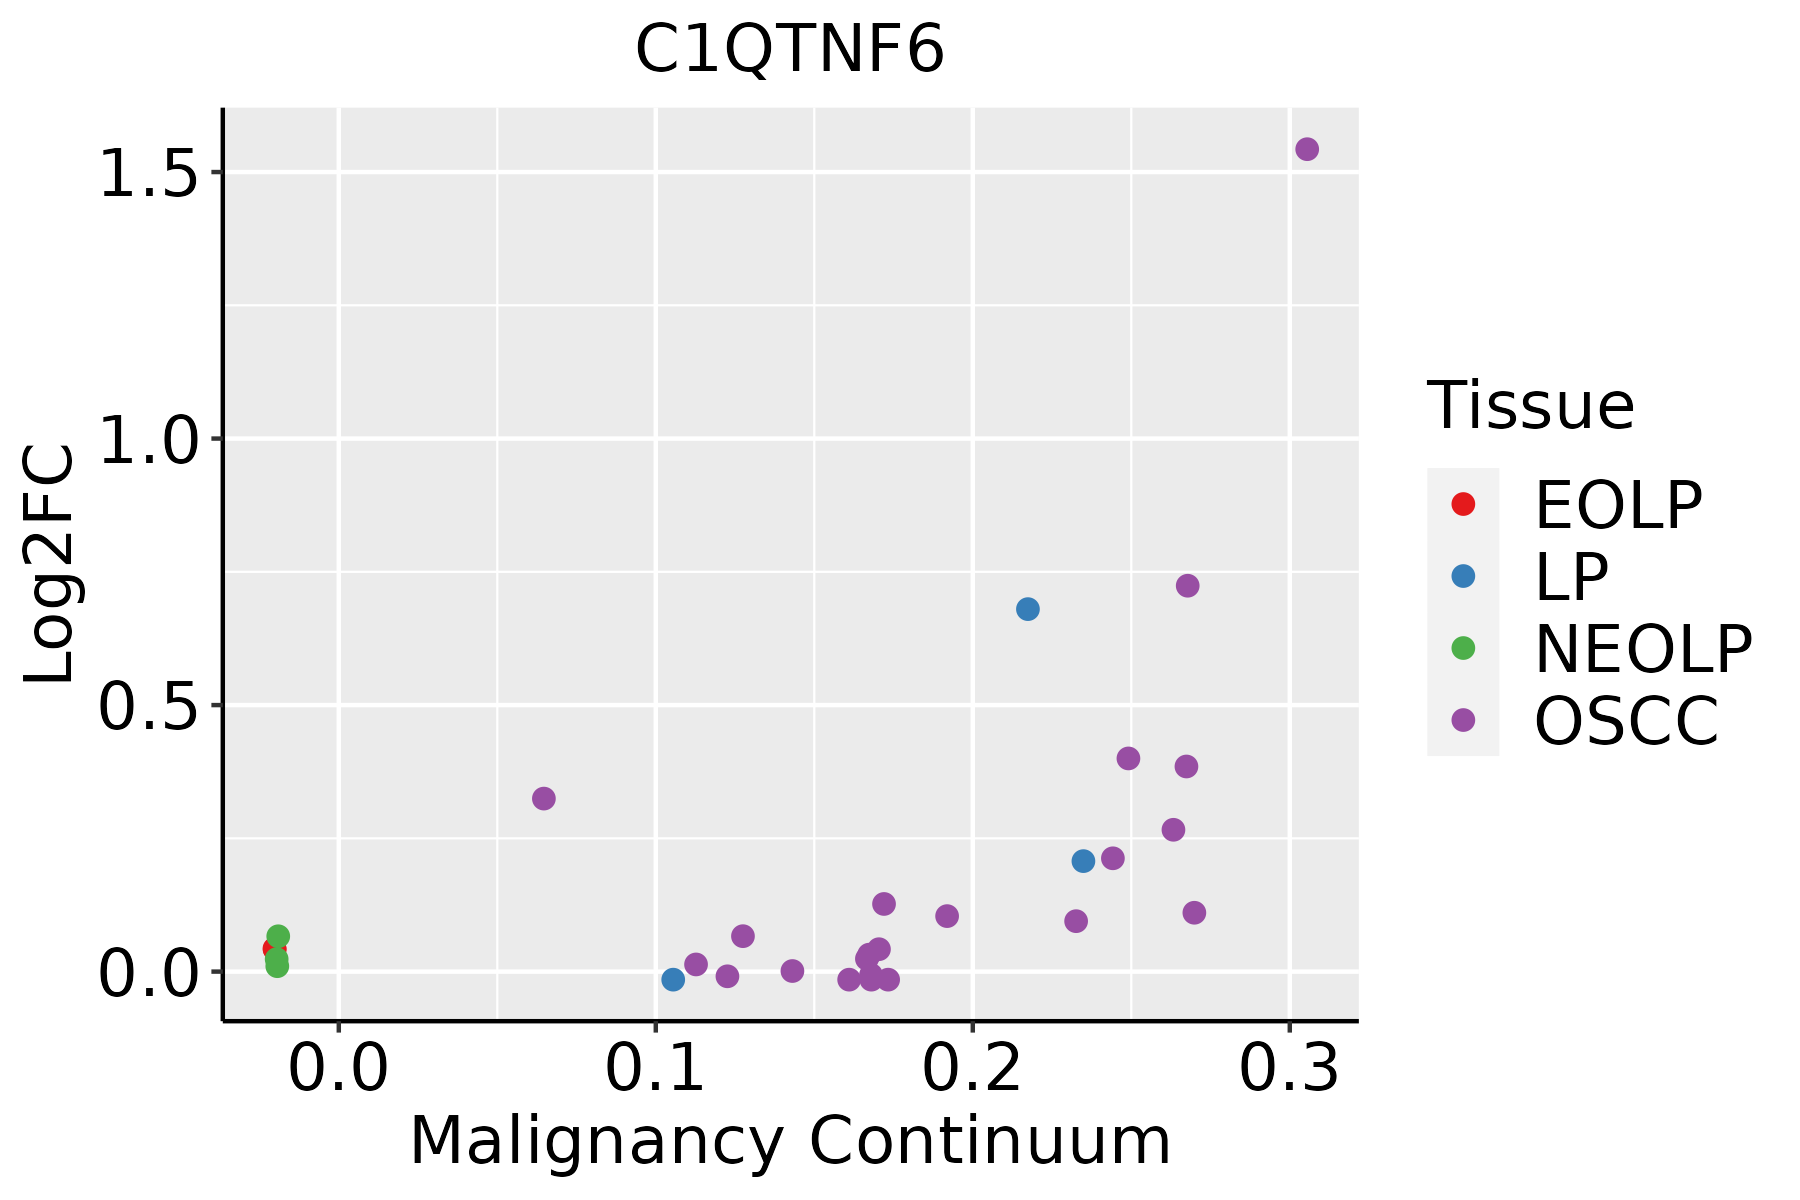 | EOLP: Erosive Oral lichen planus |
| LP: leukoplakia | ||
| NEOLP: Non-erosive oral lichen planus | ||
| OSCC: Oral squamous cell carcinoma | ||
| Thyroid | 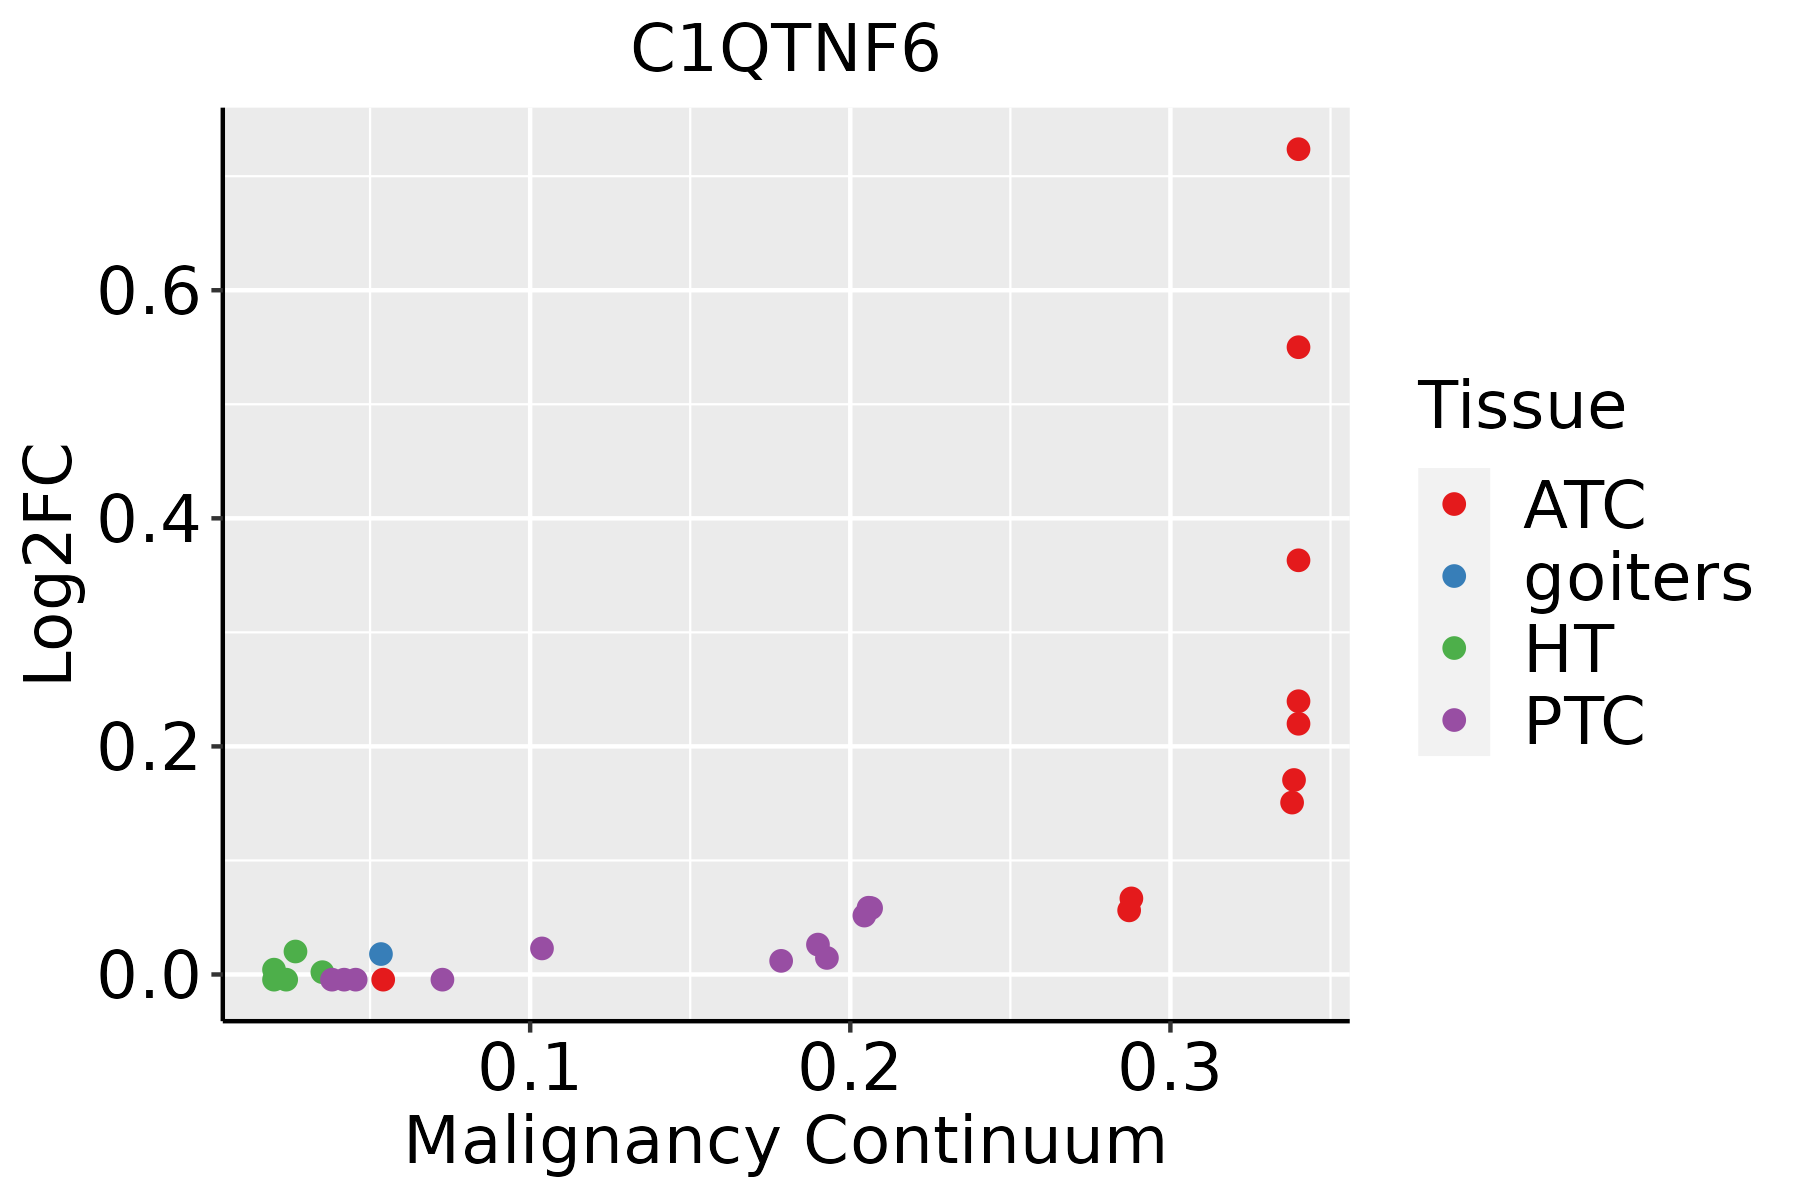 | ATC: Anaplastic thyroid cancer |
| HT: Hashimoto's thyroiditis | ||
| PTC: Papillary thyroid cancer |
| ∗log2FC in expression of this searched gene in stem-like cells from each diseased tissue sample relative to stem-like cells in normal samples in each tissue plotted against the malignancy continuum. Samples are colored based on if they are from different disease stage. |
Top |
Malignant transformation related pathway analysis |
| Find out the enriched GO biological processes and KEGG pathways involved in transition from healthy to precancer to cancer |
| Tissue | Disease Stage | Enriched GO biological Processes |
| Colorectum | AD |  |
| Colorectum | SER |  |
| Colorectum | MSS |  |
| Colorectum | MSI-H |  |
| Colorectum | FAP |  |
| ∗Top 15 enriched GO BP terms are showed in the bar plot of each disease state in each tissue. Each row represents a significant GO biological process which is colored according to the -log10(p.adjust). |
| Page: 1 2 3 4 5 6 7 8 9 |
| GO ID | Tissue | Disease Stage | Description | Gene Ratio | Bg Ratio | pvalue | p.adjust | Count |
| Page: 1 |
| Pathway ID | Tissue | Disease Stage | Description | Gene Ratio | Bg Ratio | pvalue | p.adjust | qvalue | Count |
| Page: 1 |
Top |
Cell-cell communication analysis |
| Identification of potential cell-cell interactions between two cell types and their ligand-receptor pairs for different disease states |
| Ligand | Receptor | LRpair | Pathway | Tissue | Disease Stage |
| Page: 1 |
Top |
Single-cell gene regulatory network inference analysis |
| Find out the significant the regulons (TFs) and the target genes of each regulon across cell types for different disease states |
| TF | Cell Type | Tissue | Disease Stage | Target Gene | RSS | Regulon Activity |
| ∗The dot plots of a searched regulon are shown for all cell subpopulations in each disease state of each tissue based on the regulon specific score inferred using pySCENIC and by calculating the average expression. |
| Page: 1 |
Top |
Somatic mutation of malignant transformation related genes |
| Annotation of somatic variants for genes involved in malignant transformation |
| Hugo Symbol | Variant Class | Variant Classification | dbSNP RS | HGVSc | HGVSp | HGVSp Short | SWISSPROT | BIOTYPE | SIFT | PolyPhen | Tumor Sample Barcode | Tissue | Histology | Sex | Age | Stage | Therapy Types | Drugs | Outcome |
| C1QTNF6 | SNV | Missense_Mutation | c.547T>C | p.Phe183Leu | p.F183L | Q9BXI9 | protein_coding | deleterious(0) | probably_damaging(1) | TCGA-BH-A0HA-01 | Breast | breast invasive carcinoma | Female | <65 | I/II | Unknown | Unknown | SD | |
| C1QTNF6 | insertion | Frame_Shift_Ins | novel | c.487_488insCCTCAAC | p.Leu163ProfsTer13 | p.L163Pfs*13 | Q9BXI9 | protein_coding | TCGA-AO-A03R-01 | Breast | breast invasive carcinoma | Female | <65 | I/II | Chemotherapy | doxorubicin | SD | ||
| C1QTNF6 | SNV | Missense_Mutation | c.187G>C | p.Glu63Gln | p.E63Q | Q9BXI9 | protein_coding | tolerated(0.52) | benign(0.03) | TCGA-IR-A3LH-01 | Cervix | cervical & endocervical cancer | Female | <65 | I/II | Chemotherapy | cisplatin | CR | |
| C1QTNF6 | SNV | Missense_Mutation | c.154N>C | p.Val52Leu | p.V52L | Q9BXI9 | protein_coding | tolerated(0.4) | benign(0.001) | TCGA-JW-A5VL-01 | Cervix | cervical & endocervical cancer | Female | <65 | I/II | Unknown | Unknown | SD | |
| C1QTNF6 | SNV | Missense_Mutation | rs140887252 | c.541N>A | p.Gly181Ser | p.G181S | Q9BXI9 | protein_coding | deleterious(0.03) | probably_damaging(1) | TCGA-CM-4743-01 | Colorectum | colon adenocarcinoma | Male | >=65 | I/II | Chemotherapy | capecitabine | SD |
| C1QTNF6 | SNV | Missense_Mutation | rs748662192 | c.496G>A | p.Glu166Lys | p.E166K | Q9BXI9 | protein_coding | deleterious(0) | benign(0.348) | TCGA-AG-A002-01 | Colorectum | rectum adenocarcinoma | Male | <65 | I/II | Unknown | Unknown | SD |
| C1QTNF6 | SNV | Missense_Mutation | novel | c.636C>G | p.Asn212Lys | p.N212K | Q9BXI9 | protein_coding | deleterious(0) | probably_damaging(0.996) | TCGA-A5-A0R9-01 | Endometrium | uterine corpus endometrioid carcinoma | Female | <65 | I/II | Unknown | Unknown | SD |
| C1QTNF6 | SNV | Missense_Mutation | rs774652920 | c.739C>T | p.Arg247Trp | p.R247W | Q9BXI9 | protein_coding | deleterious(0) | probably_damaging(1) | TCGA-AJ-A3BH-01 | Endometrium | uterine corpus endometrioid carcinoma | Female | Unknown | I/II | Unknown | Unknown | SD |
| C1QTNF6 | SNV | Missense_Mutation | c.239C>A | p.Pro80His | p.P80H | Q9BXI9 | protein_coding | tolerated(0.15) | benign(0.042) | TCGA-AP-A059-01 | Endometrium | uterine corpus endometrioid carcinoma | Female | >=65 | I/II | Unknown | Unknown | SD | |
| C1QTNF6 | SNV | Missense_Mutation | novel | c.730N>A | p.Val244Ile | p.V244I | Q9BXI9 | protein_coding | deleterious(0.04) | possibly_damaging(0.697) | TCGA-AP-A0LS-01 | Endometrium | uterine corpus endometrioid carcinoma | Female | <65 | I/II | Unknown | Unknown | SD |
| Page: 1 2 3 |
Top |
Related drugs of malignant transformation related genes |
| Identification of chemicals and drugs interact with genes involved in malignant transfromation |
| (DGIdb 4.0) |
| Entrez ID | Symbol | Category | Interaction Types | Drug Claim Name | Drug Name | PMIDs |
| Page: 1 |

Copyright 2023-Present -The University of Texas Health Science Center at Houston |