
|
|||||
|
 | |
| |
| |
| |
| |
| |
|
Gene: C1QTNF4 |
Gene summary for C1QTNF4 |
| Gene information | Species | Human | Gene symbol | C1QTNF4 | Gene ID | 114900 |
| Gene name | C1q and TNF related 4 | |
| Gene Alias | CTRP4 | |
| Cytomap | 11p11.2 | |
| Gene Type | protein-coding | GO ID | GO:0001816 | UniProtAcc | Q9BXJ3 |
Top |
Malignant transformation analysis |
| Identification of the aberrant gene expression in precancerous and cancerous lesions by comparing the gene expression of stem-like cells in diseased tissues with normal stem cells |
| Entrez ID | Symbol | Replicates | Species | Organ | Tissue | Adj P-value | Log2FC | Malignancy |
| 114900 | C1QTNF4 | ATC13 | Human | Thyroid | ATC | 1.18e-45 | 1.04e+00 | 0.34 |
| 114900 | C1QTNF4 | ATC5 | Human | Thyroid | ATC | 4.07e-52 | 1.12e+00 | 0.34 |
| Page: 1 |
| Tissue | Expression Dynamics | Abbreviation |
| Thyroid | 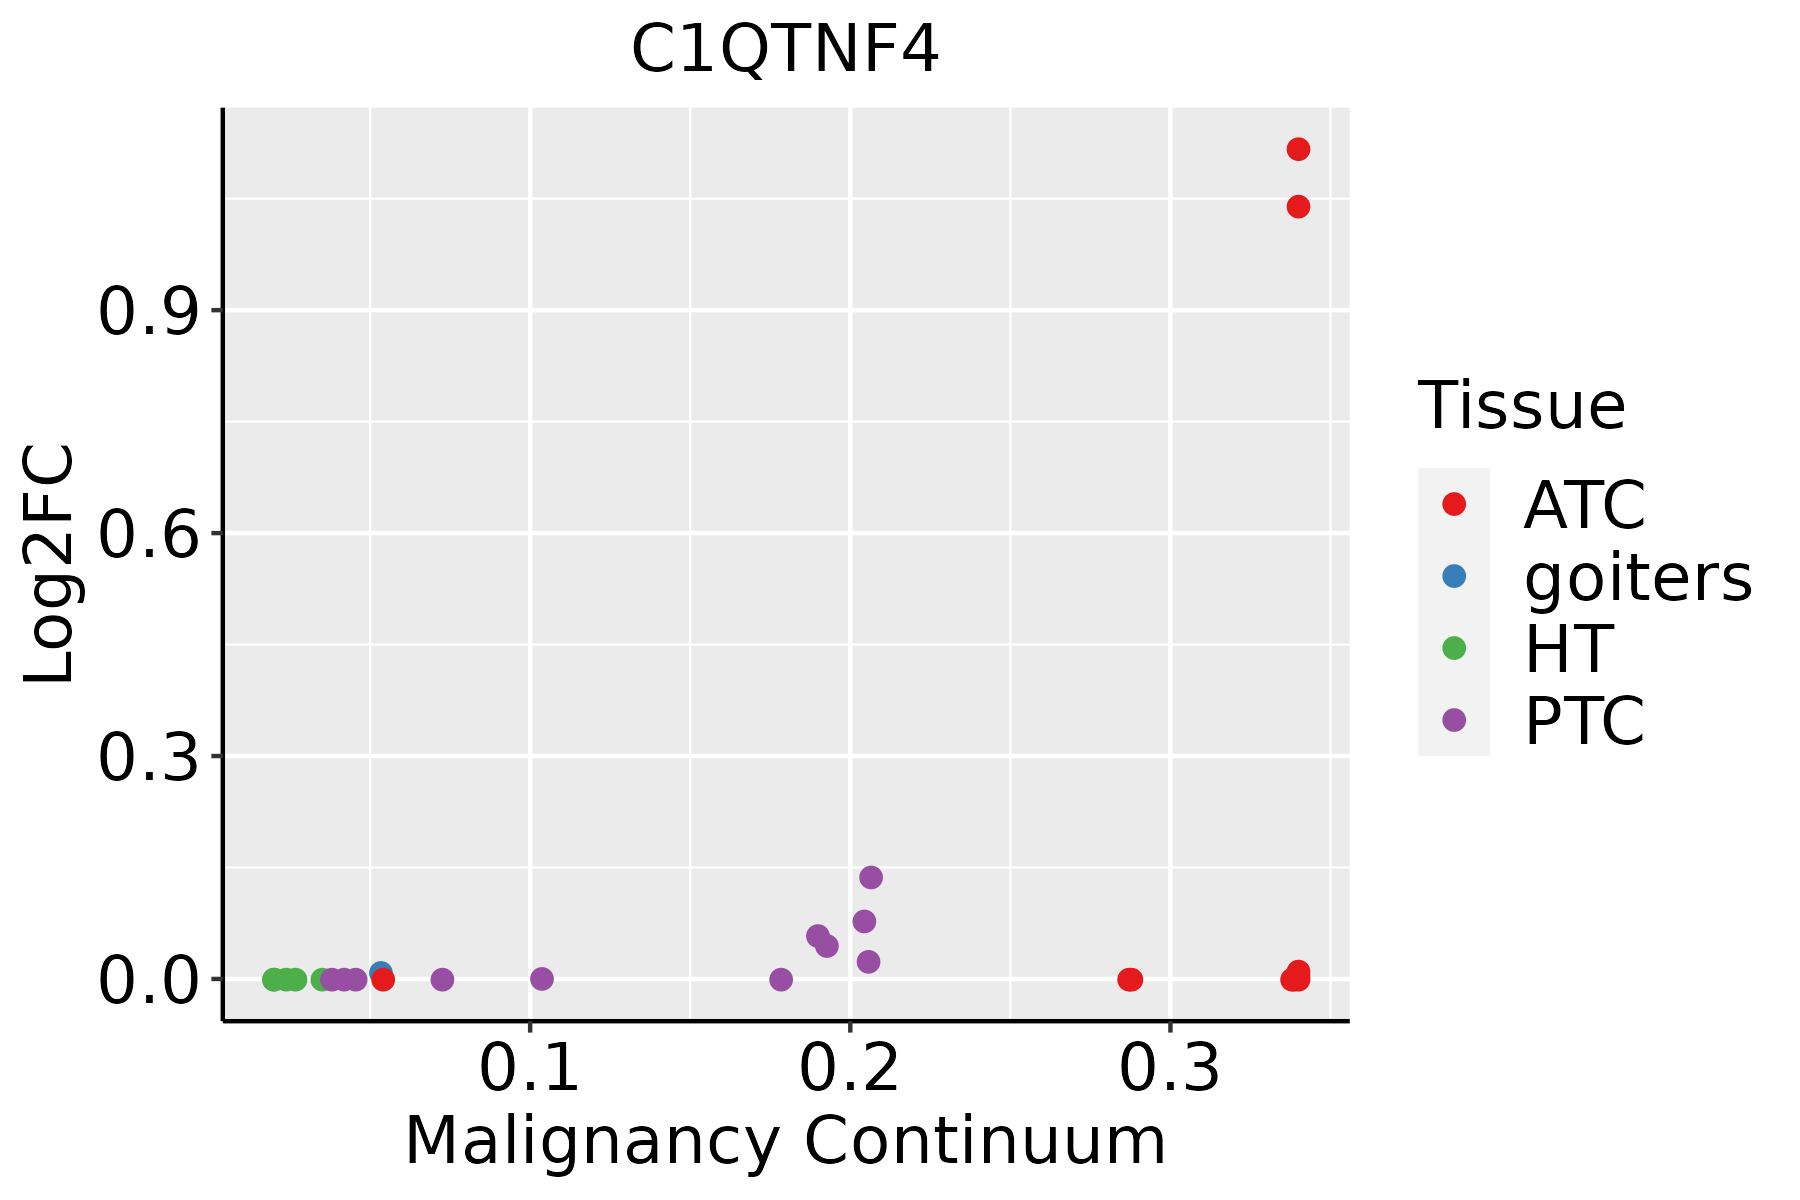 | ATC: Anaplastic thyroid cancer |
| HT: Hashimoto's thyroiditis | ||
| PTC: Papillary thyroid cancer |
| ∗log2FC in expression of this searched gene in stem-like cells from each diseased tissue sample relative to stem-like cells in normal samples in each tissue plotted against the malignancy continuum. Samples are colored based on if they are from different disease stage. |
Top |
Malignant transformation related pathway analysis |
| Find out the enriched GO biological processes and KEGG pathways involved in transition from healthy to precancer to cancer |
| Tissue | Disease Stage | Enriched GO biological Processes |
| Colorectum | AD |  |
| Colorectum | SER |  |
| Colorectum | MSS |  |
| Colorectum | MSI-H |  |
| Colorectum | FAP |  |
| ∗Top 15 enriched GO BP terms are showed in the bar plot of each disease state in each tissue. Each row represents a significant GO biological process which is colored according to the -log10(p.adjust). |
| Page: 1 2 3 4 5 6 7 8 9 |
| GO ID | Tissue | Disease Stage | Description | Gene Ratio | Bg Ratio | pvalue | p.adjust | Count |
| GO:006076012 | Thyroid | ATC | positive regulation of response to cytokine stimulus | 33/6293 | 57/18723 | 1.43e-04 | 9.91e-04 | 33 |
| GO:006075912 | Thyroid | ATC | regulation of response to cytokine stimulus | 76/6293 | 162/18723 | 2.92e-04 | 1.85e-03 | 76 |
| GO:000195912 | Thyroid | ATC | regulation of cytokine-mediated signaling pathway | 71/6293 | 150/18723 | 3.28e-04 | 2.04e-03 | 71 |
| GO:000196112 | Thyroid | ATC | positive regulation of cytokine-mediated signaling pathway | 29/6293 | 50/18723 | 3.42e-04 | 2.12e-03 | 29 |
| GO:190122421 | Thyroid | ATC | positive regulation of NIK/NF-kappaB signaling | 37/6293 | 69/18723 | 4.80e-04 | 2.81e-03 | 37 |
| GO:000181924 | Thyroid | ATC | positive regulation of cytokine production | 189/6293 | 467/18723 | 1.00e-03 | 5.31e-03 | 189 |
| GO:003806122 | Thyroid | ATC | NIK/NF-kappaB signaling | 64/6293 | 143/18723 | 3.53e-03 | 1.57e-02 | 64 |
| GO:00327608 | Thyroid | ATC | positive regulation of tumor necrosis factor production | 48/6293 | 103/18723 | 4.14e-03 | 1.76e-02 | 48 |
| GO:190122232 | Thyroid | ATC | regulation of NIK/NF-kappaB signaling | 51/6293 | 112/18723 | 5.68e-03 | 2.30e-02 | 51 |
| GO:19035576 | Thyroid | ATC | positive regulation of tumor necrosis factor superfamily cytokine production | 49/6293 | 107/18723 | 5.79e-03 | 2.34e-02 | 49 |
| Page: 1 |
| Pathway ID | Tissue | Disease Stage | Description | Gene Ratio | Bg Ratio | pvalue | p.adjust | qvalue | Count |
| Page: 1 |
Top |
Cell-cell communication analysis |
| Identification of potential cell-cell interactions between two cell types and their ligand-receptor pairs for different disease states |
| Ligand | Receptor | LRpair | Pathway | Tissue | Disease Stage |
| Page: 1 |
Top |
Single-cell gene regulatory network inference analysis |
| Find out the significant the regulons (TFs) and the target genes of each regulon across cell types for different disease states |
| TF | Cell Type | Tissue | Disease Stage | Target Gene | RSS | Regulon Activity |
| ∗The dot plots of a searched regulon are shown for all cell subpopulations in each disease state of each tissue based on the regulon specific score inferred using pySCENIC and by calculating the average expression. |
| Page: 1 |
Top |
Somatic mutation of malignant transformation related genes |
| Annotation of somatic variants for genes involved in malignant transformation |
| Hugo Symbol | Variant Class | Variant Classification | dbSNP RS | HGVSc | HGVSp | HGVSp Short | SWISSPROT | BIOTYPE | SIFT | PolyPhen | Tumor Sample Barcode | Tissue | Histology | Sex | Age | Stage | Therapy Types | Drugs | Outcome |
| C1QTNF4 | SNV | Missense_Mutation | rs778312961 | c.791N>T | p.Ser264Leu | p.S264L | Q9BXJ3 | protein_coding | deleterious(0.01) | possibly_damaging(0.879) | TCGA-BH-A2L8-01 | Breast | breast invasive carcinoma | Female | <65 | I/II | Chemotherapy | cytoxan | CR |
| C1QTNF4 | SNV | Missense_Mutation | rs186546762 | c.886G>A | p.Ala296Thr | p.A296T | Q9BXJ3 | protein_coding | tolerated(0.18) | possibly_damaging(0.84) | TCGA-E2-A10A-01 | Breast | breast invasive carcinoma | Female | <65 | I/II | Hormone Therapy | zoladex | SD |
| C1QTNF4 | deletion | Frame_Shift_Del | novel | c.967delC | p.Leu323SerfsTer47 | p.L323Sfs*47 | Q9BXJ3 | protein_coding | TCGA-EW-A2FV-01 | Breast | breast invasive carcinoma | Female | <65 | III/IV | Chemotherapy | docetaxel | SD | ||
| C1QTNF4 | SNV | Missense_Mutation | c.677N>T | p.Pro226Leu | p.P226L | Q9BXJ3 | protein_coding | deleterious(0) | probably_damaging(0.981) | TCGA-DG-A2KK-01 | Cervix | cervical & endocervical cancer | Female | <65 | III/IV | Chemotherapy | cisplatin | SD | |
| C1QTNF4 | SNV | Missense_Mutation | novel | c.290N>G | p.Asn97Ser | p.N97S | Q9BXJ3 | protein_coding | deleterious(0.01) | probably_damaging(0.992) | TCGA-5M-AAT6-01 | Colorectum | colon adenocarcinoma | Female | <65 | III/IV | Unknown | Unknown | PD |
| C1QTNF4 | SNV | Missense_Mutation | rs866041290 | c.757N>A | p.Glu253Lys | p.E253K | Q9BXJ3 | protein_coding | tolerated(0.08) | probably_damaging(0.95) | TCGA-AA-3815-01 | Colorectum | colon adenocarcinoma | Female | >=65 | I/II | Unknown | Unknown | SD |
| C1QTNF4 | SNV | Missense_Mutation | c.671G>A | p.Arg224His | p.R224H | Q9BXJ3 | protein_coding | tolerated(0.24) | benign(0.122) | TCGA-CM-4746-01 | Colorectum | colon adenocarcinoma | Male | <65 | I/II | Unknown | Unknown | SD | |
| C1QTNF4 | SNV | Missense_Mutation | novel | c.826N>A | p.Leu276Met | p.L276M | Q9BXJ3 | protein_coding | deleterious(0) | probably_damaging(1) | TCGA-AP-A059-01 | Endometrium | uterine corpus endometrioid carcinoma | Female | >=65 | I/II | Unknown | Unknown | SD |
| C1QTNF4 | SNV | Missense_Mutation | novel | c.866N>T | p.His289Leu | p.H289L | Q9BXJ3 | protein_coding | tolerated(0.09) | probably_damaging(0.912) | TCGA-AP-A1DR-01 | Endometrium | uterine corpus endometrioid carcinoma | Female | <65 | III/IV | Chemotherapy | cisplatin | SD |
| C1QTNF4 | SNV | Missense_Mutation | rs767479537 | c.802N>A | p.Glu268Lys | p.E268K | Q9BXJ3 | protein_coding | tolerated(0.29) | benign(0.28) | TCGA-AP-A1DV-01 | Endometrium | uterine corpus endometrioid carcinoma | Female | <65 | I/II | Unknown | Unknown | SD |
| Page: 1 2 3 |
Top |
Related drugs of malignant transformation related genes |
| Identification of chemicals and drugs interact with genes involved in malignant transfromation |
| (DGIdb 4.0) |
| Entrez ID | Symbol | Category | Interaction Types | Drug Claim Name | Drug Name | PMIDs |
| Page: 1 |

Copyright 2023-Present -The University of Texas Health Science Center at Houston |