
|
|||||
|
 | |
| |
| |
| |
| |
| |
|
Gene: C1QTNF1 |
Gene summary for C1QTNF1 |
| Gene information | Species | Human | Gene symbol | C1QTNF1 | Gene ID | 114897 |
| Gene name | C1q and TNF related 1 | |
| Gene Alias | CTRP1 | |
| Cytomap | 17q25.3 | |
| Gene Type | protein-coding | GO ID | GO:0000165 | UniProtAcc | Q9BXJ1 |
Top |
Malignant transformation analysis |
| Identification of the aberrant gene expression in precancerous and cancerous lesions by comparing the gene expression of stem-like cells in diseased tissues with normal stem cells |
| Entrez ID | Symbol | Replicates | Species | Organ | Tissue | Adj P-value | Log2FC | Malignancy |
| 114897 | C1QTNF1 | P2T-E | Human | Esophagus | ESCC | 3.96e-18 | 5.31e-01 | 0.1177 |
| 114897 | C1QTNF1 | P9T-E | Human | Esophagus | ESCC | 1.97e-02 | 2.21e-01 | 0.1131 |
| 114897 | C1QTNF1 | P10T-E | Human | Esophagus | ESCC | 6.69e-31 | 6.04e-01 | 0.116 |
| 114897 | C1QTNF1 | P11T-E | Human | Esophagus | ESCC | 2.66e-10 | 9.08e-01 | 0.1426 |
| 114897 | C1QTNF1 | P15T-E | Human | Esophagus | ESCC | 2.90e-06 | 2.72e-01 | 0.1149 |
| 114897 | C1QTNF1 | P16T-E | Human | Esophagus | ESCC | 2.69e-08 | 3.37e-01 | 0.1153 |
| 114897 | C1QTNF1 | P17T-E | Human | Esophagus | ESCC | 8.35e-09 | 3.17e-01 | 0.1278 |
| 114897 | C1QTNF1 | P21T-E | Human | Esophagus | ESCC | 6.00e-11 | 3.02e-01 | 0.1617 |
| 114897 | C1QTNF1 | P22T-E | Human | Esophagus | ESCC | 3.53e-07 | 1.11e-01 | 0.1236 |
| 114897 | C1QTNF1 | P23T-E | Human | Esophagus | ESCC | 4.71e-02 | 2.64e-01 | 0.108 |
| 114897 | C1QTNF1 | P24T-E | Human | Esophagus | ESCC | 9.64e-22 | 5.97e-01 | 0.1287 |
| 114897 | C1QTNF1 | P26T-E | Human | Esophagus | ESCC | 2.23e-02 | 1.26e-01 | 0.1276 |
| 114897 | C1QTNF1 | P30T-E | Human | Esophagus | ESCC | 1.22e-06 | 5.67e-01 | 0.137 |
| 114897 | C1QTNF1 | P32T-E | Human | Esophagus | ESCC | 4.13e-18 | 7.56e-01 | 0.1666 |
| 114897 | C1QTNF1 | P36T-E | Human | Esophagus | ESCC | 1.68e-08 | 4.11e-01 | 0.1187 |
| 114897 | C1QTNF1 | P37T-E | Human | Esophagus | ESCC | 1.54e-12 | 3.83e-01 | 0.1371 |
| 114897 | C1QTNF1 | P40T-E | Human | Esophagus | ESCC | 2.11e-05 | 2.77e-01 | 0.109 |
| 114897 | C1QTNF1 | P42T-E | Human | Esophagus | ESCC | 3.18e-11 | 5.05e-01 | 0.1175 |
| 114897 | C1QTNF1 | P44T-E | Human | Esophagus | ESCC | 2.83e-06 | 3.83e-01 | 0.1096 |
| 114897 | C1QTNF1 | P47T-E | Human | Esophagus | ESCC | 1.00e-03 | 2.28e-01 | 0.1067 |
| Page: 1 2 |
| Tissue | Expression Dynamics | Abbreviation |
| Esophagus | 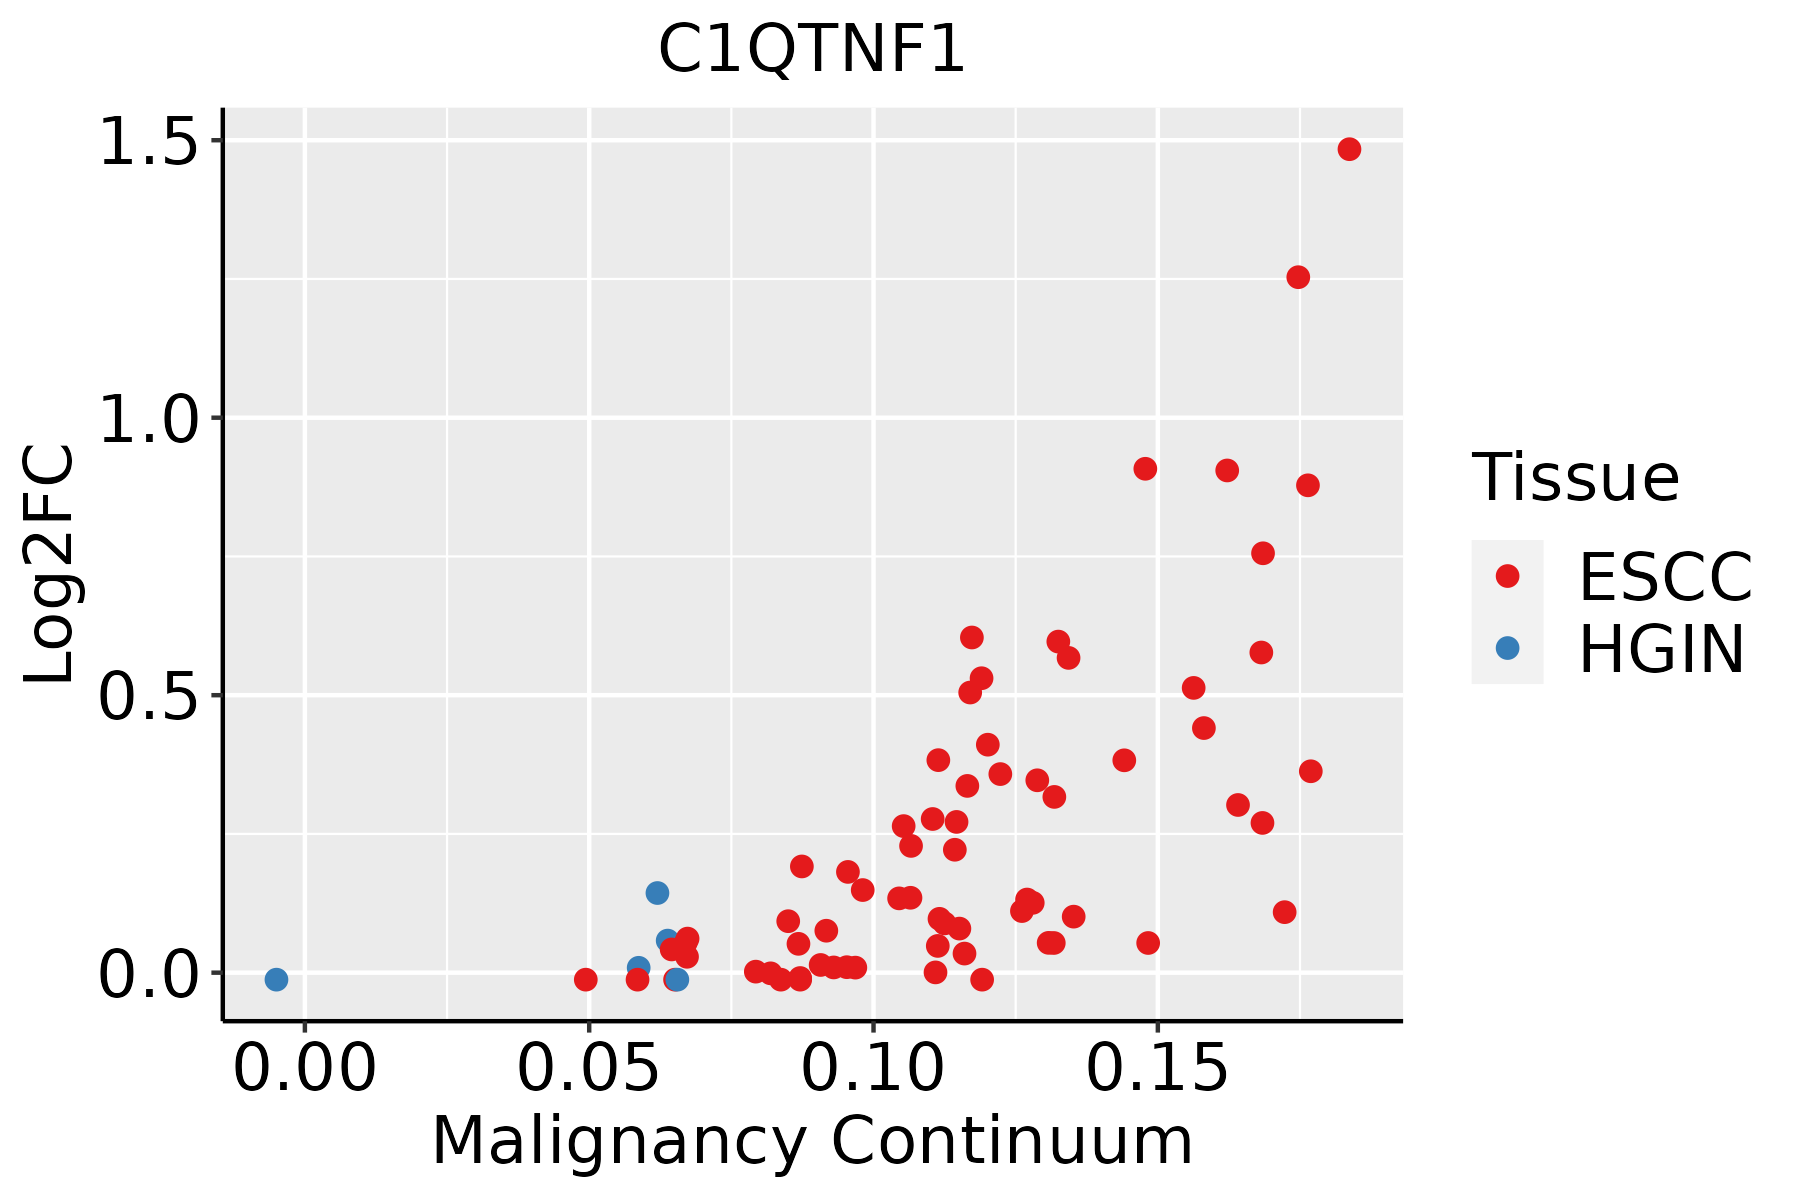 | ESCC: Esophageal squamous cell carcinoma |
| HGIN: High-grade intraepithelial neoplasias | ||
| LGIN: Low-grade intraepithelial neoplasias |
| ∗log2FC in expression of this searched gene in stem-like cells from each diseased tissue sample relative to stem-like cells in normal samples in each tissue plotted against the malignancy continuum. Samples are colored based on if they are from different disease stage. |
Top |
Malignant transformation related pathway analysis |
| Find out the enriched GO biological processes and KEGG pathways involved in transition from healthy to precancer to cancer |
| Tissue | Disease Stage | Enriched GO biological Processes |
| Colorectum | AD |  |
| Colorectum | SER |  |
| Colorectum | MSS |  |
| Colorectum | MSI-H |  |
| Colorectum | FAP |  |
| ∗Top 15 enriched GO BP terms are showed in the bar plot of each disease state in each tissue. Each row represents a significant GO biological process which is colored according to the -log10(p.adjust). |
| Page: 1 2 3 4 5 6 7 8 9 |
| GO ID | Tissue | Disease Stage | Description | Gene Ratio | Bg Ratio | pvalue | p.adjust | Count |
| GO:00059969 | Esophagus | ESCC | monosaccharide metabolic process | 159/8552 | 257/18723 | 1.11e-07 | 1.81e-06 | 159 |
| GO:00193189 | Esophagus | ESCC | hexose metabolic process | 147/8552 | 237/18723 | 2.63e-07 | 3.94e-06 | 147 |
| GO:004206027 | Esophagus | ESCC | wound healing | 243/8552 | 422/18723 | 4.62e-07 | 6.25e-06 | 243 |
| GO:00060069 | Esophagus | ESCC | glucose metabolic process | 119/8552 | 196/18723 | 1.51e-05 | 1.36e-04 | 119 |
| GO:00442626 | Esophagus | ESCC | cellular carbohydrate metabolic process | 160/8552 | 283/18723 | 1.43e-04 | 9.66e-04 | 160 |
| GO:00620129 | Esophagus | ESCC | regulation of small molecule metabolic process | 184/8552 | 334/18723 | 3.11e-04 | 1.85e-03 | 184 |
| GO:002240720 | Esophagus | ESCC | regulation of cell-cell adhesion | 239/8552 | 448/18723 | 5.88e-04 | 3.19e-03 | 239 |
| GO:00109065 | Esophagus | ESCC | regulation of glucose metabolic process | 71/8552 | 119/18723 | 1.46e-03 | 6.92e-03 | 71 |
| GO:00061096 | Esophagus | ESCC | regulation of carbohydrate metabolic process | 101/8552 | 178/18723 | 1.89e-03 | 8.52e-03 | 101 |
| GO:00106755 | Esophagus | ESCC | regulation of cellular carbohydrate metabolic process | 83/8552 | 146/18723 | 4.24e-03 | 1.69e-02 | 83 |
| GO:003410920 | Esophagus | ESCC | homotypic cell-cell adhesion | 54/8552 | 90/18723 | 4.33e-03 | 1.72e-02 | 54 |
| GO:190303420 | Esophagus | ESCC | regulation of response to wounding | 93/8552 | 167/18723 | 5.77e-03 | 2.14e-02 | 93 |
| Page: 1 |
| Pathway ID | Tissue | Disease Stage | Description | Gene Ratio | Bg Ratio | pvalue | p.adjust | qvalue | Count |
| Page: 1 |
Top |
Cell-cell communication analysis |
| Identification of potential cell-cell interactions between two cell types and their ligand-receptor pairs for different disease states |
| Ligand | Receptor | LRpair | Pathway | Tissue | Disease Stage |
| Page: 1 |
Top |
Single-cell gene regulatory network inference analysis |
| Find out the significant the regulons (TFs) and the target genes of each regulon across cell types for different disease states |
| TF | Cell Type | Tissue | Disease Stage | Target Gene | RSS | Regulon Activity |
| ∗The dot plots of a searched regulon are shown for all cell subpopulations in each disease state of each tissue based on the regulon specific score inferred using pySCENIC and by calculating the average expression. |
| Page: 1 |
Top |
Somatic mutation of malignant transformation related genes |
| Annotation of somatic variants for genes involved in malignant transformation |
| Hugo Symbol | Variant Class | Variant Classification | dbSNP RS | HGVSc | HGVSp | HGVSp Short | SWISSPROT | BIOTYPE | SIFT | PolyPhen | Tumor Sample Barcode | Tissue | Histology | Sex | Age | Stage | Therapy Types | Drugs | Outcome |
| C1QTNF1 | SNV | Missense_Mutation | rs758961252 | c.262G>A | p.Ala88Thr | p.A88T | Q9BXJ1 | protein_coding | tolerated(0.21) | benign(0.056) | TCGA-UL-AAZ6-01 | Breast | breast invasive carcinoma | Female | >=65 | I/II | Chemotherapy | herceptin | SD |
| C1QTNF1 | deletion | Frame_Shift_Del | novel | c.97delG | p.Glu33AsnfsTer65 | p.E33Nfs*65 | Q9BXJ1 | protein_coding | TCGA-EW-A2FV-01 | Breast | breast invasive carcinoma | Female | <65 | III/IV | Chemotherapy | docetaxel | SD | ||
| C1QTNF1 | SNV | Missense_Mutation | rs200367788 | c.838N>A | p.Glu280Lys | p.E280K | Q9BXJ1 | protein_coding | deleterious(0) | possibly_damaging(0.67) | TCGA-2W-A8YY-01 | Cervix | cervical & endocervical cancer | Female | <65 | I/II | Chemotherapy | cisplatin | CR |
| C1QTNF1 | SNV | Missense_Mutation | c.89N>C | p.Val30Ala | p.V30A | Q9BXJ1 | protein_coding | tolerated_low_confidence(0.85) | benign(0) | TCGA-FU-A3HZ-01 | Cervix | cervical & endocervical cancer | Female | <65 | I/II | Chemotherapy | cisplatin | CR | |
| C1QTNF1 | SNV | Missense_Mutation | c.245N>A | p.Ser82Tyr | p.S82Y | Q9BXJ1 | protein_coding | deleterious(0) | benign(0.005) | TCGA-Q1-A73O-01 | Cervix | cervical & endocervical cancer | Female | <65 | I/II | Chemotherapy | cisplatin | CR | |
| C1QTNF1 | SNV | Missense_Mutation | novel | c.534C>G | p.Phe178Leu | p.F178L | Q9BXJ1 | protein_coding | deleterious(0.04) | probably_damaging(0.998) | TCGA-VS-A8EK-01 | Cervix | cervical & endocervical cancer | Female | >=65 | I/II | Chemotherapy | cisplatin | PD |
| C1QTNF1 | SNV | Missense_Mutation | c.628N>T | p.His210Tyr | p.H210Y | Q9BXJ1 | protein_coding | deleterious(0) | probably_damaging(0.996) | TCGA-AA-3672-01 | Colorectum | colon adenocarcinoma | Female | >=65 | III/IV | Unknown | Unknown | SD | |
| C1QTNF1 | SNV | Missense_Mutation | novel | c.88N>A | p.Val30Ile | p.V30I | Q9BXJ1 | protein_coding | tolerated_low_confidence(0.22) | benign(0) | TCGA-AA-3811-01 | Colorectum | colon adenocarcinoma | Female | >=65 | III/IV | Unknown | Unknown | PD |
| C1QTNF1 | SNV | Missense_Mutation | c.572N>A | p.Gly191Asp | p.G191D | Q9BXJ1 | protein_coding | deleterious(0) | probably_damaging(1) | TCGA-AA-3811-01 | Colorectum | colon adenocarcinoma | Female | >=65 | III/IV | Unknown | Unknown | PD | |
| C1QTNF1 | SNV | Missense_Mutation | rs767734960 | c.436N>A | p.Ala146Thr | p.A146T | Q9BXJ1 | protein_coding | deleterious(0) | possibly_damaging(0.661) | TCGA-AA-A00N-01 | Colorectum | colon adenocarcinoma | Male | >=65 | I/II | Unknown | Unknown | PD |
| Page: 1 2 3 4 5 |
Top |
Related drugs of malignant transformation related genes |
| Identification of chemicals and drugs interact with genes involved in malignant transfromation |
| (DGIdb 4.0) |
| Entrez ID | Symbol | Category | Interaction Types | Drug Claim Name | Drug Name | PMIDs |
| Page: 1 |

Copyright 2023-Present -The University of Texas Health Science Center at Houston |