
|
|||||
|
 | |
| |
| |
| |
| |
| |
|
Gene: C1QC |
Gene summary for C1QC |
| Gene information | Species | Human | Gene symbol | C1QC | Gene ID | 714 |
| Gene name | complement C1q C chain | |
| Gene Alias | C1Q-C | |
| Cytomap | 1p36.12 | |
| Gene Type | protein-coding | GO ID | GO:0002250 | UniProtAcc | A0A024RAA7 |
Top |
Malignant transformation analysis |
| Identification of the aberrant gene expression in precancerous and cancerous lesions by comparing the gene expression of stem-like cells in diseased tissues with normal stem cells |
| Entrez ID | Symbol | Replicates | Species | Organ | Tissue | Adj P-value | Log2FC | Malignancy |
| 714 | C1QC | NCCBC11 | Human | Breast | DCIS | 2.63e-09 | 8.21e-01 | 0.1232 |
| 714 | C1QC | NCCBC14 | Human | Breast | DCIS | 1.26e-05 | 3.91e-01 | 0.2021 |
| 714 | C1QC | NCCBC3 | Human | Breast | DCIS | 1.27e-62 | 1.20e+00 | 0.1198 |
| 714 | C1QC | NCCBC5 | Human | Breast | DCIS | 5.12e-13 | 5.97e-01 | 0.2046 |
| 714 | C1QC | HCC1_Meng | Human | Liver | HCC | 2.30e-12 | 3.92e-02 | 0.0246 |
| 714 | C1QC | cirrhotic2 | Human | Liver | Cirrhotic | 4.20e-04 | 3.37e-02 | 0.0201 |
| 714 | C1QC | Pt13.a | Human | Liver | HCC | 1.71e-15 | 5.76e-01 | 0.021 |
| 714 | C1QC | Pt13.b | Human | Liver | HCC | 5.63e-05 | 3.16e-01 | 0.0251 |
| 714 | C1QC | Pt13.c | Human | Liver | HCC | 1.04e-47 | 1.51e+00 | 0.0076 |
| 714 | C1QC | Pt14.d | Human | Liver | HCC | 2.58e-38 | 1.06e+00 | 0.0143 |
| 714 | C1QC | S028 | Human | Liver | HCC | 3.73e-02 | 3.87e-01 | 0.2503 |
| 714 | C1QC | S029 | Human | Liver | HCC | 2.09e-02 | 1.65e+00 | 0.2581 |
| 714 | C1QC | C21 | Human | Oral cavity | OSCC | 8.30e-87 | 2.56e+00 | 0.2678 |
| 714 | C1QC | C30 | Human | Oral cavity | OSCC | 5.19e-15 | 5.94e-01 | 0.3055 |
| 714 | C1QC | C38 | Human | Oral cavity | OSCC | 1.30e-03 | 3.73e-01 | 0.172 |
| 714 | C1QC | C51 | Human | Oral cavity | OSCC | 9.24e-12 | 4.13e-01 | 0.2674 |
| 714 | C1QC | C08 | Human | Oral cavity | OSCC | 2.39e-03 | 3.07e-01 | 0.1919 |
| 714 | C1QC | LN46 | Human | Oral cavity | OSCC | 3.46e-08 | 3.74e-01 | 0.1666 |
| 714 | C1QC | SYSMH6 | Human | Oral cavity | OSCC | 4.26e-04 | 7.31e-02 | 0.1275 |
| Page: 1 |
| Tissue | Expression Dynamics | Abbreviation |
| Breast |  | IDC: Invasive ductal carcinoma |
| DCIS: Ductal carcinoma in situ | ||
| Precancer(BRCA1-mut): Precancerous lesion from BRCA1 mutation carriers | ||
| Liver | 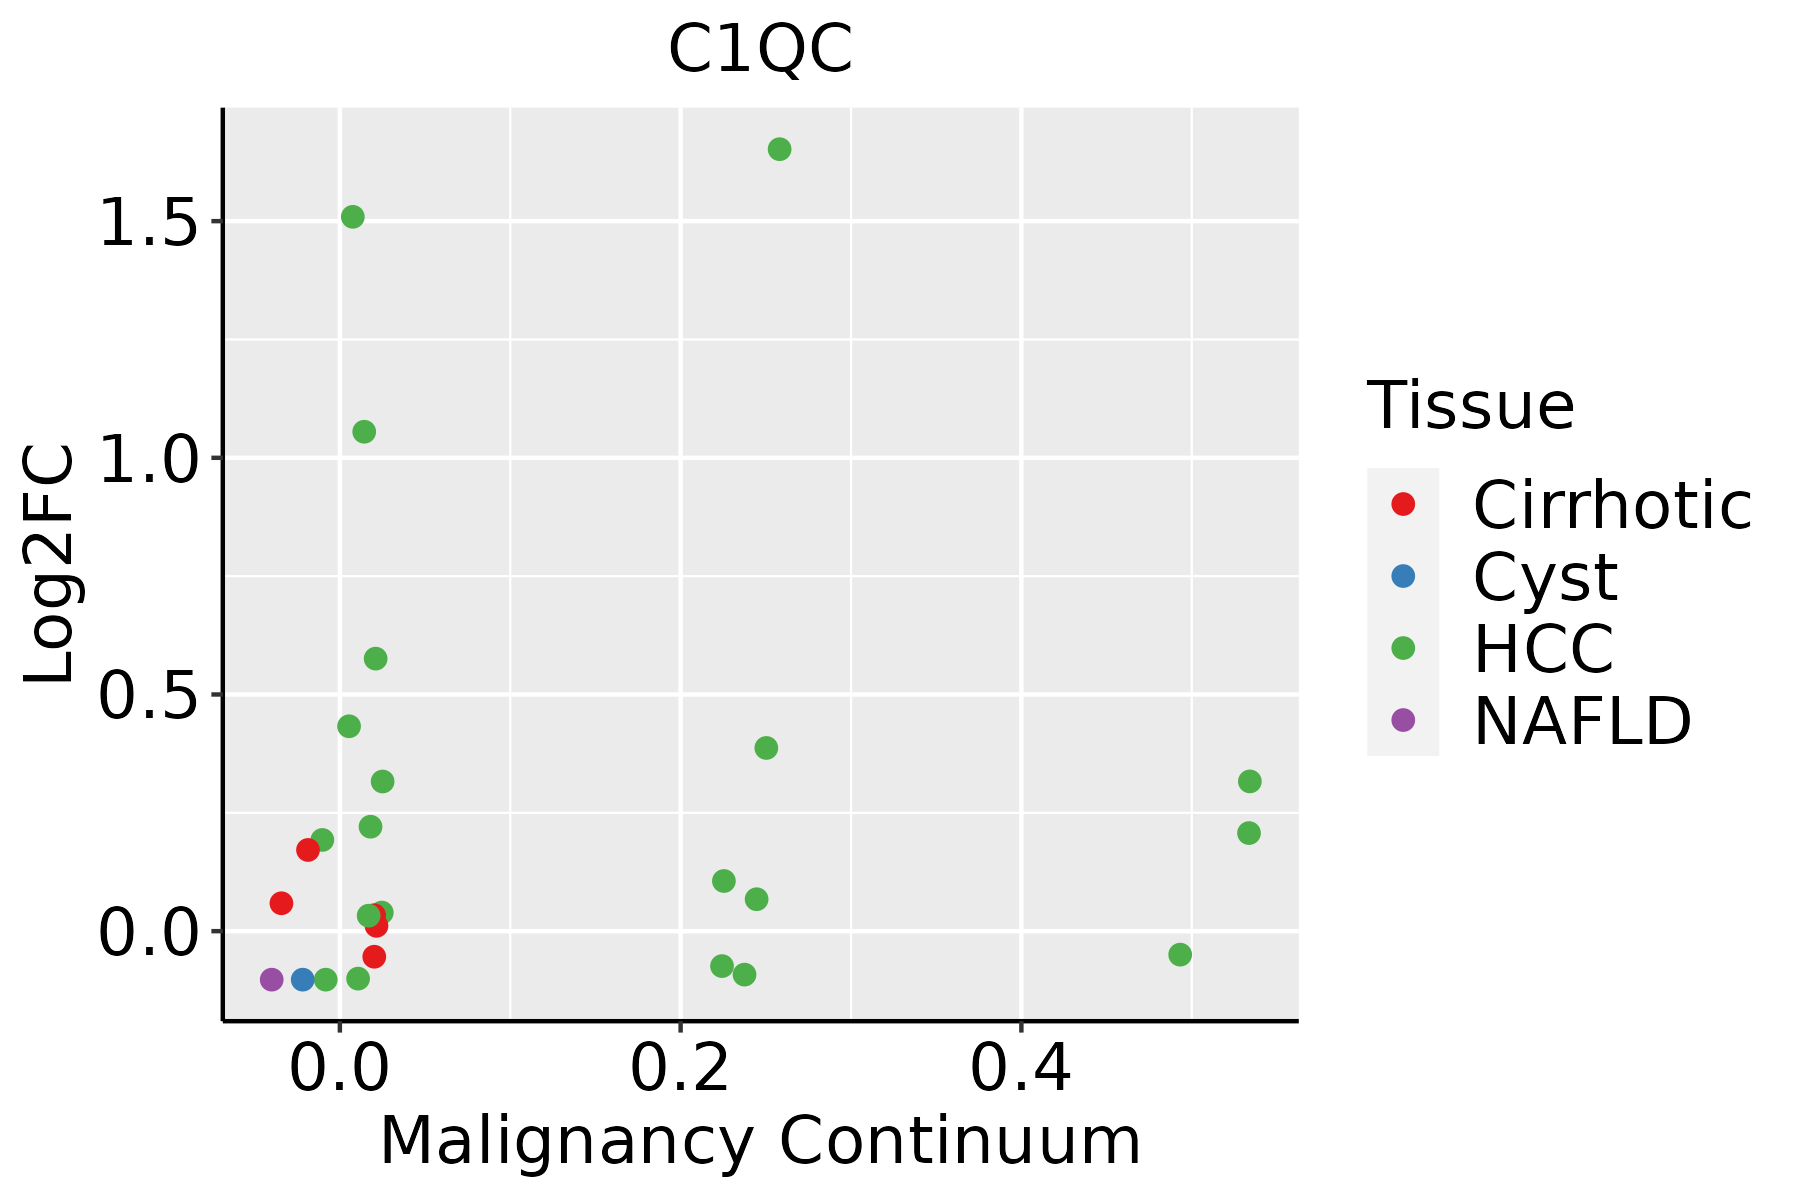 | HCC: Hepatocellular carcinoma |
| NAFLD: Non-alcoholic fatty liver disease | ||
| Oral Cavity |  | EOLP: Erosive Oral lichen planus |
| LP: leukoplakia | ||
| NEOLP: Non-erosive oral lichen planus | ||
| OSCC: Oral squamous cell carcinoma |
| ∗log2FC in expression of this searched gene in stem-like cells from each diseased tissue sample relative to stem-like cells in normal samples in each tissue plotted against the malignancy continuum. Samples are colored based on if they are from different disease stage. |
Top |
Malignant transformation related pathway analysis |
| Find out the enriched GO biological processes and KEGG pathways involved in transition from healthy to precancer to cancer |
| Tissue | Disease Stage | Enriched GO biological Processes |
| Colorectum | AD |  |
| Colorectum | SER |  |
| Colorectum | MSS |  |
| Colorectum | MSI-H |  |
| Colorectum | FAP |  |
| ∗Top 15 enriched GO BP terms are showed in the bar plot of each disease state in each tissue. Each row represents a significant GO biological process which is colored according to the -log10(p.adjust). |
| Page: 1 2 3 4 5 6 7 8 9 |
| GO ID | Tissue | Disease Stage | Description | Gene Ratio | Bg Ratio | pvalue | p.adjust | Count |
| GO:003009924 | Breast | DCIS | myeloid cell differentiation | 55/1390 | 381/18723 | 1.50e-06 | 5.68e-05 | 55 |
| GO:000257321 | Breast | DCIS | myeloid leukocyte differentiation | 34/1390 | 208/18723 | 1.08e-05 | 2.83e-04 | 34 |
| GO:004563722 | Breast | DCIS | regulation of myeloid cell differentiation | 34/1390 | 210/18723 | 1.33e-05 | 3.32e-04 | 34 |
| GO:000268321 | Breast | DCIS | negative regulation of immune system process | 57/1390 | 434/18723 | 1.81e-05 | 4.35e-04 | 57 |
| GO:190370622 | Breast | DCIS | regulation of hemopoiesis | 50/1390 | 367/18723 | 2.21e-05 | 5.23e-04 | 50 |
| GO:190210521 | Breast | DCIS | regulation of leukocyte differentiation | 37/1390 | 279/18723 | 4.19e-04 | 5.65e-03 | 37 |
| GO:000276121 | Breast | DCIS | regulation of myeloid leukocyte differentiation | 20/1390 | 120/18723 | 5.16e-04 | 6.73e-03 | 20 |
| GO:190210621 | Breast | DCIS | negative regulation of leukocyte differentiation | 17/1390 | 102/18723 | 1.31e-03 | 1.37e-02 | 17 |
| GO:190370721 | Breast | DCIS | negative regulation of hemopoiesis | 17/1390 | 106/18723 | 2.02e-03 | 1.89e-02 | 17 |
| GO:000225311 | Breast | DCIS | activation of immune response | 43/1390 | 375/18723 | 2.96e-03 | 2.54e-02 | 43 |
| GO:000695911 | Breast | DCIS | humoral immune response | 37/1390 | 317/18723 | 4.16e-03 | 3.29e-02 | 37 |
| GO:002241113 | Breast | DCIS | cellular component disassembly | 48/1390 | 443/18723 | 5.35e-03 | 3.92e-02 | 48 |
| GO:00224117 | Liver | Cirrhotic | cellular component disassembly | 182/4634 | 443/18723 | 1.59e-14 | 1.54e-12 | 182 |
| GO:003009912 | Liver | Cirrhotic | myeloid cell differentiation | 135/4634 | 381/18723 | 1.69e-06 | 3.22e-05 | 135 |
| GO:0150146 | Liver | Cirrhotic | cell junction disassembly | 12/4634 | 21/18723 | 1.53e-03 | 9.98e-03 | 12 |
| GO:00025735 | Liver | Cirrhotic | myeloid leukocyte differentiation | 70/4634 | 208/18723 | 2.34e-03 | 1.42e-02 | 70 |
| GO:00456377 | Liver | Cirrhotic | regulation of myeloid cell differentiation | 68/4634 | 210/18723 | 7.40e-03 | 3.53e-02 | 68 |
| GO:002241112 | Liver | HCC | cellular component disassembly | 282/7958 | 443/18723 | 1.02e-19 | 1.38e-17 | 282 |
| GO:003009922 | Liver | HCC | myeloid cell differentiation | 200/7958 | 381/18723 | 4.64e-05 | 4.49e-04 | 200 |
| GO:01501461 | Liver | HCC | cell junction disassembly | 15/7958 | 21/18723 | 7.03e-03 | 2.80e-02 | 15 |
| Page: 1 2 |
| Pathway ID | Tissue | Disease Stage | Description | Gene Ratio | Bg Ratio | pvalue | p.adjust | qvalue | Count |
| hsa0502043 | Breast | DCIS | Prion disease | 100/846 | 273/8465 | 1.44e-33 | 1.55e-31 | 1.14e-31 | 100 |
| hsa0517144 | Breast | DCIS | Coronavirus disease - COVID-19 | 86/846 | 232/8465 | 2.42e-29 | 1.56e-27 | 1.15e-27 | 86 |
| hsa05150 | Breast | DCIS | Staphylococcus aureus infection | 19/846 | 96/8465 | 2.68e-03 | 1.67e-02 | 1.23e-02 | 19 |
| hsa051336 | Breast | DCIS | Pertussis | 15/846 | 76/8465 | 7.42e-03 | 3.48e-02 | 2.56e-02 | 15 |
| hsa0502053 | Breast | DCIS | Prion disease | 100/846 | 273/8465 | 1.44e-33 | 1.55e-31 | 1.14e-31 | 100 |
| hsa0517154 | Breast | DCIS | Coronavirus disease - COVID-19 | 86/846 | 232/8465 | 2.42e-29 | 1.56e-27 | 1.15e-27 | 86 |
| hsa051501 | Breast | DCIS | Staphylococcus aureus infection | 19/846 | 96/8465 | 2.68e-03 | 1.67e-02 | 1.23e-02 | 19 |
| hsa0513311 | Breast | DCIS | Pertussis | 15/846 | 76/8465 | 7.42e-03 | 3.48e-02 | 2.56e-02 | 15 |
| hsa0517122 | Liver | Cirrhotic | Coronavirus disease - COVID-19 | 136/2530 | 232/8465 | 3.28e-20 | 1.82e-18 | 1.12e-18 | 136 |
| hsa0502014 | Liver | Cirrhotic | Prion disease | 152/2530 | 273/8465 | 1.84e-19 | 8.78e-18 | 5.41e-18 | 152 |
| hsa046102 | Liver | Cirrhotic | Complement and coagulation cascades | 48/2530 | 86/8465 | 4.41e-07 | 5.44e-06 | 3.35e-06 | 48 |
| hsa05133 | Liver | Cirrhotic | Pertussis | 37/2530 | 76/8465 | 4.17e-04 | 2.57e-03 | 1.58e-03 | 37 |
| hsa04936 | Liver | Cirrhotic | Alcoholic liver disease | 60/2530 | 142/8465 | 1.07e-03 | 5.85e-03 | 3.61e-03 | 60 |
| hsa0517132 | Liver | Cirrhotic | Coronavirus disease - COVID-19 | 136/2530 | 232/8465 | 3.28e-20 | 1.82e-18 | 1.12e-18 | 136 |
| hsa0502015 | Liver | Cirrhotic | Prion disease | 152/2530 | 273/8465 | 1.84e-19 | 8.78e-18 | 5.41e-18 | 152 |
| hsa046103 | Liver | Cirrhotic | Complement and coagulation cascades | 48/2530 | 86/8465 | 4.41e-07 | 5.44e-06 | 3.35e-06 | 48 |
| hsa051331 | Liver | Cirrhotic | Pertussis | 37/2530 | 76/8465 | 4.17e-04 | 2.57e-03 | 1.58e-03 | 37 |
| hsa049361 | Liver | Cirrhotic | Alcoholic liver disease | 60/2530 | 142/8465 | 1.07e-03 | 5.85e-03 | 3.61e-03 | 60 |
| hsa0502022 | Liver | HCC | Prion disease | 195/4020 | 273/8465 | 3.26e-16 | 1.56e-14 | 8.67e-15 | 195 |
| hsa0517142 | Liver | HCC | Coronavirus disease - COVID-19 | 167/4020 | 232/8465 | 1.50e-14 | 4.19e-13 | 2.33e-13 | 167 |
| Page: 1 2 |
Top |
Cell-cell communication analysis |
| Identification of potential cell-cell interactions between two cell types and their ligand-receptor pairs for different disease states |
| Ligand | Receptor | LRpair | Pathway | Tissue | Disease Stage |
| Page: 1 |
Top |
Single-cell gene regulatory network inference analysis |
| Find out the significant the regulons (TFs) and the target genes of each regulon across cell types for different disease states |
| TF | Cell Type | Tissue | Disease Stage | Target Gene | RSS | Regulon Activity |
| ∗The dot plots of a searched regulon are shown for all cell subpopulations in each disease state of each tissue based on the regulon specific score inferred using pySCENIC and by calculating the average expression. |
| Page: 1 |
Top |
Somatic mutation of malignant transformation related genes |
| Annotation of somatic variants for genes involved in malignant transformation |
| Hugo Symbol | Variant Class | Variant Classification | dbSNP RS | HGVSc | HGVSp | HGVSp Short | SWISSPROT | BIOTYPE | SIFT | PolyPhen | Tumor Sample Barcode | Tissue | Histology | Sex | Age | Stage | Therapy Types | Drugs | Outcome |
| C1QC | deletion | Frame_Shift_Del | c.650_659delNNNNNNNNNN | p.Trp218SerfsTer103 | p.W218Sfs*103 | P02747 | protein_coding | TCGA-E9-A22G-01 | Breast | breast invasive carcinoma | Female | <65 | I/II | Chemotherapy | doxorubicin | SD | |||
| C1QC | SNV | Missense_Mutation | c.676N>A | p.Asp226Asn | p.D226N | P02747 | protein_coding | tolerated(0.05) | benign(0) | TCGA-EA-A411-01 | Cervix | cervical & endocervical cancer | Female | <65 | I/II | Unknown | Unknown | SD | |
| C1QC | SNV | Missense_Mutation | rs772221556 | c.514N>A | p.Ala172Thr | p.A172T | P02747 | protein_coding | tolerated(0.7) | benign(0.145) | TCGA-AA-3811-01 | Colorectum | colon adenocarcinoma | Female | >=65 | III/IV | Unknown | Unknown | PD |
| C1QC | SNV | Missense_Mutation | c.420N>A | p.Phe140Leu | p.F140L | P02747 | protein_coding | deleterious(0) | probably_damaging(1) | TCGA-AA-3984-01 | Colorectum | colon adenocarcinoma | Female | <65 | I/II | Unknown | Unknown | SD | |
| C1QC | SNV | Missense_Mutation | c.154N>A | p.Gly52Arg | p.G52R | P02747 | protein_coding | deleterious(0) | probably_damaging(1) | TCGA-AU-6004-01 | Colorectum | colon adenocarcinoma | Female | >=65 | I/II | Unknown | Unknown | SD | |
| C1QC | SNV | Missense_Mutation | c.356A>C | p.Gln119Pro | p.Q119P | P02747 | protein_coding | deleterious(0) | possibly_damaging(0.889) | TCGA-WS-AB45-01 | Colorectum | colon adenocarcinoma | Female | <65 | I/II | Unknown | Unknown | SD | |
| C1QC | SNV | Missense_Mutation | rs369345026 | c.368C>T | p.Thr123Met | p.T123M | P02747 | protein_coding | deleterious(0) | probably_damaging(0.962) | TCGA-A5-A0GH-01 | Endometrium | uterine corpus endometrioid carcinoma | Female | <65 | I/II | Unknown | Unknown | SD |
| C1QC | SNV | Missense_Mutation | c.190N>A | p.Ala64Thr | p.A64T | P02747 | protein_coding | deleterious(0.01) | possibly_damaging(0.805) | TCGA-A5-A0GI-01 | Endometrium | uterine corpus endometrioid carcinoma | Female | <65 | I/II | Unknown | Unknown | SD | |
| C1QC | SNV | Missense_Mutation | novel | c.101N>A | p.Gly34Glu | p.G34E | P02747 | protein_coding | deleterious(0) | probably_damaging(0.99) | TCGA-AP-A1DK-01 | Endometrium | uterine corpus endometrioid carcinoma | Female | <65 | I/II | Unknown | Unknown | SD |
| C1QC | SNV | Missense_Mutation | rs765611134 | c.251N>A | p.Pro84His | p.P84H | P02747 | protein_coding | deleterious(0.01) | probably_damaging(0.933) | TCGA-AP-A1DK-01 | Endometrium | uterine corpus endometrioid carcinoma | Female | <65 | I/II | Unknown | Unknown | SD |
| Page: 1 2 3 4 |
Top |
Related drugs of malignant transformation related genes |
| Identification of chemicals and drugs interact with genes involved in malignant transfromation |
| (DGIdb 4.0) |
| Entrez ID | Symbol | Category | Interaction Types | Drug Claim Name | Drug Name | PMIDs |
| Page: 1 |

Copyright 2023-Present -The University of Texas Health Science Center at Houston |